
- school Campus Bookshelves
- menu_book Bookshelves
- perm_media Learning Objects
- login Login
- how_to_reg Request Instructor Account
- hub Instructor Commons

Margin Size
- Download Page (PDF)
- Download Full Book (PDF)
- Periodic Table
- Physics Constants
- Scientific Calculator
- Reference & Cite
- Tools expand_more
- Readability
selected template will load here
This action is not available.
1.2: The 7-Step Process of Statistical Hypothesis Testing
- Last updated
- Save as PDF
- Page ID 33320

- Penn State's Department of Statistics
- The Pennsylvania State University
\( \newcommand{\vecs}[1]{\overset { \scriptstyle \rightharpoonup} {\mathbf{#1}} } \)
\( \newcommand{\vecd}[1]{\overset{-\!-\!\rightharpoonup}{\vphantom{a}\smash {#1}}} \)
\( \newcommand{\id}{\mathrm{id}}\) \( \newcommand{\Span}{\mathrm{span}}\)
( \newcommand{\kernel}{\mathrm{null}\,}\) \( \newcommand{\range}{\mathrm{range}\,}\)
\( \newcommand{\RealPart}{\mathrm{Re}}\) \( \newcommand{\ImaginaryPart}{\mathrm{Im}}\)
\( \newcommand{\Argument}{\mathrm{Arg}}\) \( \newcommand{\norm}[1]{\| #1 \|}\)
\( \newcommand{\inner}[2]{\langle #1, #2 \rangle}\)
\( \newcommand{\Span}{\mathrm{span}}\)
\( \newcommand{\id}{\mathrm{id}}\)
\( \newcommand{\kernel}{\mathrm{null}\,}\)
\( \newcommand{\range}{\mathrm{range}\,}\)
\( \newcommand{\RealPart}{\mathrm{Re}}\)
\( \newcommand{\ImaginaryPart}{\mathrm{Im}}\)
\( \newcommand{\Argument}{\mathrm{Arg}}\)
\( \newcommand{\norm}[1]{\| #1 \|}\)
\( \newcommand{\Span}{\mathrm{span}}\) \( \newcommand{\AA}{\unicode[.8,0]{x212B}}\)
\( \newcommand{\vectorA}[1]{\vec{#1}} % arrow\)
\( \newcommand{\vectorAt}[1]{\vec{\text{#1}}} % arrow\)
\( \newcommand{\vectorB}[1]{\overset { \scriptstyle \rightharpoonup} {\mathbf{#1}} } \)
\( \newcommand{\vectorC}[1]{\textbf{#1}} \)
\( \newcommand{\vectorD}[1]{\overrightarrow{#1}} \)
\( \newcommand{\vectorDt}[1]{\overrightarrow{\text{#1}}} \)
\( \newcommand{\vectE}[1]{\overset{-\!-\!\rightharpoonup}{\vphantom{a}\smash{\mathbf {#1}}}} \)
We will cover the seven steps one by one.
Step 1: State the Null Hypothesis
The null hypothesis can be thought of as the opposite of the "guess" the researchers made: in this example, the biologist thinks the plant height will be different for the fertilizers. So the null would be that there will be no difference among the groups of plants. Specifically, in more statistical language the null for an ANOVA is that the means are the same. We state the null hypothesis as: \[H_{0}: \ \mu_{1} = \mu_{2} = \ldots = \mu_{T}\] for \(T\) levels of an experimental treatment.
Why do we do this? Why not simply test the working hypothesis directly? The answer lies in the Popperian Principle of Falsification. Karl Popper (a philosopher) discovered that we can't conclusively confirm a hypothesis, but we can conclusively negate one. So we set up a null hypothesis which is effectively the opposite of the working hypothesis. The hope is that based on the strength of the data, we will be able to negate or reject the null hypothesis and accept an alternative hypothesis. In other words, we usually see the working hypothesis in \(H_{A}\).
Step 2: State the Alternative Hypothesis
\[H_{A}: \ \text{treatment level means not all equal}\]
The reason we state the alternative hypothesis this way is that if the null is rejected, there are many possibilities.
For example, \(\mu_{1} \neq \mu_{2} = \ldots = \mu_{T}\) is one possibility, as is \(\mu_{1} = \mu_{2} \neq \mu_{3} = \ldots = \mu_{T}\). Many people make the mistake of stating the alternative hypothesis as \(mu_{1} \neq mu_{2} \neq \ldots \neq \mu_{T}\), which says that every mean differs from every other mean. This is a possibility, but only one of many possibilities. To cover all alternative outcomes, we resort to a verbal statement of "not all equal" and then follow up with mean comparisons to find out where differences among means exist. In our example, this means that fertilizer 1 may result in plants that are really tall, but fertilizers 2, 3, and the plants with no fertilizers don't differ from one another. A simpler way of thinking about this is that at least one mean is different from all others.
Step 3: Set \(\alpha\)
If we look at what can happen in a hypothesis test, we can construct the following contingency table:
You should be familiar with type I and type II errors from your introductory course. It is important to note that we want to set \(\alpha\) before the experiment ( a priori ) because the Type I error is the more grievous error to make. The typical value of \(\alpha\) is 0.05, establishing a 95% confidence level. For this course, we will assume \(\alpha\) =0.05, unless stated otherwise.
Step 4: Collect Data
Remember the importance of recognizing whether data is collected through an experimental design or observational study.
Step 5: Calculate a test statistic
For categorical treatment level means, we use an \(F\) statistic, named after R.A. Fisher. We will explore the mechanics of computing the \(F\) statistic beginning in Chapter 2. The \(F\) value we get from the data is labeled \(F_{\text{calculated}}\).
Step 6: Construct Acceptance / Rejection regions
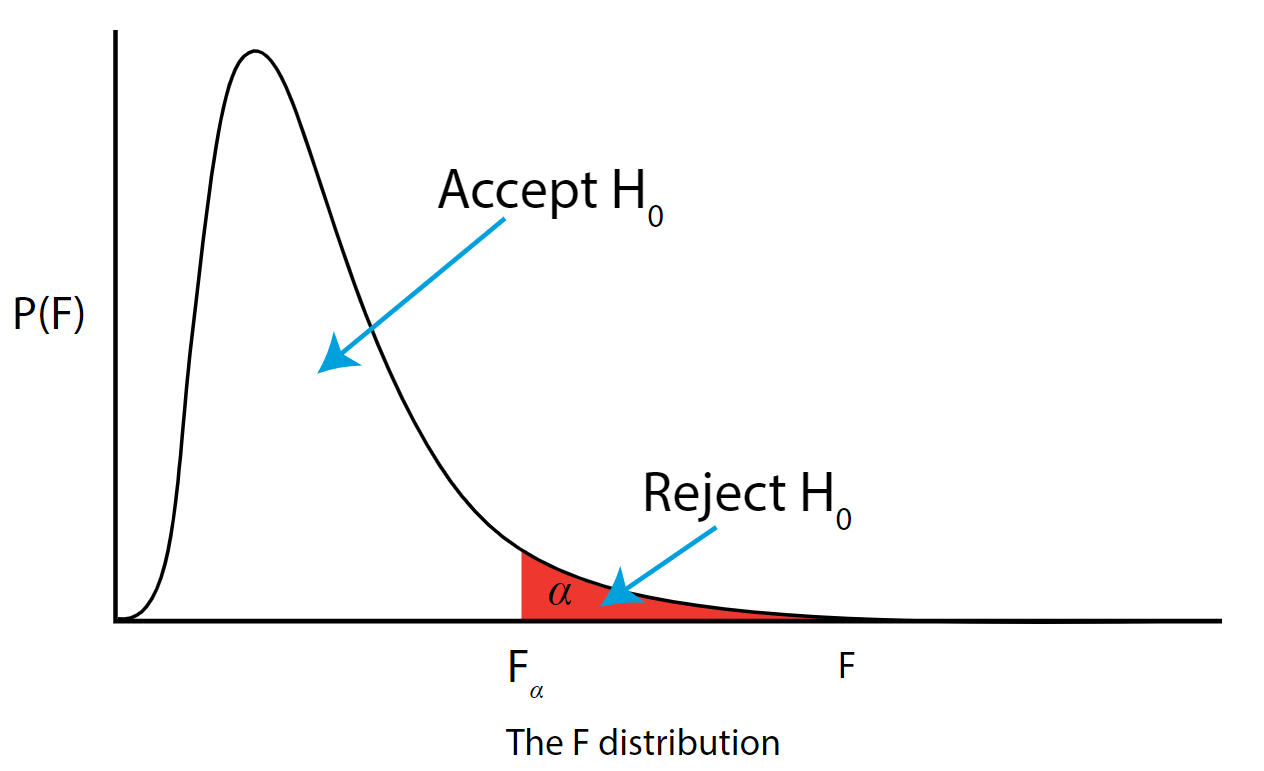
As with all other test statistics, a threshold (critical) value of \(F\) is established. This \(F\) value can be obtained from statistical tables or software and is referred to as \(F_{\text{critical}}\) or \(F_{\alpha}\). As a reminder, this critical value is the minimum value for the test statistic (in this case the F test) for us to be able to reject the null.
The \(F\) distribution, \(F_{\alpha}\), and the location of acceptance and rejection regions are shown in the graph below:
.png?revision=1&size=bestfit&width=629&height=383 "how to make a hypothesis test")
Step 7: Based on steps 5 and 6, draw a conclusion about H0
If the \(F_{\text{\calculated}}\) from the data is larger than the \(F_{\alpha}\), then you are in the rejection region and you can reject the null hypothesis with \((1 - \alpha)\) level of confidence.
Note that modern statistical software condenses steps 6 and 7 by providing a \(p\)-value. The \(p\)-value here is the probability of getting an \(F_{\text{calculated}}\) even greater than what you observe assuming the null hypothesis is true. If by chance, the \(F_{\text{calculated}} = F_{\alpha}\), then the \(p\)-value would exactly equal \(\alpha\). With larger \(F_{\text{calculated}}\) values, we move further into the rejection region and the \(p\) - value becomes less than \(\alpha\). So the decision rule is as follows:
If the \(p\) - value obtained from the ANOVA is less than \(\alpha\), then reject \(H_{0}\) and accept \(H_{A}\).
If you are not familiar with this material, we suggest that you review course materials from your basic statistics course.
Have a language expert improve your writing
Run a free plagiarism check in 10 minutes, automatically generate references for free.
- Knowledge Base
- Methodology
- How to Write a Strong Hypothesis | Guide & Examples
How to Write a Strong Hypothesis | Guide & Examples
Published on 6 May 2022 by Shona McCombes .
A hypothesis is a statement that can be tested by scientific research. If you want to test a relationship between two or more variables, you need to write hypotheses before you start your experiment or data collection.
Table of contents
What is a hypothesis, developing a hypothesis (with example), hypothesis examples, frequently asked questions about writing hypotheses.
A hypothesis states your predictions about what your research will find. It is a tentative answer to your research question that has not yet been tested. For some research projects, you might have to write several hypotheses that address different aspects of your research question.
A hypothesis is not just a guess – it should be based on existing theories and knowledge. It also has to be testable, which means you can support or refute it through scientific research methods (such as experiments, observations, and statistical analysis of data).
Variables in hypotheses
Hypotheses propose a relationship between two or more variables . An independent variable is something the researcher changes or controls. A dependent variable is something the researcher observes and measures.
In this example, the independent variable is exposure to the sun – the assumed cause . The dependent variable is the level of happiness – the assumed effect .
Prevent plagiarism, run a free check.
Step 1: ask a question.
Writing a hypothesis begins with a research question that you want to answer. The question should be focused, specific, and researchable within the constraints of your project.
Step 2: Do some preliminary research
Your initial answer to the question should be based on what is already known about the topic. Look for theories and previous studies to help you form educated assumptions about what your research will find.
At this stage, you might construct a conceptual framework to identify which variables you will study and what you think the relationships are between them. Sometimes, you’ll have to operationalise more complex constructs.
Step 3: Formulate your hypothesis
Now you should have some idea of what you expect to find. Write your initial answer to the question in a clear, concise sentence.
Step 4: Refine your hypothesis
You need to make sure your hypothesis is specific and testable. There are various ways of phrasing a hypothesis, but all the terms you use should have clear definitions, and the hypothesis should contain:
- The relevant variables
- The specific group being studied
- The predicted outcome of the experiment or analysis
Step 5: Phrase your hypothesis in three ways
To identify the variables, you can write a simple prediction in if … then form. The first part of the sentence states the independent variable and the second part states the dependent variable.
In academic research, hypotheses are more commonly phrased in terms of correlations or effects, where you directly state the predicted relationship between variables.
If you are comparing two groups, the hypothesis can state what difference you expect to find between them.
Step 6. Write a null hypothesis
If your research involves statistical hypothesis testing , you will also have to write a null hypothesis. The null hypothesis is the default position that there is no association between the variables. The null hypothesis is written as H 0 , while the alternative hypothesis is H 1 or H a .
Hypothesis testing is a formal procedure for investigating our ideas about the world using statistics. It is used by scientists to test specific predictions, called hypotheses , by calculating how likely it is that a pattern or relationship between variables could have arisen by chance.
A hypothesis is not just a guess. It should be based on existing theories and knowledge. It also has to be testable, which means you can support or refute it through scientific research methods (such as experiments, observations, and statistical analysis of data).
A research hypothesis is your proposed answer to your research question. The research hypothesis usually includes an explanation (‘ x affects y because …’).
A statistical hypothesis, on the other hand, is a mathematical statement about a population parameter. Statistical hypotheses always come in pairs: the null and alternative hypotheses. In a well-designed study , the statistical hypotheses correspond logically to the research hypothesis.
Cite this Scribbr article
If you want to cite this source, you can copy and paste the citation or click the ‘Cite this Scribbr article’ button to automatically add the citation to our free Reference Generator.
McCombes, S. (2022, May 06). How to Write a Strong Hypothesis | Guide & Examples. Scribbr. Retrieved 27 May 2024, from https://www.scribbr.co.uk/research-methods/hypothesis-writing/
Is this article helpful?

Shona McCombes
Other students also liked, operationalisation | a guide with examples, pros & cons, what is a conceptual framework | tips & examples, a quick guide to experimental design | 5 steps & examples.
Tutorial Playlist
Statistics tutorial, everything you need to know about the probability density function in statistics, the best guide to understand central limit theorem, an in-depth guide to measures of central tendency : mean, median and mode, the ultimate guide to understand conditional probability.
A Comprehensive Look at Percentile in Statistics
The Best Guide to Understand Bayes Theorem
Everything you need to know about the normal distribution, an in-depth explanation of cumulative distribution function, a complete guide to chi-square test, a complete guide on hypothesis testing in statistics, understanding the fundamentals of arithmetic and geometric progression, the definitive guide to understand spearman’s rank correlation, a comprehensive guide to understand mean squared error, all you need to know about the empirical rule in statistics, the complete guide to skewness and kurtosis, a holistic look at bernoulli distribution.
All You Need to Know About Bias in Statistics
A Complete Guide to Get a Grasp of Time Series Analysis
The Key Differences Between Z-Test Vs. T-Test
The Complete Guide to Understand Pearson's Correlation
A complete guide on the types of statistical studies, everything you need to know about poisson distribution, your best guide to understand correlation vs. regression, the most comprehensive guide for beginners on what is correlation, what is hypothesis testing in statistics beginner's guide.
Lesson 10 of 24 By Avijeet Biswal

Table of Contents
In today’s data-driven world , decisions are based on data all the time. Hypothesis plays a crucial role in that process, whether it may be making business decisions, in the health sector, academia, or in quality improvement. Without hypothesis & hypothesis tests, you risk drawing the wrong conclusions and making bad decisions. In this tutorial, you will look at Hypothesis Testing in Statistics.
What Is Hypothesis Testing in Statistics?
Hypothesis Testing is a type of statistical analysis in which you put your assumptions about a population parameter to the test. It is used to estimate the relationship between 2 statistical variables.
Let's discuss few examples of statistical hypothesis from real-life -
- A teacher assumes that 60% of his college's students come from lower-middle-class families.
- A doctor believes that 3D (Diet, Dose, and Discipline) is 90% effective for diabetic patients.
Now that you know about hypothesis testing, look at the two types of hypothesis testing in statistics.
Hypothesis Testing Formula
Z = ( x̅ – μ0 ) / (σ /√n)
- Here, x̅ is the sample mean,
- μ0 is the population mean,
- σ is the standard deviation,
- n is the sample size.
How Hypothesis Testing Works?
An analyst performs hypothesis testing on a statistical sample to present evidence of the plausibility of the null hypothesis. Measurements and analyses are conducted on a random sample of the population to test a theory. Analysts use a random population sample to test two hypotheses: the null and alternative hypotheses.
The null hypothesis is typically an equality hypothesis between population parameters; for example, a null hypothesis may claim that the population means return equals zero. The alternate hypothesis is essentially the inverse of the null hypothesis (e.g., the population means the return is not equal to zero). As a result, they are mutually exclusive, and only one can be correct. One of the two possibilities, however, will always be correct.
Your Dream Career is Just Around The Corner!
Null Hypothesis and Alternate Hypothesis
The Null Hypothesis is the assumption that the event will not occur. A null hypothesis has no bearing on the study's outcome unless it is rejected.
H0 is the symbol for it, and it is pronounced H-naught.
The Alternate Hypothesis is the logical opposite of the null hypothesis. The acceptance of the alternative hypothesis follows the rejection of the null hypothesis. H1 is the symbol for it.
Let's understand this with an example.
A sanitizer manufacturer claims that its product kills 95 percent of germs on average.
To put this company's claim to the test, create a null and alternate hypothesis.
H0 (Null Hypothesis): Average = 95%.
Alternative Hypothesis (H1): The average is less than 95%.
Another straightforward example to understand this concept is determining whether or not a coin is fair and balanced. The null hypothesis states that the probability of a show of heads is equal to the likelihood of a show of tails. In contrast, the alternate theory states that the probability of a show of heads and tails would be very different.
Become a Data Scientist with Hands-on Training!
Hypothesis Testing Calculation With Examples
Let's consider a hypothesis test for the average height of women in the United States. Suppose our null hypothesis is that the average height is 5'4". We gather a sample of 100 women and determine that their average height is 5'5". The standard deviation of population is 2.
To calculate the z-score, we would use the following formula:
z = ( x̅ – μ0 ) / (σ /√n)
z = (5'5" - 5'4") / (2" / √100)
z = 0.5 / (0.045)
We will reject the null hypothesis as the z-score of 11.11 is very large and conclude that there is evidence to suggest that the average height of women in the US is greater than 5'4".
Steps of Hypothesis Testing
Step 1: specify your null and alternate hypotheses.
It is critical to rephrase your original research hypothesis (the prediction that you wish to study) as a null (Ho) and alternative (Ha) hypothesis so that you can test it quantitatively. Your first hypothesis, which predicts a link between variables, is generally your alternate hypothesis. The null hypothesis predicts no link between the variables of interest.
Step 2: Gather Data
For a statistical test to be legitimate, sampling and data collection must be done in a way that is meant to test your hypothesis. You cannot draw statistical conclusions about the population you are interested in if your data is not representative.
Step 3: Conduct a Statistical Test
Other statistical tests are available, but they all compare within-group variance (how to spread out the data inside a category) against between-group variance (how different the categories are from one another). If the between-group variation is big enough that there is little or no overlap between groups, your statistical test will display a low p-value to represent this. This suggests that the disparities between these groups are unlikely to have occurred by accident. Alternatively, if there is a large within-group variance and a low between-group variance, your statistical test will show a high p-value. Any difference you find across groups is most likely attributable to chance. The variety of variables and the level of measurement of your obtained data will influence your statistical test selection.
Step 4: Determine Rejection Of Your Null Hypothesis
Your statistical test results must determine whether your null hypothesis should be rejected or not. In most circumstances, you will base your judgment on the p-value provided by the statistical test. In most circumstances, your preset level of significance for rejecting the null hypothesis will be 0.05 - that is, when there is less than a 5% likelihood that these data would be seen if the null hypothesis were true. In other circumstances, researchers use a lower level of significance, such as 0.01 (1%). This reduces the possibility of wrongly rejecting the null hypothesis.
Step 5: Present Your Results
The findings of hypothesis testing will be discussed in the results and discussion portions of your research paper, dissertation, or thesis. You should include a concise overview of the data and a summary of the findings of your statistical test in the results section. You can talk about whether your results confirmed your initial hypothesis or not in the conversation. Rejecting or failing to reject the null hypothesis is a formal term used in hypothesis testing. This is likely a must for your statistics assignments.
Types of Hypothesis Testing
To determine whether a discovery or relationship is statistically significant, hypothesis testing uses a z-test. It usually checks to see if two means are the same (the null hypothesis). Only when the population standard deviation is known and the sample size is 30 data points or more, can a z-test be applied.
A statistical test called a t-test is employed to compare the means of two groups. To determine whether two groups differ or if a procedure or treatment affects the population of interest, it is frequently used in hypothesis testing.
Chi-Square
You utilize a Chi-square test for hypothesis testing concerning whether your data is as predicted. To determine if the expected and observed results are well-fitted, the Chi-square test analyzes the differences between categorical variables from a random sample. The test's fundamental premise is that the observed values in your data should be compared to the predicted values that would be present if the null hypothesis were true.
Hypothesis Testing and Confidence Intervals
Both confidence intervals and hypothesis tests are inferential techniques that depend on approximating the sample distribution. Data from a sample is used to estimate a population parameter using confidence intervals. Data from a sample is used in hypothesis testing to examine a given hypothesis. We must have a postulated parameter to conduct hypothesis testing.
Bootstrap distributions and randomization distributions are created using comparable simulation techniques. The observed sample statistic is the focal point of a bootstrap distribution, whereas the null hypothesis value is the focal point of a randomization distribution.
A variety of feasible population parameter estimates are included in confidence ranges. In this lesson, we created just two-tailed confidence intervals. There is a direct connection between these two-tail confidence intervals and these two-tail hypothesis tests. The results of a two-tailed hypothesis test and two-tailed confidence intervals typically provide the same results. In other words, a hypothesis test at the 0.05 level will virtually always fail to reject the null hypothesis if the 95% confidence interval contains the predicted value. A hypothesis test at the 0.05 level will nearly certainly reject the null hypothesis if the 95% confidence interval does not include the hypothesized parameter.
Simple and Composite Hypothesis Testing
Depending on the population distribution, you can classify the statistical hypothesis into two types.
Simple Hypothesis: A simple hypothesis specifies an exact value for the parameter.
Composite Hypothesis: A composite hypothesis specifies a range of values.
A company is claiming that their average sales for this quarter are 1000 units. This is an example of a simple hypothesis.
Suppose the company claims that the sales are in the range of 900 to 1000 units. Then this is a case of a composite hypothesis.
One-Tailed and Two-Tailed Hypothesis Testing
The One-Tailed test, also called a directional test, considers a critical region of data that would result in the null hypothesis being rejected if the test sample falls into it, inevitably meaning the acceptance of the alternate hypothesis.
In a one-tailed test, the critical distribution area is one-sided, meaning the test sample is either greater or lesser than a specific value.
In two tails, the test sample is checked to be greater or less than a range of values in a Two-Tailed test, implying that the critical distribution area is two-sided.
If the sample falls within this range, the alternate hypothesis will be accepted, and the null hypothesis will be rejected.
Become a Data Scientist With Real-World Experience
Right Tailed Hypothesis Testing
If the larger than (>) sign appears in your hypothesis statement, you are using a right-tailed test, also known as an upper test. Or, to put it another way, the disparity is to the right. For instance, you can contrast the battery life before and after a change in production. Your hypothesis statements can be the following if you want to know if the battery life is longer than the original (let's say 90 hours):
- The null hypothesis is (H0 <= 90) or less change.
- A possibility is that battery life has risen (H1) > 90.
The crucial point in this situation is that the alternate hypothesis (H1), not the null hypothesis, decides whether you get a right-tailed test.
Left Tailed Hypothesis Testing
Alternative hypotheses that assert the true value of a parameter is lower than the null hypothesis are tested with a left-tailed test; they are indicated by the asterisk "<".
Suppose H0: mean = 50 and H1: mean not equal to 50
According to the H1, the mean can be greater than or less than 50. This is an example of a Two-tailed test.
In a similar manner, if H0: mean >=50, then H1: mean <50
Here the mean is less than 50. It is called a One-tailed test.
Type 1 and Type 2 Error
A hypothesis test can result in two types of errors.
Type 1 Error: A Type-I error occurs when sample results reject the null hypothesis despite being true.
Type 2 Error: A Type-II error occurs when the null hypothesis is not rejected when it is false, unlike a Type-I error.
Suppose a teacher evaluates the examination paper to decide whether a student passes or fails.
H0: Student has passed
H1: Student has failed
Type I error will be the teacher failing the student [rejects H0] although the student scored the passing marks [H0 was true].
Type II error will be the case where the teacher passes the student [do not reject H0] although the student did not score the passing marks [H1 is true].
Level of Significance
The alpha value is a criterion for determining whether a test statistic is statistically significant. In a statistical test, Alpha represents an acceptable probability of a Type I error. Because alpha is a probability, it can be anywhere between 0 and 1. In practice, the most commonly used alpha values are 0.01, 0.05, and 0.1, which represent a 1%, 5%, and 10% chance of a Type I error, respectively (i.e. rejecting the null hypothesis when it is in fact correct).
Future-Proof Your AI/ML Career: Top Dos and Don'ts
A p-value is a metric that expresses the likelihood that an observed difference could have occurred by chance. As the p-value decreases the statistical significance of the observed difference increases. If the p-value is too low, you reject the null hypothesis.
Here you have taken an example in which you are trying to test whether the new advertising campaign has increased the product's sales. The p-value is the likelihood that the null hypothesis, which states that there is no change in the sales due to the new advertising campaign, is true. If the p-value is .30, then there is a 30% chance that there is no increase or decrease in the product's sales. If the p-value is 0.03, then there is a 3% probability that there is no increase or decrease in the sales value due to the new advertising campaign. As you can see, the lower the p-value, the chances of the alternate hypothesis being true increases, which means that the new advertising campaign causes an increase or decrease in sales.
Why is Hypothesis Testing Important in Research Methodology?
Hypothesis testing is crucial in research methodology for several reasons:
- Provides evidence-based conclusions: It allows researchers to make objective conclusions based on empirical data, providing evidence to support or refute their research hypotheses.
- Supports decision-making: It helps make informed decisions, such as accepting or rejecting a new treatment, implementing policy changes, or adopting new practices.
- Adds rigor and validity: It adds scientific rigor to research using statistical methods to analyze data, ensuring that conclusions are based on sound statistical evidence.
- Contributes to the advancement of knowledge: By testing hypotheses, researchers contribute to the growth of knowledge in their respective fields by confirming existing theories or discovering new patterns and relationships.
Limitations of Hypothesis Testing
Hypothesis testing has some limitations that researchers should be aware of:
- It cannot prove or establish the truth: Hypothesis testing provides evidence to support or reject a hypothesis, but it cannot confirm the absolute truth of the research question.
- Results are sample-specific: Hypothesis testing is based on analyzing a sample from a population, and the conclusions drawn are specific to that particular sample.
- Possible errors: During hypothesis testing, there is a chance of committing type I error (rejecting a true null hypothesis) or type II error (failing to reject a false null hypothesis).
- Assumptions and requirements: Different tests have specific assumptions and requirements that must be met to accurately interpret results.
After reading this tutorial, you would have a much better understanding of hypothesis testing, one of the most important concepts in the field of Data Science . The majority of hypotheses are based on speculation about observed behavior, natural phenomena, or established theories.
If you are interested in statistics of data science and skills needed for such a career, you ought to explore Simplilearn’s Post Graduate Program in Data Science.
If you have any questions regarding this ‘Hypothesis Testing In Statistics’ tutorial, do share them in the comment section. Our subject matter expert will respond to your queries. Happy learning!
1. What is hypothesis testing in statistics with example?
Hypothesis testing is a statistical method used to determine if there is enough evidence in a sample data to draw conclusions about a population. It involves formulating two competing hypotheses, the null hypothesis (H0) and the alternative hypothesis (Ha), and then collecting data to assess the evidence. An example: testing if a new drug improves patient recovery (Ha) compared to the standard treatment (H0) based on collected patient data.
2. What is hypothesis testing and its types?
Hypothesis testing is a statistical method used to make inferences about a population based on sample data. It involves formulating two hypotheses: the null hypothesis (H0), which represents the default assumption, and the alternative hypothesis (Ha), which contradicts H0. The goal is to assess the evidence and determine whether there is enough statistical significance to reject the null hypothesis in favor of the alternative hypothesis.
Types of hypothesis testing:
- One-sample test: Used to compare a sample to a known value or a hypothesized value.
- Two-sample test: Compares two independent samples to assess if there is a significant difference between their means or distributions.
- Paired-sample test: Compares two related samples, such as pre-test and post-test data, to evaluate changes within the same subjects over time or under different conditions.
- Chi-square test: Used to analyze categorical data and determine if there is a significant association between variables.
- ANOVA (Analysis of Variance): Compares means across multiple groups to check if there is a significant difference between them.
3. What are the steps of hypothesis testing?
The steps of hypothesis testing are as follows:
- Formulate the hypotheses: State the null hypothesis (H0) and the alternative hypothesis (Ha) based on the research question.
- Set the significance level: Determine the acceptable level of error (alpha) for making a decision.
- Collect and analyze data: Gather and process the sample data.
- Compute test statistic: Calculate the appropriate statistical test to assess the evidence.
- Make a decision: Compare the test statistic with critical values or p-values and determine whether to reject H0 in favor of Ha or not.
- Draw conclusions: Interpret the results and communicate the findings in the context of the research question.
4. What are the 2 types of hypothesis testing?
- One-tailed (or one-sided) test: Tests for the significance of an effect in only one direction, either positive or negative.
- Two-tailed (or two-sided) test: Tests for the significance of an effect in both directions, allowing for the possibility of a positive or negative effect.
The choice between one-tailed and two-tailed tests depends on the specific research question and the directionality of the expected effect.
5. What are the 3 major types of hypothesis?
The three major types of hypotheses are:
- Null Hypothesis (H0): Represents the default assumption, stating that there is no significant effect or relationship in the data.
- Alternative Hypothesis (Ha): Contradicts the null hypothesis and proposes a specific effect or relationship that researchers want to investigate.
- Nondirectional Hypothesis: An alternative hypothesis that doesn't specify the direction of the effect, leaving it open for both positive and negative possibilities.
Find our Data Analyst Online Bootcamp in top cities:
About the author.
Avijeet is a Senior Research Analyst at Simplilearn. Passionate about Data Analytics, Machine Learning, and Deep Learning, Avijeet is also interested in politics, cricket, and football.
Recommended Resources
Free eBook: Top Programming Languages For A Data Scientist
Normality Test in Minitab: Minitab with Statistics
Machine Learning Career Guide: A Playbook to Becoming a Machine Learning Engineer
- PMP, PMI, PMBOK, CAPM, PgMP, PfMP, ACP, PBA, RMP, SP, and OPM3 are registered marks of the Project Management Institute, Inc.
- Business Essentials
- Leadership & Management
- Credential of Leadership, Impact, and Management in Business (CLIMB)
- Entrepreneurship & Innovation
- Digital Transformation
- Finance & Accounting
- Business in Society
- For Organizations
- Support Portal
- Media Coverage
- Founding Donors
- Leadership Team

- Harvard Business School →
- HBS Online →
- Business Insights →
Business Insights
Harvard Business School Online's Business Insights Blog provides the career insights you need to achieve your goals and gain confidence in your business skills.
- Career Development
- Communication
- Decision-Making
- Earning Your MBA
- Negotiation
- News & Events
- Productivity
- Staff Spotlight
- Student Profiles
- Work-Life Balance
- AI Essentials for Business
- Alternative Investments
- Business Analytics
- Business Strategy
- Business and Climate Change
- Design Thinking and Innovation
- Digital Marketing Strategy
- Disruptive Strategy
- Economics for Managers
- Entrepreneurship Essentials
- Financial Accounting
- Global Business
- Launching Tech Ventures
- Leadership Principles
- Leadership, Ethics, and Corporate Accountability
- Leading Change and Organizational Renewal
- Leading with Finance
- Management Essentials
- Negotiation Mastery
- Organizational Leadership
- Power and Influence for Positive Impact
- Strategy Execution
- Sustainable Business Strategy
- Sustainable Investing
- Winning with Digital Platforms
A Beginner’s Guide to Hypothesis Testing in Business

- 30 Mar 2021
Becoming a more data-driven decision-maker can bring several benefits to your organization, enabling you to identify new opportunities to pursue and threats to abate. Rather than allowing subjective thinking to guide your business strategy, backing your decisions with data can empower your company to become more innovative and, ultimately, profitable.
If you’re new to data-driven decision-making, you might be wondering how data translates into business strategy. The answer lies in generating a hypothesis and verifying or rejecting it based on what various forms of data tell you.
Below is a look at hypothesis testing and the role it plays in helping businesses become more data-driven.
Access your free e-book today.
What Is Hypothesis Testing?
To understand what hypothesis testing is, it’s important first to understand what a hypothesis is.
A hypothesis or hypothesis statement seeks to explain why something has happened, or what might happen, under certain conditions. It can also be used to understand how different variables relate to each other. Hypotheses are often written as if-then statements; for example, “If this happens, then this will happen.”
Hypothesis testing , then, is a statistical means of testing an assumption stated in a hypothesis. While the specific methodology leveraged depends on the nature of the hypothesis and data available, hypothesis testing typically uses sample data to extrapolate insights about a larger population.
Hypothesis Testing in Business
When it comes to data-driven decision-making, there’s a certain amount of risk that can mislead a professional. This could be due to flawed thinking or observations, incomplete or inaccurate data , or the presence of unknown variables. The danger in this is that, if major strategic decisions are made based on flawed insights, it can lead to wasted resources, missed opportunities, and catastrophic outcomes.
The real value of hypothesis testing in business is that it allows professionals to test their theories and assumptions before putting them into action. This essentially allows an organization to verify its analysis is correct before committing resources to implement a broader strategy.
As one example, consider a company that wishes to launch a new marketing campaign to revitalize sales during a slow period. Doing so could be an incredibly expensive endeavor, depending on the campaign’s size and complexity. The company, therefore, may wish to test the campaign on a smaller scale to understand how it will perform.
In this example, the hypothesis that’s being tested would fall along the lines of: “If the company launches a new marketing campaign, then it will translate into an increase in sales.” It may even be possible to quantify how much of a lift in sales the company expects to see from the effort. Pending the results of the pilot campaign, the business would then know whether it makes sense to roll it out more broadly.
Related: 9 Fundamental Data Science Skills for Business Professionals
Key Considerations for Hypothesis Testing
1. alternative hypothesis and null hypothesis.
In hypothesis testing, the hypothesis that’s being tested is known as the alternative hypothesis . Often, it’s expressed as a correlation or statistical relationship between variables. The null hypothesis , on the other hand, is a statement that’s meant to show there’s no statistical relationship between the variables being tested. It’s typically the exact opposite of whatever is stated in the alternative hypothesis.
For example, consider a company’s leadership team that historically and reliably sees $12 million in monthly revenue. They want to understand if reducing the price of their services will attract more customers and, in turn, increase revenue.
In this case, the alternative hypothesis may take the form of a statement such as: “If we reduce the price of our flagship service by five percent, then we’ll see an increase in sales and realize revenues greater than $12 million in the next month.”
The null hypothesis, on the other hand, would indicate that revenues wouldn’t increase from the base of $12 million, or might even decrease.
Check out the video below about the difference between an alternative and a null hypothesis, and subscribe to our YouTube channel for more explainer content.
2. Significance Level and P-Value
Statistically speaking, if you were to run the same scenario 100 times, you’d likely receive somewhat different results each time. If you were to plot these results in a distribution plot, you’d see the most likely outcome is at the tallest point in the graph, with less likely outcomes falling to the right and left of that point.

With this in mind, imagine you’ve completed your hypothesis test and have your results, which indicate there may be a correlation between the variables you were testing. To understand your results' significance, you’ll need to identify a p-value for the test, which helps note how confident you are in the test results.
In statistics, the p-value depicts the probability that, assuming the null hypothesis is correct, you might still observe results that are at least as extreme as the results of your hypothesis test. The smaller the p-value, the more likely the alternative hypothesis is correct, and the greater the significance of your results.
3. One-Sided vs. Two-Sided Testing
When it’s time to test your hypothesis, it’s important to leverage the correct testing method. The two most common hypothesis testing methods are one-sided and two-sided tests , or one-tailed and two-tailed tests, respectively.
Typically, you’d leverage a one-sided test when you have a strong conviction about the direction of change you expect to see due to your hypothesis test. You’d leverage a two-sided test when you’re less confident in the direction of change.

4. Sampling
To perform hypothesis testing in the first place, you need to collect a sample of data to be analyzed. Depending on the question you’re seeking to answer or investigate, you might collect samples through surveys, observational studies, or experiments.
A survey involves asking a series of questions to a random population sample and recording self-reported responses.
Observational studies involve a researcher observing a sample population and collecting data as it occurs naturally, without intervention.
Finally, an experiment involves dividing a sample into multiple groups, one of which acts as the control group. For each non-control group, the variable being studied is manipulated to determine how the data collected differs from that of the control group.

Learn How to Perform Hypothesis Testing
Hypothesis testing is a complex process involving different moving pieces that can allow an organization to effectively leverage its data and inform strategic decisions.
If you’re interested in better understanding hypothesis testing and the role it can play within your organization, one option is to complete a course that focuses on the process. Doing so can lay the statistical and analytical foundation you need to succeed.
Do you want to learn more about hypothesis testing? Explore Business Analytics —one of our online business essentials courses —and download our Beginner’s Guide to Data & Analytics .

About the Author
- School Guide
- Mathematics
- Number System and Arithmetic
- Trigonometry
- Probability
- Mensuration
- Maths Formulas
- Class 8 Maths Notes
- Class 9 Maths Notes
- Class 10 Maths Notes
- Class 11 Maths Notes
- Class 12 Maths Notes
- Data Analysis with Python
Introduction to Data Analysis
- What is Data Analysis?
- Data Analytics and its type
- How to Install Numpy on Windows?
- How to Install Pandas in Python?
- How to Install Matplotlib on python?
- How to Install Python Tensorflow in Windows?
Data Analysis Libraries
- Pandas Tutorial
- NumPy Tutorial - Python Library
- Data Analysis with SciPy
- Introduction to TensorFlow
Data Visulization Libraries
- Matplotlib Tutorial
- Python Seaborn Tutorial
- Plotly tutorial
- Introduction to Bokeh in Python
Exploratory Data Analysis (EDA)
- Univariate, Bivariate and Multivariate data and its analysis
- Measures of Central Tendency in Statistics
- Measures of spread - Range, Variance, and Standard Deviation
- Interquartile Range and Quartile Deviation using NumPy and SciPy
- Anova Formula
- Skewness of Statistical Data
- How to Calculate Skewness and Kurtosis in Python?
- Difference Between Skewness and Kurtosis
- Histogram | Meaning, Example, Types and Steps to Draw
- Interpretations of Histogram
- Quantile Quantile plots
- What is Univariate, Bivariate & Multivariate Analysis in Data Visualisation?
- Using pandas crosstab to create a bar plot
- Exploring Correlation in Python
- Mathematics | Covariance and Correlation
- Factor Analysis | Data Analysis
- Data Mining - Cluster Analysis
- MANOVA Test in R Programming
- Python - Central Limit Theorem
- Probability Distribution Function
- Probability Density Estimation & Maximum Likelihood Estimation
- Exponential Distribution in R Programming - dexp(), pexp(), qexp(), and rexp() Functions
- Mathematics | Probability Distributions Set 4 (Binomial Distribution)
- Poisson Distribution | Definition, Formula, Table and Examples
- P-Value: Comprehensive Guide to Understand, Apply, and Interpret
- Z-Score in Statistics
- How to Calculate Point Estimates in R?
- Confidence Interval
- Chi-square test in Machine Learning
Understanding Hypothesis Testing
Data preprocessing.
- ML | Data Preprocessing in Python
- ML | Overview of Data Cleaning
- ML | Handling Missing Values
- Detect and Remove the Outliers using Python
Data Transformation
- Data Normalization Machine Learning
- Sampling distribution Using Python
Time Series Data Analysis
- Data Mining - Time-Series, Symbolic and Biological Sequences Data
- Basic DateTime Operations in Python
- Time Series Analysis & Visualization in Python
- How to deal with missing values in a Timeseries in Python?
- How to calculate MOVING AVERAGE in a Pandas DataFrame?
- What is a trend in time series?
- How to Perform an Augmented Dickey-Fuller Test in R
- AutoCorrelation
Case Studies and Projects
- Top 8 Free Dataset Sources to Use for Data Science Projects
- Step by Step Predictive Analysis - Machine Learning
- 6 Tips for Creating Effective Data Visualizations
Hypothesis testing involves formulating assumptions about population parameters based on sample statistics and rigorously evaluating these assumptions against empirical evidence. This article sheds light on the significance of hypothesis testing and the critical steps involved in the process.
What is Hypothesis Testing?
Hypothesis testing is a statistical method that is used to make a statistical decision using experimental data. Hypothesis testing is basically an assumption that we make about a population parameter. It evaluates two mutually exclusive statements about a population to determine which statement is best supported by the sample data.
Example: You say an average height in the class is 30 or a boy is taller than a girl. All of these is an assumption that we are assuming, and we need some statistical way to prove these. We need some mathematical conclusion whatever we are assuming is true.
Defining Hypotheses

Key Terms of Hypothesis Testing

- P-value: The P value , or calculated probability, is the probability of finding the observed/extreme results when the null hypothesis(H0) of a study-given problem is true. If your P-value is less than the chosen significance level then you reject the null hypothesis i.e. accept that your sample claims to support the alternative hypothesis.
- Test Statistic: The test statistic is a numerical value calculated from sample data during a hypothesis test, used to determine whether to reject the null hypothesis. It is compared to a critical value or p-value to make decisions about the statistical significance of the observed results.
- Critical value : The critical value in statistics is a threshold or cutoff point used to determine whether to reject the null hypothesis in a hypothesis test.
- Degrees of freedom: Degrees of freedom are associated with the variability or freedom one has in estimating a parameter. The degrees of freedom are related to the sample size and determine the shape.
Why do we use Hypothesis Testing?
Hypothesis testing is an important procedure in statistics. Hypothesis testing evaluates two mutually exclusive population statements to determine which statement is most supported by sample data. When we say that the findings are statistically significant, thanks to hypothesis testing.
One-Tailed and Two-Tailed Test
One tailed test focuses on one direction, either greater than or less than a specified value. We use a one-tailed test when there is a clear directional expectation based on prior knowledge or theory. The critical region is located on only one side of the distribution curve. If the sample falls into this critical region, the null hypothesis is rejected in favor of the alternative hypothesis.
One-Tailed Test
There are two types of one-tailed test:

Two-Tailed Test
A two-tailed test considers both directions, greater than and less than a specified value.We use a two-tailed test when there is no specific directional expectation, and want to detect any significant difference.

What are Type 1 and Type 2 errors in Hypothesis Testing?
In hypothesis testing, Type I and Type II errors are two possible errors that researchers can make when drawing conclusions about a population based on a sample of data. These errors are associated with the decisions made regarding the null hypothesis and the alternative hypothesis.

How does Hypothesis Testing work?
Step 1: define null and alternative hypothesis.

We first identify the problem about which we want to make an assumption keeping in mind that our assumption should be contradictory to one another, assuming Normally distributed data.
Step 2 – Choose significance level

Step 3 – Collect and Analyze data.
Gather relevant data through observation or experimentation. Analyze the data using appropriate statistical methods to obtain a test statistic.
Step 4-Calculate Test Statistic
The data for the tests are evaluated in this step we look for various scores based on the characteristics of data. The choice of the test statistic depends on the type of hypothesis test being conducted.
There are various hypothesis tests, each appropriate for various goal to calculate our test. This could be a Z-test , Chi-square , T-test , and so on.
- Z-test : If population means and standard deviations are known. Z-statistic is commonly used.
- t-test : If population standard deviations are unknown. and sample size is small than t-test statistic is more appropriate.
- Chi-square test : Chi-square test is used for categorical data or for testing independence in contingency tables
- F-test : F-test is often used in analysis of variance (ANOVA) to compare variances or test the equality of means across multiple groups.
We have a smaller dataset, So, T-test is more appropriate to test our hypothesis.
T-statistic is a measure of the difference between the means of two groups relative to the variability within each group. It is calculated as the difference between the sample means divided by the standard error of the difference. It is also known as the t-value or t-score.
Step 5 – Comparing Test Statistic:
In this stage, we decide where we should accept the null hypothesis or reject the null hypothesis. There are two ways to decide where we should accept or reject the null hypothesis.
Method A: Using Crtical values
Comparing the test statistic and tabulated critical value we have,
- If Test Statistic>Critical Value: Reject the null hypothesis.
- If Test Statistic≤Critical Value: Fail to reject the null hypothesis.
Note: Critical values are predetermined threshold values that are used to make a decision in hypothesis testing. To determine critical values for hypothesis testing, we typically refer to a statistical distribution table , such as the normal distribution or t-distribution tables based on.
Method B: Using P-values
We can also come to an conclusion using the p-value,

Note : The p-value is the probability of obtaining a test statistic as extreme as, or more extreme than, the one observed in the sample, assuming the null hypothesis is true. To determine p-value for hypothesis testing, we typically refer to a statistical distribution table , such as the normal distribution or t-distribution tables based on.
Step 7- Interpret the Results
At last, we can conclude our experiment using method A or B.
Calculating test statistic
To validate our hypothesis about a population parameter we use statistical functions . We use the z-score, p-value, and level of significance(alpha) to make evidence for our hypothesis for normally distributed data .
1. Z-statistics:
When population means and standard deviations are known.

- μ represents the population mean,
- σ is the standard deviation
- and n is the size of the sample.
2. T-Statistics
T test is used when n<30,
t-statistic calculation is given by:

- t = t-score,
- x̄ = sample mean
- μ = population mean,
- s = standard deviation of the sample,
- n = sample size
3. Chi-Square Test
Chi-Square Test for Independence categorical Data (Non-normally distributed) using:

- i,j are the rows and columns index respectively.

Real life Hypothesis Testing example
Let’s examine hypothesis testing using two real life situations,
Case A: D oes a New Drug Affect Blood Pressure?
Imagine a pharmaceutical company has developed a new drug that they believe can effectively lower blood pressure in patients with hypertension. Before bringing the drug to market, they need to conduct a study to assess its impact on blood pressure.
- Before Treatment: 120, 122, 118, 130, 125, 128, 115, 121, 123, 119
- After Treatment: 115, 120, 112, 128, 122, 125, 110, 117, 119, 114
Step 1 : Define the Hypothesis
- Null Hypothesis : (H 0 )The new drug has no effect on blood pressure.
- Alternate Hypothesis : (H 1 )The new drug has an effect on blood pressure.
Step 2: Define the Significance level
Let’s consider the Significance level at 0.05, indicating rejection of the null hypothesis.
If the evidence suggests less than a 5% chance of observing the results due to random variation.
Step 3 : Compute the test statistic
Using paired T-test analyze the data to obtain a test statistic and a p-value.
The test statistic (e.g., T-statistic) is calculated based on the differences between blood pressure measurements before and after treatment.
t = m/(s/√n)
- m = mean of the difference i.e X after, X before
- s = standard deviation of the difference (d) i.e d i = X after, i − X before,
- n = sample size,
then, m= -3.9, s= 1.8 and n= 10
we, calculate the , T-statistic = -9 based on the formula for paired t test
Step 4: Find the p-value
The calculated t-statistic is -9 and degrees of freedom df = 9, you can find the p-value using statistical software or a t-distribution table.
thus, p-value = 8.538051223166285e-06
Step 5: Result
- If the p-value is less than or equal to 0.05, the researchers reject the null hypothesis.
- If the p-value is greater than 0.05, they fail to reject the null hypothesis.
Conclusion: Since the p-value (8.538051223166285e-06) is less than the significance level (0.05), the researchers reject the null hypothesis. There is statistically significant evidence that the average blood pressure before and after treatment with the new drug is different.
Python Implementation of Hypothesis Testing
Let’s create hypothesis testing with python, where we are testing whether a new drug affects blood pressure. For this example, we will use a paired T-test. We’ll use the scipy.stats library for the T-test.
Scipy is a mathematical library in Python that is mostly used for mathematical equations and computations.
We will implement our first real life problem via python,
In the above example, given the T-statistic of approximately -9 and an extremely small p-value, the results indicate a strong case to reject the null hypothesis at a significance level of 0.05.
- The results suggest that the new drug, treatment, or intervention has a significant effect on lowering blood pressure.
- The negative T-statistic indicates that the mean blood pressure after treatment is significantly lower than the assumed population mean before treatment.
Case B : Cholesterol level in a population
Data: A sample of 25 individuals is taken, and their cholesterol levels are measured.
Cholesterol Levels (mg/dL): 205, 198, 210, 190, 215, 205, 200, 192, 198, 205, 198, 202, 208, 200, 205, 198, 205, 210, 192, 205, 198, 205, 210, 192, 205.
Populations Mean = 200
Population Standard Deviation (σ): 5 mg/dL(given for this problem)
Step 1: Define the Hypothesis
- Null Hypothesis (H 0 ): The average cholesterol level in a population is 200 mg/dL.
- Alternate Hypothesis (H 1 ): The average cholesterol level in a population is different from 200 mg/dL.
As the direction of deviation is not given , we assume a two-tailed test, and based on a normal distribution table, the critical values for a significance level of 0.05 (two-tailed) can be calculated through the z-table and are approximately -1.96 and 1.96.

Step 4: Result
Since the absolute value of the test statistic (2.04) is greater than the critical value (1.96), we reject the null hypothesis. And conclude that, there is statistically significant evidence that the average cholesterol level in the population is different from 200 mg/dL
Limitations of Hypothesis Testing
- Although a useful technique, hypothesis testing does not offer a comprehensive grasp of the topic being studied. Without fully reflecting the intricacy or whole context of the phenomena, it concentrates on certain hypotheses and statistical significance.
- The accuracy of hypothesis testing results is contingent on the quality of available data and the appropriateness of statistical methods used. Inaccurate data or poorly formulated hypotheses can lead to incorrect conclusions.
- Relying solely on hypothesis testing may cause analysts to overlook significant patterns or relationships in the data that are not captured by the specific hypotheses being tested. This limitation underscores the importance of complimenting hypothesis testing with other analytical approaches.
Hypothesis testing stands as a cornerstone in statistical analysis, enabling data scientists to navigate uncertainties and draw credible inferences from sample data. By systematically defining null and alternative hypotheses, choosing significance levels, and leveraging statistical tests, researchers can assess the validity of their assumptions. The article also elucidates the critical distinction between Type I and Type II errors, providing a comprehensive understanding of the nuanced decision-making process inherent in hypothesis testing. The real-life example of testing a new drug’s effect on blood pressure using a paired T-test showcases the practical application of these principles, underscoring the importance of statistical rigor in data-driven decision-making.
Frequently Asked Questions (FAQs)
1. what are the 3 types of hypothesis test.
There are three types of hypothesis tests: right-tailed, left-tailed, and two-tailed. Right-tailed tests assess if a parameter is greater, left-tailed if lesser. Two-tailed tests check for non-directional differences, greater or lesser.
2.What are the 4 components of hypothesis testing?
Null Hypothesis ( ): No effect or difference exists. Alternative Hypothesis ( ): An effect or difference exists. Significance Level ( ): Risk of rejecting null hypothesis when it’s true (Type I error). Test Statistic: Numerical value representing observed evidence against null hypothesis.
3.What is hypothesis testing in ML?
Statistical method to evaluate the performance and validity of machine learning models. Tests specific hypotheses about model behavior, like whether features influence predictions or if a model generalizes well to unseen data.
4.What is the difference between Pytest and hypothesis in Python?
Pytest purposes general testing framework for Python code while Hypothesis is a Property-based testing framework for Python, focusing on generating test cases based on specified properties of the code.
Please Login to comment...
Similar reads.
- data-science
- Data Science
- Machine Learning
Improve your Coding Skills with Practice
What kind of Experience do you want to share?

Statistics Made Easy
5 Tips for Interpreting P-Values Correctly in Hypothesis Testing

Hypothesis testing is a critical part of statistical analysis and is often the endpoint where conclusions are drawn about larger populations based on a sample or experimental dataset. Central to this process is the p-value. Broadly, the p-value quantifies the strength of evidence against the null hypothesis. Given the importance of the p-value, it is essential to ensure its interpretation is correct. Here are five essential tips for ensuring the p-value from a hypothesis test is understood correctly.
1. Know What the P-value Represents
First, it is essential to understand what a p-value is. In hypothesis testing, the p-value is defined as the probability of observing your data, or data more extreme, if the null hypothesis is true. As a reminder, the null hypothesis states no difference between your data and the expected population.
For example, in a hypothesis test to see if changing a company’s logo drives more traffic to the website, a null hypothesis would state that the new traffic numbers are equal to the old traffic numbers. In this context, the p-value would be the probability that the data you observed, or data more extreme, would occur if this null hypothesis were true.
Therefore, a smaller p-value indicates that what you observed is unlikely to have occurred if the null were true, offering evidence to reject the null hypothesis. Typically, a cut-off value of 0.05 is used where any p-value below this is considered significant evidence against the null.
2. Understand the Directionality of Your Hypothesis
Based on the research question under exploration, there are two types of hypotheses: one-sided and two-sided. A one-sided test specifies a particular direction of effect, such as traffic to a website increasing after a design change. On the other hand, a two-sided test allows the change to be in either direction and is effective when the researcher wants to see any effect of the change.
Either way, determining the statistical significance of a p-value is the same: if the p-value is below a threshold value, it is statistically significant. However, when calculating the p-value, it is important to ensure the correct sided calculations have been completed.
Additionally, the interpretation of the meaning of a p-value will differ based on the directionality of the hypothesis. If a one-sided test is significant, the researchers can use the p-value to support a statistically significant increase or decrease based on the direction of the test. If a two-sided test is significant, the p-value can only be used to say that the two groups are different, but not that one is necessarily greater.
3. Avoid Threshold Thinking
A common pitfall in interpreting p-values is falling into the threshold thinking trap. The most commonly used cut-off value for whether a calculated p-value is statistically significant is 0.05. Typically, a p-value of less than 0.05 is considered statistically significant evidence against the null hypothesis.
However, this is just an arbitrary value. Rigid adherence to this or any other predefined cut-off value can obscure business-relevant effect sizes. For example, a hypothesis test looking at changes in traffic after a website design may find that an increase of 10,000 views is not statistically significant with a p-value of 0.055 since that value is above 0.05. However, the actual increase of 10,000 may be important to the growth of the business.
Therefore, a p-value can be practically significant while not being statistically significant. Both types of significance and the broader context of the hypothesis test should be considered when making a final interpretation.
4. Consider the Power of Your Study
Similarly, some study conditions can result in a non-significant p-value even if practical significance exists. Statistical power is the ability of a study to detect an effect when it truly exists. In other words, it is the probability that the null hypothesis will be rejected when it is false.
Power is impacted by a lot of factors. These include sample size, the effect size you are looking for, and variability within the data. In the example of website traffic after a design change, if the number of visits overall is too small, there may not be enough views to have enough power to detect a difference.
Simple ways to increase the power of a hypothesis test and increase the chances of detecting an effect are increasing the sample size, looking for a smaller effect size, changing the experiment design to control for variables that can increase variability, or adjusting the type of statistical test being run.
5. Be Aware of Multiple Comparisons
Whenever multiple p-values are calculated in a single study due to multiple comparisons, there is an increased risk of false positives. This is because each individual comparison introduces random fluctuations, and each additional comparison compounds these fluctuations.
For example, in a hypothesis test looking at traffic before and after a website redesign, the team may be interested in making more than one comparison. This can include total visits, page views, and average time spent on the website. Since multiple comparisons are being made, there must be a correction made when interpreting the p-value.
The Bonferroni correction is one of the most commonly used methods to account for this increased probability of false positives. In this method, the significance cut-off value, typically 0.05, is divided by the number of comparisons made. The result is used as the new significance cut-off value. Applying this correction mitigates the risk of false positives and improves the reliability of findings from a hypothesis test.
In conclusion, interpreting p-values requires a nuanced understanding of many statistical concepts and careful consideration of the hypothesis test’s context. By following these five tips, the interpretation of the p-value from a hypothesis test can be more accurate and reliable, leading to better data-driven decision-making.
Featured Posts

Leave a Reply Cancel reply
Your email address will not be published. Required fields are marked *
Join the Statology Community
Sign up to receive Statology's exclusive study resource: 100 practice problems with step-by-step solutions. Plus, get our latest insights, tutorials, and data analysis tips straight to your inbox!
By subscribing you accept Statology's Privacy Policy.

User Preferences
Content preview.
Arcu felis bibendum ut tristique et egestas quis:
- Ut enim ad minim veniam, quis nostrud exercitation ullamco laboris
- Duis aute irure dolor in reprehenderit in voluptate
- Excepteur sint occaecat cupidatat non proident
Keyboard Shortcuts
S.3.1 hypothesis testing (critical value approach).
The critical value approach involves determining "likely" or "unlikely" by determining whether or not the observed test statistic is more extreme than would be expected if the null hypothesis were true. That is, it entails comparing the observed test statistic to some cutoff value, called the " critical value ." If the test statistic is more extreme than the critical value, then the null hypothesis is rejected in favor of the alternative hypothesis. If the test statistic is not as extreme as the critical value, then the null hypothesis is not rejected.
Specifically, the four steps involved in using the critical value approach to conducting any hypothesis test are:
- Specify the null and alternative hypotheses.
- Using the sample data and assuming the null hypothesis is true, calculate the value of the test statistic. To conduct the hypothesis test for the population mean μ , we use the t -statistic \(t^*=\frac{\bar{x}-\mu}{s/\sqrt{n}}\) which follows a t -distribution with n - 1 degrees of freedom.
- Determine the critical value by finding the value of the known distribution of the test statistic such that the probability of making a Type I error — which is denoted \(\alpha\) (greek letter "alpha") and is called the " significance level of the test " — is small (typically 0.01, 0.05, or 0.10).
- Compare the test statistic to the critical value. If the test statistic is more extreme in the direction of the alternative than the critical value, reject the null hypothesis in favor of the alternative hypothesis. If the test statistic is less extreme than the critical value, do not reject the null hypothesis.
Example S.3.1.1
Mean gpa section .
In our example concerning the mean grade point average, suppose we take a random sample of n = 15 students majoring in mathematics. Since n = 15, our test statistic t * has n - 1 = 14 degrees of freedom. Also, suppose we set our significance level α at 0.05 so that we have only a 5% chance of making a Type I error.
Right-Tailed
The critical value for conducting the right-tailed test H 0 : μ = 3 versus H A : μ > 3 is the t -value, denoted t \(\alpha\) , n - 1 , such that the probability to the right of it is \(\alpha\). It can be shown using either statistical software or a t -table that the critical value t 0.05,14 is 1.7613. That is, we would reject the null hypothesis H 0 : μ = 3 in favor of the alternative hypothesis H A : μ > 3 if the test statistic t * is greater than 1.7613. Visually, the rejection region is shaded red in the graph.

Left-Tailed
The critical value for conducting the left-tailed test H 0 : μ = 3 versus H A : μ < 3 is the t -value, denoted -t ( \(\alpha\) , n - 1) , such that the probability to the left of it is \(\alpha\). It can be shown using either statistical software or a t -table that the critical value -t 0.05,14 is -1.7613. That is, we would reject the null hypothesis H 0 : μ = 3 in favor of the alternative hypothesis H A : μ < 3 if the test statistic t * is less than -1.7613. Visually, the rejection region is shaded red in the graph.

There are two critical values for the two-tailed test H 0 : μ = 3 versus H A : μ ≠ 3 — one for the left-tail denoted -t ( \(\alpha\) / 2, n - 1) and one for the right-tail denoted t ( \(\alpha\) / 2, n - 1) . The value - t ( \(\alpha\) /2, n - 1) is the t -value such that the probability to the left of it is \(\alpha\)/2, and the value t ( \(\alpha\) /2, n - 1) is the t -value such that the probability to the right of it is \(\alpha\)/2. It can be shown using either statistical software or a t -table that the critical value -t 0.025,14 is -2.1448 and the critical value t 0.025,14 is 2.1448. That is, we would reject the null hypothesis H 0 : μ = 3 in favor of the alternative hypothesis H A : μ ≠ 3 if the test statistic t * is less than -2.1448 or greater than 2.1448. Visually, the rejection region is shaded red in the graph.

IMAGES
VIDEO
COMMENTS
Table of contents. Step 1: State your null and alternate hypothesis. Step 2: Collect data. Step 3: Perform a statistical test. Step 4: Decide whether to reject or fail to reject your null hypothesis. Step 5: Present your findings. Other interesting articles. Frequently asked questions about hypothesis testing.
Below these are summarized into six such steps to conducting a test of a hypothesis. Set up the hypotheses and check conditions: Each hypothesis test includes two hypotheses about the population. One is the null hypothesis, notated as H 0, which is a statement of a particular parameter value. This hypothesis is assumed to be true until there is ...
5.2 - Writing Hypotheses. The first step in conducting a hypothesis test is to write the hypothesis statements that are going to be tested. For each test you will have a null hypothesis (\ (H_0\)) and an alternative hypothesis (\ (H_a\)). Null Hypothesis. The statement that there is not a difference in the population (s), denoted as \ (H_0\)
The hypothesis test is just one part of a research process. There are other pieces that you need to consider. That's it. That is what a hypothesis test looks like. All hypothesis tests are done with the same six steps. Those general six steps are outlined below. State the random variable and the parameter in words.
Hypothesis testing is a crucial procedure to perform when you want to make inferences about a population using a random sample. These inferences include estimating population properties such as the mean, differences between means, proportions, and the relationships between variables. This post provides an overview of statistical hypothesis testing.
A hypothesis test consists of five steps: 1. State the hypotheses. State the null and alternative hypotheses. These two hypotheses need to be mutually exclusive, so if one is true then the other must be false. 2. Determine a significance level to use for the hypothesis. Decide on a significance level.
In hypothesis testing, the goal is to see if there is sufficient statistical evidence to reject a presumed null hypothesis in favor of a conjectured alternative hypothesis.The null hypothesis is usually denoted \(H_0\) while the alternative hypothesis is usually denoted \(H_1\). An hypothesis test is a statistical decision; the conclusion will either be to reject the null hypothesis in favor ...
S.3 Hypothesis Testing. In reviewing hypothesis tests, we start first with the general idea. Then, we keep returning to the basic procedures of hypothesis testing, each time adding a little more detail. The general idea of hypothesis testing involves: Making an initial assumption. Collecting evidence (data).
Developing a hypothesis (with example) Step 1. Ask a question. Writing a hypothesis begins with a research question that you want to answer. The question should be focused, specific, and researchable within the constraints of your project. Example: Research question.
Hypothesis testing is a method of statistical inference that considers the null hypothesis H ₀ vs. the alternative hypothesis H a, where we are typically looking to assess evidence against H ₀. Such a test is used to compare data sets against one another, or compare a data set against some external standard. The former being a two sample ...
Using P values and Significance Levels Together. If your P value is less than or equal to your alpha level, reject the null hypothesis. The P value results are consistent with our graphical representation. The P value of 0.03112 is significant at the alpha level of 0.05 but not 0.01.
ANOVA and MANOVA tests are used when comparing the means of more than two groups (e.g., the average heights of children, teenagers, and adults). Predictor variable. Outcome variable. Research question example. Paired t-test. Categorical. 1 predictor. Quantitative. groups come from the same population.
Confused about null and alternative hypotheses? Don't worry, this video breaks it down for you!Learn the foundation of hypothesis testing with clear explana...
Step 7: Based on steps 5 and 6, draw a conclusion about H0. If the F\calculated F \calculated from the data is larger than the Fα F α, then you are in the rejection region and you can reject the null hypothesis with (1 − α) ( 1 − α) level of confidence. Note that modern statistical software condenses steps 6 and 7 by providing a p p -value.
Step 5: Phrase your hypothesis in three ways. To identify the variables, you can write a simple prediction in if … then form. The first part of the sentence states the independent variable and the second part states the dependent variable. If a first-year student starts attending more lectures, then their exam scores will improve.
Step 2: State the Alternate Hypothesis. The claim is that the students have above average IQ scores, so: H 1: μ > 100. The fact that we are looking for scores "greater than" a certain point means that this is a one-tailed test. Step 3: Draw a picture to help you visualize the problem. Step 4: State the alpha level.
Using the p-value to make the decision. The p-value represents how likely we would be to observe such an extreme sample if the null hypothesis were true. The p-value is a probability computed assuming the null hypothesis is true, that the test statistic would take a value as extreme or more extreme than that actually observed. Since it's a probability, it is a number between 0 and 1.
Hypothesis testing is a statistical method used to make inferences about a population based on sample data. It involves formulating two hypotheses: the null hypothesis (H0), which represents the default assumption, and the alternative hypothesis (Ha), which contradicts H0.
In statistics, a hypothesis test is used to test some assumption about a population parameter. There are many different types of hypothesis tests you can perform depending on the type of data you're working with and the goal of your analysis. This tutorial explains how to perform the following types of hypothesis tests in Excel: One sample t ...
3. One-Sided vs. Two-Sided Testing. When it's time to test your hypothesis, it's important to leverage the correct testing method. The two most common hypothesis testing methods are one-sided and two-sided tests, or one-tailed and two-tailed tests, respectively. Typically, you'd leverage a one-sided test when you have a strong conviction ...
Hypothesis testing is a statistical method that is used to make a statistical decision using experimental data. Hypothesis testing is basically an assumption that we make about a population parameter. It evaluates two mutually exclusive statements about a population to determine which statement is best supported by the sample data.
Here are five essential tips for ensuring the p-value from a hypothesis test is understood correctly. 1. Know What the P-value Represents. First, it is essential to understand what a p-value is. In hypothesis testing, the p-value is defined as the probability of observing your data, or data more extreme, if the null hypothesis is true.
The P -value is, therefore, the area under a tn - 1 = t14 curve to the left of -2.5 and to the right of 2.5. It can be shown using statistical software that the P -value is 0.0127 + 0.0127, or 0.0254. The graph depicts this visually. Note that the P -value for a two-tailed test is always two times the P -value for either of the one-tailed tests.
3 Collect Quality Data. High-quality data is the backbone of reliable hypothesis testing. Ensure you have a robust data collection process that minimizes bias and errors. The data should be ...
We test this hypothesis for the first time with high-resolution tracking data from four sympatric, frugivorous rainforest mammal species (42 individuals) and drone-based maps of their predominant feeding trees. We found no evidence that larger-brained primates had more efficient foraging paths than smaller brained procyonids. This refutes a key ...
The critical value for conducting the right-tailed test H0 : μ = 3 versus HA : μ > 3 is the t -value, denoted t\ (\alpha\), n - 1, such that the probability to the right of it is \ (\alpha\). It can be shown using either statistical software or a t -table that the critical value t 0.05,14 is 1.7613. That is, we would reject the null ...