How to Create a Research Poster
- Poster Basics
- Design Tips
- Logos & Images

What is a Research Poster?
Posters are widely used in the academic community, and most conferences include poster presentations in their program. Research posters summarize information or research concisely and attractively to help publicize it and generate discussion.
The poster is usually a mixture of a brief text mixed with tables, graphs, pictures, and other presentation formats. At a conference, the researcher stands by the poster display while other participants can come and view the presentation and interact with the author.
What Makes a Good Poster?
- Important information should be readable from about 10 feet away
- Title is short and draws interest
- Word count of about 300 to 800 words
- Text is clear and to the point
- Use of bullets, numbering, and headlines make it easy to read
- Effective use of graphics, color and fonts
- Consistent and clean layout
- Includes acknowledgments, your name and institutional affiliation
A Sample of a Well Designed Poster
View this poster example in a web browser .

Image credit: Poster Session Tips by [email protected], via Penn State
Where do I begin?
Answer these three questions:.
- What is the most important/interesting/astounding finding from my research project?
- How can I visually share my research with conference attendees? Should I use charts, graphs, photos, images?
- What kind of information can I convey during my talk that will complement my poster?
What software can I use to make a poster?
A popular, easy-to-use option. It is part of Microsoft Office package and is available on the library computers in rooms LC337 and LC336. ( Advice for creating a poster with PowerPoint ).
Adobe Illustrator, Photoshop, and InDesign
Feature-rich professional software that is good for posters including lots of high-resolution images, but they are more complex and expensive. NYU Faculty, Staff, and Students can access and download the Adobe Creative Suite .
Open Source Alternatives
- OpenOffice is the free alternative to MS Office (Impress is its PowerPoint alternative).
- Inkscape and Gimp are alternatives to Adobe products.
- For charts and diagrams try Gliffy or Lovely Charts .
- A complete list of free graphics software .
A Sample of a Poorly Designed Poster
View this bad poster example in a browser.

Image Credit: Critique by Better Posters
- Next: Design Tips >>
- Last Updated: Jul 11, 2023 5:09 PM
- URL: https://guides.nyu.edu/posters
Stop spending hours resizing and aligning boxes on your poster.
Design beautiful research posters in minutes with biorender's poster builder. experience quick and easy poster-making with this powerful tool, built by scientists for scientists..
The easiest poster building experience you’ve ever tried.
- Create a poster from scratch in minutes with drag and drop components.
- Everything magically resizes to fit the poster size and maintain consistent margins. Change your poster from landscape to portrait with one click.
- Easily pan and zoom around the canvas to ensure every detail is perfect.
- Add BioRender figures with just a few clicks. All of your files live in one place.
Save time by starting with a professionally designed, fully customizable template.
- Templates are available in landscape, portrait, and square orientation.
- Choose from a wide range of color themes or customize the poster to match institutional branding.
- Default font sizes and margins, optimized for printed posters.
- High quality export available in PDF, PNG, and JPG file formats for all your print and presentation needs.
Using Poster Builder is a really, really nice experience— it only took me a day to put together a poster . The same poster would probably take me a week to do in PowerPoint.

Never email posters back and forth again.
- Quickly give and receive contextual feedback with comments.
- Never email posters back and forth again. Share and collaborate on posters with your colleagues in real-time, no matter where you’re located.
- Easily retrieve previous versions for a worry-free editing experience.
Use BioRender for...
Ready to get started.
{{hero-title}}
{{hero-text}}
Browse by Category

{{short-title}}
Template Stats
(Yes/No) Dependent on Tool Bar.
(Yes/No) Only used for templates/ pages
(Yes/No) Only used for templates/ pages. Dependent on a search marquee to exist on the page. WIP
Orientation
(Horizontal/Vertical)
( Full/Std )
(number of templates to load each pagination. Min. 5)
Load more Templates
( Yes/No )- only for vertical
Most Viewed
Rare & Original
Newest to Oldest
Oldest to Newest
(true, false, all) true or false will limit to premium only or free only.
(true, false, all) true or false will limit to animated only or static only.
Blank Template
This row should only exist if a blank template is needed at the beginning of the templates

{{top-templates-title}}
{{long-text-heading}}.
{{long-text-content}}
Reference management. Clean and simple.
The key parts of a scientific poster

Why make a scientific poster?
Type of poster formats, sections of a scientific poster, before you start: tips for making a scientific poster, the 6 technical elements of a scientific poster, 3. typography, 5. images and illustrations, how to seek feedback on your poster, how to present your poster, tips for the day of your poster presentation, in conclusion, other sources to help you with your scientific poster presentation, frequently asked questions about scientific posters, related articles.
A poster presentation provides the opportunity to show off your research to a broad audience and connect with other researchers in your field.
For junior researchers, presenting a poster is often the first type of scientific presentation they give in their careers.
The discussions you have with other researchers during your poster presentation may inspire new research ideas, or even lead to new collaborations.
Consequently, a poster presentation can be just as professionally enriching as giving an oral presentation , if you prepare for it properly.
In this guide post, you will learn:
- The goal of a scientific poster presentation
- The 6 key elements of a scientific poster
- How to make a scientific poster
- How to prepare for a scientific poster presentation
- ‘What to do on the day of the poster session.
Our advice comes from our previous experiences as scientists presenting posters at conferences.
Posters can be a powerful way for showcasing your data in scientific meetings. You can get helpful feedback from other researchers as well as expand your professional network and attract fruitful interactions with peers.
Scientific poster sessions tend to be more relaxed than oral presentation sessions, as they provide the opportunity to meet with peers in a less formal setting and to have energizing conversations about your research with a wide cross-section of researchers.
- Physical posters: A poster that is located in an exhibit hall and pinned to a poster board. Physical posters are beneficial since they may be visually available for the duration of a meeting, unlike oral presentations.
- E-posters: A poster that is shown on a screen rather than printed and pinned on a poster board. E-posters can have static or dynamic content. Static e-posters are slideshow presentations consisting of one or more slides, whereas dynamic e-posters include videos or animations.
Some events allow for a combination of both formats.
The sections included in a scientific poster tend to follow the format of a scientific paper , although other designs are possible. For example, the concept of a #betterposter was invented by PhD student Mike Morrison to address the issue of poorly designed scientific posters. It puts the take-home message at the center of the poster and includes a QR code on the poster to learn about further details of the project.
- Anticipate who your audience during the poster session will be—this will depend on the type of meeting. For example, presenting during a poster session at a large conference may attract a broad audience of generalists and specialists at a variety of career stages. You would like for your poster to appeal to all of these groups. You can achieve this by making the main message accessible through eye-catching figures, concise text, and an interesting title.
- Your goal in a poster session is to get your research noticed and to have interesting conversations with attendees. Your poster is a visual aid for the talks you will give, so having a well-organized, clear, and informative poster will help achieve your aim.
- Plan the narrative of your poster. Start by deciding the key take-home message of your presentation, and create a storyboard prioritizing the key findings that indicate the main message. Your storyboard can be a simple sketch of the poster layout, or you can use digital tools to make it. Present your results in a logical order, with the most important result in the center of the poster.
- Give yourself enough time to create a draft of your poster, and to get feedback on it. Since waiting to receive feedback, revising your poster, and sending the final version to the printers may take a few days, it is sensible to give yourself at least 1-2 weeks to make your poster.
- Check if the meeting has specific poster formatting requirements, and if your institution has a poster template with logos and color schemes that you can use. Poster templates can also be found online and can be adapted for use.
- Know where you will get your poster printed, and how long it typically takes to receive the printed poster.
- Ensure you write a specific and informative poster abstract, because specialists in your field may decide to visit your poster based on its quality. This is especially true in large meetings where viewers will choose what posters to visit before the poster session begins because it isn’t possible to read every poster.
➡️ Learn more about how to write an abstract
The technical elements of a scientific poster are:
- Images and Illustrations

Don’t be tempted to cram your entire paper into your poster—details that you omit can be brought up during conversations with viewers. Only include information that is useful for supporting your take-home message. Place your core message in the center of your poster, using either text or visual elements. Avoid jargon, and use concise text elements (no more than 10 lines and 50 words long). Present your data in graphs rather than in tabular form, as it can be difficult for visitors to extract the most important information from tables. Use bullet points and numbered lists to make text content easy to read. Your poster shouldn’t have more than 800 words.
Poster sections should have a logical visual flow, ideally in a longitudinal fashion. For example, in an article on poster presentations published in Nature , scientific illustrator Jamie Simon recommends using the law of thirds to display your research—a 3-column layout with 3 blocks per column. Headings, columns, graphs, and diagrams should be aligned and distributed with enough spacing and balance. The text should be left-aligned while maintaining an appropriate amount of "white space' i.e., areas devoid of any design elements.
To ensure the title is visible from 5 meters away, use a sans serif 85pt font. The body text should use a minimum of 24pt serif font so that it can be read from a one-meter distance. Section headings and subheadings should be in bold. Avoid underlining text and using all capitals in words; instead, a mixture of boldface and italics should be used for emphasis. Use adequate line spacing and one-inch margins to give a clean, uncluttered look.
Appropriate use of color can help readers make comparisons and contrasts in your figures. Account for the needs of color-blind viewers by not using red and green together, and using symbols and dashed lines in your figures. Use a white background for your poster, and black text.
Include no more than 4 figures, with a prominent centerpiece figure in the middle of the poster of your study system or main finding. Dimensions for illustrations, diagrams, and figures should be consistent. When inserting charts, avoid gray backgrounds and grid lines to prevent ink consumption and an unaesthetic look. Graphics used must have proper labels, legible axes, and be adequately sized. Images with a 200 dpi or higher resolution are preferred. If you obtain an image from the internet, make sure it has a high enough resolution and is available in the public domain.
Tools for poster design include Microsoft PowerPoint, Microsoft Publisher, Adobe Illustrator, In Design, Scribus, Canva, Impress, Google Slides, and LaTeX. When starting with the design, the page size should be identical to the final print size. Stick to one design tool to avoid formatting errors.
Have at least one proofreading and feedback round before you print your final poster by following these steps:
- Share your poster draft with your advisor, peers, and ideally, at least one person outside of your field to get feedback.
- Allow time to revise your poster and implement the comments you’ve received.
- Before printing, proofread your final draft. You can use a spelling and grammar-checking tool, or print out a small version of the poster to help locate typos and redundant text.
Before giving a poster presentation, you need to be ready to discuss your research.
- For large meetings where viewers of your poster have a range of specialties, prepare 2-3 levels for your speech, starting with a one-minute talk consisting of key background information and take-home messages. Prepare separate short talks for casual viewers with varying levels of interest in your topic, ranging from "very little" to "some".
- Prepare a 3-5 minute presentation explaining the methods and results for those in your audience with an advanced background.
- Anticipate possible questions that could arise during your presentation and prepare answers for them.
- Practice your speech. You can ask friends, family, or fellow lab members to listen to your practice sessions and provide feedback.
Here we provide a checklist for your presentation day:
- Arrive early—often exhibition halls are large and it can take some time to find the allocated spot for your poster. Bring tape and extra pins to put up your poster properly.
- Wear professional attire and comfortable shoes.
- Be enthusiastic. Start the conversation by introducing yourself and requesting the attendee’s name and field of interest, and offering to explain your poster briefly. Maintain eye contact with attendees visiting your poster while pointing to relevant figures and charts.
- Ask visitors what they know about your topic so that you can tailor your presentation accordingly.
- Some attendees prefer to read through your poster first and then ask you questions. You can still offer to give a brief explanation of your poster and then follow up by answering their questions.
- When you meet with visitors to your poster, you are having a conversation, so you can also ask them questions. If you are not sure they understand what you are saying, ask if your explanation makes sense to them, and clarify points where needed.
- Be professional. Stand at your poster for the duration of the session, and prioritize being available to meet with visitors to your poster over socializing with friends or lab mates. Pay due attention to all visitors at once by acknowledging visitors waiting to speak with you.
A scientific poster is an excellent method to present your work and network with peers. Preparation is essential before your poster session, which includes planning your layout, drafting your poster, practicing your speech, and preparing answers to anticipated questions. The effort invested in preparing your poster will be returned by stimulating conversations during the poster session and greater awareness of your work in your scientific community.
➡️ How to prepare a scientific poster
➡️ Conference presentations: Lead the poster parade
➡️ Designing conference posters
A scientific poster can be used to network with colleagues, get feedback on your research and get recognition as a researcher.
A scientific poster should include a main heading, introduction, methods, results, conclusion, and references.
An e-poster is a poster fashioned as a slideshow presentation that plays on a digital screen, with each slide carrying a sliver of information.
A handful of tools can be used to design a poster including Microsoft PowerPoint, Microsoft Publisher, Illustrator, In Design, Photoshop, Impress, and LaTeX.
Start the conversation by introducing yourself and requesting the attendees' names, affiliations, and fields of interest, and offering to explain your poster briefly. Alternatively, you can give attendees ample time to read through your poster first and then offer to explain your poster in 10 seconds followed by questions and answers.
The Ultimate Guide: How to Create a Standout Research Poster
Craft standout research posters with this guide. Learn how to make research posters that captivate and inform effectively.

Are you a scientist or researcher looking to create a research poster that will grab attention and make an impact? Look no further – in this ultimate guide, we will walk you through the steps to make a research poster that stands out. Whether you’re a beginner or a seasoned professional, Mind the Graph.com is an online platform designed to help you create visually appealing scientific figures, infographics, graphical abstracts, presentations, and posters. With its user-friendly interface and access to over 75,000 scientifically accurate illustrations in 80+ fields, Mind the Graph makes it easy for researchers to communicate their complex data in a visually engaging way. Say goodbye to the challenge of visualizing your research without specialized design skills – Mind the Graph is here to revolutionize scientific communication.
Understanding Research Posters
Importance of research posters.
In the world of scientific research, research posters play a crucial role. They are a popular medium for the presentation of scientific findings at scientific conferences, seminars, and symposia. Research posters provide a snapshot of your work, enabling fellow researchers, students, and the general public to understand the scope, methods, results, and implications of your research.
Moreover, research posters allow for interactive communication. Presenters get the opportunity to discuss their work one-on-one with interested viewers, explain complex concepts, generate discussion, and receive instant feedback. This interactive nature of poster presentations fosters scientific dialogue and collaboration.
Importantly, a well-designed research poster can attract attention and create a lasting impression on conference attendees. With so many posters on display at scientific gatherings, having a standout research poster is critical. It’s not just about presenting your research—it’s about making your research memorable.
What Constitutes a Good Research Poster?
A good research poster is a careful balance of content and design. It succinctly presents the results section your research in a visually appealing and easy-to-read format. Here are the key elements of how to make a research poster:
- Clarity : Your poster should concisely convey your research objective, methods, results, and conclusions. Avoid overly technical jargon and ensure your content is accessible to a broad audience.
- Structure : Your poster should have a logical flow. The layout should guide the viewer from the introduction and objectives, through the methods and results, to the conclusions and implications.
- Visual Appeal : Use figures, graphs, and diagrams to illustrate your points. These visuals should be simple yet informative, helping viewers understand your research at a glance.
- Readability : Choose fonts and colors that are easy on the eyes. Ensure there is sufficient contrast between the text and the background.
- Engagement : Aim to stimulate conversation. Pose thought-provoking questions or highlight surprising findings to draw in viewers and spark discussions.
Remember, the aim is not to cram as much information as possible onto the white space of the paper or poster. It’s about communicating your research effectively and engagingly.
Creating a Standout Research Poster
Essential elements of a research poster.
Creating a standout research poster involves incorporating several essential elements into your design:
- Title : Your title should be brief yet informative, clearly indicating the focus of your research. It’s the first thing viewers see, so make it captivating.
- Authors and Affiliations : List the names of all authors involved in the research and their respective affiliations. The lead author’s name is typically listed first.
- Introduction/Objectives : This section provides a context for your research, outlines your research question, and states your objectives.
- Methods : Describe your research design and the methods you used to collect and analyze data. Be succinct but clear.
- Results : Present your findings using clear and concise text, supplemented by graphs, charts, or images.
- Conclusions : Summarize the key findings and their implications. What does your research mean in the larger context?
- References : Cite any sources or research that informed your study.
- Acknowledgments : Recognize those who assisted in your research or funded your study.
- Contact Information : Include your email or other contact information for viewers who wish to follow up.
Remember, simplicity is key. Your poster’s content layout should be visually engaging, but not cluttered or overwhelming.
Designing with Mind the Graph
Designing a research poster can be a daunting task, especially if you don’t have a background in graphic design. That’s where Mind the Graph comes in. This online platform offers a user-friendly interface and a vast library of scientifically accurate illustrations, making it easy for researchers to create visually engaging scientific posters themselves.
To start, choose from a variety of pre-designed templates or create your own design from scratch. Then, drag and drop your desired illustrations onto your poster. With over 40,000 illustrations in 80+ fields, you’re sure to find images that perfectly represent your own research project.
Next, add your text. Mind the Graph allows you to customize the font, size, and color, ensuring your text complements your visuals and is easy to read.
Finally, use the platform’s tools to arrange your content in a logical, visually pleasing manner. You can easily adjust the size and position of each element, ensuring a balanced layout.
With Mind the Graph, you don’t need to be a design expert to create a professional, eye-catching research poster.
Making Use of Mind the Graph
Navigating the mind the graph platform.

Navigating the Mind the Graph platform is straightforward, even for beginners. Here’s a simple guide to help you get started:
First, sign up for a free account on the Mind the Graph website. Once logged in, you’ll be directed to the dashboard. From here, you can create a new project, view your saved projects, or explore the platform’s vast library of scientific illustrations.
To create a new research poster, click on the “New Infographic” button. You’ll be prompted to choose a template. Mind the Graph offers a variety of templates tailored to different scientific fields and presentation types.
Once you’ve selected a template, you’ll be taken to the editor. Here, you can add text, change fonts and colors, and insert illustrations. The platform’s drag-and-drop interface makes it easy to add and rearrange elements on your poster.
On the left-hand side, you’ll find the tools menu. Here, you can access more design options, such as shapes, lines, and backgrounds.
Remember, the Mind the Graph team is always ready to assist if you have any questions or need help navigating the platform.
Utilizing Scientific Illustrations
Scientific illustrations are a powerful tool for visualizing complex research data. Mind the Graph offers a wealth of scientifically accurate illustrations to enhance your research poster.
To access the illustrations library, navigate to the “Illustrations” tab in the editor. Here, you can browse through over 40,000 illustrations in 80+ fields. You can search for specific illustrations using the search bar at the top or filter by categories.
Once you’ve found an illustration you’d like to use, simply click on it and drag it onto your poster. You can resize and reposition the print, entire poster or illustration as needed.
Using illustrations can help break up text-heavy sections well-designed posters, making your poster more engaging and easier to digest. They can also help to highlight key points, demonstrate processes, and represent results visually.
Remember, while illustrations can greatly enhance your poster, they should not be overly complex or confusing. The goal of visual representation is to aid understanding, not to complicate it. Use illustrations judiciously and ensure they directly support your research message.
Advantages of Using Mind the Graph
Using Mind the Graph to create your research poster has several key advantages.
Firstly, it democratizes great poster design for scientists and researchers. With its user-friendly interface, you don’t need to be a graphic design expert to create a professional-looking scientific poster either.
Secondly, it offers a vast library of scientifically accurate illustrations good poster make. This resource saves you the time and effort of creating visuals from scratch and ensures your poster is both visually appealing and scientifically sound.
Thirdly, it’s customizable. You can easily adjust the font, color, size, and positioning of every element on your poster, ensuring your poster design aligns with your research and personal style.
Lastly, it’s efficient. With Mind the Graph, you can create a poster in less time than it would take using traditional design software. Plus, with the ability to save and edit your project, you can work on your poster at your own pace.
In short, Mind the Graph equips you with the tools to effectively communicate your research in a visually engaging way.
Finalizing Your Research Poster
Reviewing your research poster.
Once you’ve completed your initial design, it’s essential to take the time to review your research poster thoroughly. Here are some points to consider:
- Clarity : Is your message clear and concise? Does your poster effectively communicate your research objective, methods, results, and conclusions?
- Flow : Check the logical progression of your content. Can viewers easily follow the flow from the introduction to the conclusion?
- Visuals : Review your illustrations and charts. Do they accurately represent your data and enhance understanding?
- Typography : Check your text for readability. Is the font size large enough? Is there sufficient contrast between the text and the background?
- Errors : Proofread your text for any spelling, grammar, or punctuation errors. Also, check your data for any inaccuracies.
- Feedback : Consider getting feedback from colleagues or mentors. They can provide a fresh perspective and may spot errors or areas for improvement that you might have missed.
Remember, a little extra time spent reviewing and refining your poster can make a significant difference in the poster display final outcome. It’s worth the effort.
Making Your Research Poster Accessible
Accessibility should be a priority when finalizing your research poster. Ensuring your effective poster presentation is accessible to all viewers, regardless of their ability, is not just ethical – it enhances the reach and impact of your research.
Here are some simple ways to make your poster more accessible:
- Color Contrast : Use colors that contrast well to ensure your text and illustrations are clear and distinguishable. Avoid using color as the only means of conveying important information, as this can be problematic for viewers with color vision deficiencies.
- Font Size : Use a large, easy-to-read font size. This not only helps viewers with visual impairments but also makes your poster easier to read from a distance.
- Clear Language : Use clear, concise language and avoid unnecessary jargon. This makes your research accessible to viewers from different backgrounds and knowledge levels.
- Captioning : Provide captions or alternative text for images and diagrams. This helps viewers with visual impairments understand the content of your visuals.
- Layout : Arrange the elements of your poster in a logical, linear order. This helps viewers with cognitive impairments follow your content more easily.
Remember, an accessible academic poster, is an effective poster. Make sure the poster title of your research can be appreciated by everyone.
Promoting Your Research Poster with Mind the Graph
Once you’ve created your standout research poster, it’s time to share it with the world. Mind the Graph can aid in promoting your research poster to a wider audience.
Firstly, you can download your poster in a high-resolution format suitable for printing or digital viewing. You can also share a direct link to your online poster or embed it in your website or blog.
Furthermore, Mind the Graph has a continually growing community of scientists and researchers from around the world. Becoming part of this community allows you to share your work, get feedback, and engage in scientific discussions. You can also explore and get inspired by the work of others.
Remember, promoting your research is an integral part of the scientific process. It’s not enough to do good research; you need to communicate it effectively and make it accessible to others. Whether you’re presenting at a conference, a poster session, a seminar, or online, Mind the Graph is here to help you make your research and poster sessions stand out and be seen.
Enhance your research with compelling visuals through Mind the Graph
The Mind the Graph platform provides customizable scientific illustrations, templates, and design tools, empowering scientists to create engaging figures that convey findings effectively. With features for data integration and customization of colors, fonts, and styles, researchers can personalize their visuals to match their unique research style, ensuring broader accessibility and memorability.

Subscribe to our newsletter
Exclusive high quality content about effective visual communication in science.
Unlock Your Creativity
Create infographics, presentations and other scientifically-accurate designs without hassle — absolutely free for 7 days!
About Fabricio Pamplona
Fabricio Pamplona is the founder of Mind the Graph - a tool used by over 400K users in 60 countries. He has a Ph.D. and solid scientific background in Psychopharmacology and experience as a Guest Researcher at the Max Planck Institute of Psychiatry (Germany) and Researcher in D'Or Institute for Research and Education (IDOR, Brazil). Fabricio holds over 2500 citations in Google Scholar. He has 10 years of experience in small innovative businesses, with relevant experience in product design and innovation management. Connect with him on LinkedIn - Fabricio Pamplona .
Content tags

Research Posters
What are research posters, what should a research poster look like, what software can i use to make one, where can i print my poster.
- Themes, Colors, and Emphasis
- Text Formatting
- Writing Style
- Hyperlinks and URLs
- Including Images
- Actual Examples
- How to Present Posters
Acknowledgements
This guide is based off of Librarian Professor Ashley Orehek Rossi's presentation at the 2024 Student Scholar Showcase Workshop series .
Research posters provide general (or detailed) overviews about research either you are currently working on or already completed. Think of them like "mini research papers" or a summarized version of your research -- You want to discuss your research project in a short, concise narrative (with pictures!).

- Microsoft PowerPoint
- Google Slides
- Microsoft Publisher
PowerPoint is versatile! You have the freedom to place objects wherever you want on a page. It will also help you line up and space content evenly. PowerPoint is a very popular software to make posters in.
How do I adjust the slide size to my poster size?
For example, let's say you need a poster that is 36 inches by 48 inches. In the menu ribbon:
Design > Slide Size > Custom Slide Size. Change the Slides sized for: to Custom . Enter the dimensions as 36 inches wide by 48 inches high. Click OK .
Just like PowerPoint, Google Slides is versatile and you have the freedom to place objects wherever on a page.
File > Page Setup > Custom. Change the Page Setup to Custom . Enter the dimensions as 36 inches wide by 48 inches high. Click Apply .
Publisher is a graphic design app from Microsoft. It allows users to create various types of documents using templates provided, downloaded templates, or starting from a blank canvas. Like PowerPoint, you can place objects anywhere you want on a page.
PRO: What makes it preferred than Microsoft Word is that page layout is emphasized, so you don't need to fret about adjusting alignments or line spacing -- You have the freedom to place objects wherever you need to on the document.
CON: It is only available on desktop or laptop computers - You cannot access it from Microsoft 365 online.
How do I resize my Publisher page?
Page Design > Page Setup > Change Width and Height values and/or units.
Canva is like an online version of Microsoft Publisher. It allows user to make designs for both online content and printed materials. Media types include, but not limited to, videos, social media posts, documents, and websites. You can also invite others to collaborate on projects, just like Google Docs.
Canva offers two plans for account holders: Free and Pro.
Information from Canva.com (Accessed 25 Oct 2023).
The WKU Print Center (ground floor DSU) can print posters for you for a fee. You can also check with your academic major department if they have a poster printer available.
Stores like Staples and Office Depot / OfficeMax offer poster printing services.
- Next: Themes, Colors, and Emphasis >>
- Last Updated: Apr 11, 2024 3:15 PM
- URL: https://libguides.wku.edu/posters
University Library, University of Illinois at Urbana-Champaign

Research Posters
- Elements of a poster
CREATING YOUR POSTER
Color scheme choices.
- WHAT TO INCLUDE IN YOUR POSTER
- More helpful tips
- Visualizations & images
- Illinois logo
- Archiving - Grad Students
- More Resources
- Oral Presentations
- 2024 Undergraduate Research Symposium This link opens in a new window
You have two choices when creating a research poster:
- You can create your poster from scratch by using PowerPoint, Adobe InDesign, or a similar design program.
- You can use one of the University of Illinois Research Poster Templates .
Sizing your Poster
- If you are presenting for the Undergraduate Research Symposium , resize your slide to width 48 inches by height 36 inches.
- If you are presenting at a professional conference , your instructions should indicate the size limits of your poster. Standard U.S. conference poster size is 48" by 36".
IMPORTANT: You must change the size of your slide before you start working on your poster. This will ensure that your images and text do not become pixilated when the poster is printed. See below for specific instructions.
How to correctly size your poster in PowerPoint:
- Select the "Design" tab
- Click "Slide Size"
- Select "Page Setup"
- Under the "Slides sized for:" dropdown menu, select "Custom"
- Set the "Width" and "Height" to what is needed for your poster
- Click "OK"

How to correctly size your poster in Adobe InDesign:
When a new document is created in Adobe InDesign, a dialogue box prompts you to enter dimensions:

- Change the dimension metric to inches from the drop down box.
- Margins are intentional space from an object to the edge of the poster, intended not to be trimmed. You can set this to 0 inches on all sides unless you have a specific plan to use margins in your design.
- Bleed shows the printer where to trim white space that occurs when printing color onto white poster paper. If you are printing your poster, include at least a 0.25 inch bleed on each side; remember not to place any content in the bleed as it will be trimmed by the printer.
- Slug is a space for the creator to leave any notes for the printer. You can set this to 0 inches unless you have notes.
If you ever want to change your poster dimensions after starting the poster, you can do so through the Document Setup Menu .
Using multiple font styles can really make your poster stand out and look professional. Consult this graphic to understand different font styles, what fonts work best together, and what fonts to avoid.
Sticking to a color scheme can help your poster look professional. Consistent use of color can help your viewer understand how information is organized on your poster. Not sure where to start with color?
- Pick colors from an image (including a custom one you're planning to use on your poster)
- Use Illinois branding colors
Not sure what to do with the hex code from a brand guide or color palette generator?
- Adobe InDesign
Always check that your text is accessible on background colors using WebAIM's free contrast checker.
If printing your poster, it's a good idea to do a small-scale test print of your poster before getting it printed. Colors often appear brighter and more vibrant on a screen than when printed. There still might be some variation in color depending on the color scale the printer uses, but it will be a closer match on paper than what you see on screen.
- << Previous: Examples
- Next: Visualizations & images >>
- Last Updated: May 13, 2024 2:05 PM
- URL: https://guides.library.illinois.edu/poster
University Libraries
- Ohio University Libraries
- Library Guides
Better Research Posters
- Creating Posters
- Introduction
Poster Size
Free resources, common poster sizes .
OU Printing services also has information on poster size and pricing.
Composition and layout are crucial in design as they determine how visual elements are arranged to create a harmonious and effective communication of information.
Rule of 3rds grid

The rule of thirds is a design principle that involves dividing a visual space into a grid. In the context of designing a research poster, the rule of thirds is important for several reasons such as visual hierarchy, balance, organization, aesthetic appeal, and emphasis.
Font size
When creating a large format posters, the minimum point size you should use depends on the size of the poster.
18in x 24in: Title 35pt | Sub-heading 20pt | Body text 16pt
36in x 48in: Title: 75pt | Sub-Heading 45pt | Body 35pt
Information Overload

One of the most common mistakes with research posters is including too much text. Many researchers fall into the trap of presenting their entire research paper on the poster, making it dense and overwhelming for viewers. A successful poster should convey key information succinctly, using concise text and visual elements to engage the audience. There should only be a few bullet points of text;
- Introduction (3 sentences max).
- Your question or why your question is worth asking.
- Your methods.
Remember that you're presenting this so the text on your poster should only act as reference points for your pitch.
Text Alignments
Punchlines are great to use in the "better poster" design! If your punchline is more than 2 lines, don’t center it. Centered text is slower to read than left-aligned text.

- Poster Nerd: Offers free Powerpoint templates to get you started. All templates work within the limitations of PowerPoint and have customizable colors.
- Bio Render: A web-based tool designed for researchers to create professional scientific illustrations and figures. Free when you sign up.
- Unsplash: A website that provides royalty-free images for free. Users can download and use the images from Unsplash for various purposes, including personal and commercial projects, without the need for attribution.
- << Previous: Introduction
- Next: QR Codes >>

An official website of the United States government
The .gov means it’s official. Federal government websites often end in .gov or .mil. Before sharing sensitive information, make sure you’re on a federal government site.
The site is secure. The https:// ensures that you are connecting to the official website and that any information you provide is encrypted and transmitted securely.
- Publications
- Account settings
Preview improvements coming to the PMC website in October 2024. Learn More or Try it out now .
- Advanced Search
- Journal List
- Health Serv Res
- v.42(1 Pt 1); 2007 Feb
Preparing and Presenting Effective Research Posters
Associated data.
APPENDIX A.2. Comparison of Research Papers, Presentations, and Posters—Contents.
Posters are a common way to present results of a statistical analysis, program evaluation, or other project at professional conferences. Often, researchers fail to recognize the unique nature of the format, which is a hybrid of a published paper and an oral presentation. This methods note demonstrates how to design research posters to convey study objectives, methods, findings, and implications effectively to varied professional audiences.
A review of existing literature on research communication and poster design is used to identify and demonstrate important considerations for poster content and layout. Guidelines on how to write about statistical methods, results, and statistical significance are illustrated with samples of ineffective writing annotated to point out weaknesses, accompanied by concrete examples and explanations of improved presentation. A comparison of the content and format of papers, speeches, and posters is also provided.
Each component of a research poster about a quantitative analysis should be adapted to the audience and format, with complex statistical results translated into simplified charts, tables, and bulleted text to convey findings as part of a clear, focused story line.
Conclusions
Effective research posters should be designed around two or three key findings with accompanying handouts and narrative description to supply additional technical detail and encourage dialog with poster viewers.
An assortment of posters is a common way to present research results to viewers at a professional conference. Too often, however, researchers treat posters as poor cousins to oral presentations or published papers, failing to recognize the opportunity to convey their findings while interacting with individual viewers. By neglecting to adapt detailed paragraphs and statistical tables into text bullets and charts, they make it harder for their audience to quickly grasp the key points of the poster. By simply posting pages from the paper, they risk having people merely skim their work while standing in the conference hall. By failing to devise narrative descriptions of their poster, they overlook the chance to learn from conversations with their audience.
Even researchers who adapt their paper into a well-designed poster often forget to address the range of substantive and statistical training of their viewers. This step is essential for those presenting to nonresearchers but also pertains when addressing interdisciplinary research audiences. Studies of policymakers ( DiFranza and the Staff of the Advocacy Institute 1996 ; Sorian and Baugh 2002 ) have demonstrated the importance of making it readily apparent how research findings apply to real-world issues rather than imposing on readers to translate statistical findings themselves.
This methods note is intended to help researchers avoid such pitfalls as they create posters for professional conferences. The first section describes objectives of research posters. The second shows how to describe statistical results to viewers with varied levels of statistical training, and the third provides guidelines on the contents and organization of the poster. Later sections address how to prepare a narrative and handouts to accompany a research poster. Because researchers often present the same results as published research papers, spoken conference presentations, and posters, Appendix A compares similarities and differences in the content, format, and audience interaction of these three modes of presenting research results. Although the focus of this note is on presentation of quantitative research results, many of the guidelines about how to prepare and present posters apply equally well to qualitative studies.
WHAT IS A RESEARCH POSTER?
Preparing a poster involves not only creating pages to be mounted in a conference hall, but also writing an associated narrative and handouts, and anticipating the questions you are likely to encounter during the session. Each of these elements should be adapted to the audience, which may include people with different levels of familiarity with your topic and methods ( Nelson et al. 2002 ; Beilenson 2004 ). For example, the annual meeting of the American Public Health Association draws academics who conduct complex statistical analyses along with practitioners, program planners, policymakers, and journalists who typically do not.
Posters are a hybrid form—more detailed than a speech but less than a paper, more interactive than either ( Appendix A ). In a speech, you (the presenter) determine the focus of the presentation, but in a poster session, the viewers drive that focus. Different people will ask about different facets of your research. Some might do policy work or research on a similar topic or with related data or methods. Others will have ideas about how to apply or extend your work, raising new questions or suggesting different contrasts, ways of classifying data, or presenting results. Beilenson (2004) describes the experience of giving a poster as a dialogue between you and your viewers.
By the end of an active poster session, you may have learned as much from your viewers as they have from you, especially if the topic, methods, or audience are new to you. For instance, at David Snowdon's first poster presentation on educational attainment and longevity using data from The Nun Study, another researcher returned several times to talk with Snowdon, eventually suggesting that he extend his research to focus on Alzheimer's disease, which led to an important new direction in his research ( Snowdon 2001 ). In addition, presenting a poster provides excellent practice in explaining quickly and clearly why your project is important and what your findings mean—a useful skill to apply when revising a speech or paper on the same topic.
WRITING FOR A VARIED PROFESSIONAL AUDIENCE
Audiences at professional conferences vary considerably in their substantive and methodological backgrounds. Some will be experts on your topic but not your methods, some will be experts on your methods but not your topic, and most will fall somewhere in between. In addition, advances in research methods imply that even researchers who received cutting-edge methodological training 10 or 20 years ago might not be conversant with the latest approaches. As you design your poster, provide enough background on both the topic and the methods to convey the purpose, findings, and implications of your research to the expected range of readers.
Telling a Simple, Clear Story
Write so your audience can understand why your work is of interest to them, providing them with a clear take-home message that they can grasp in the few minutes they will spend at your poster. Experts in communications and poster design recommend planning your poster around two to three key points that you want your audience to walk away with, then designing the title, charts, and text to emphasize those points ( Briscoe 1996 ; Nelson et al. 2002 ; Beilenson 2004 ). Start by introducing the two or three key questions you have decided will be the focus of your poster, and then provide a brief overview of data and methods before presenting the evidence to answer those questions. Close with a summary of your findings and their implications for research and policy.
A 2001 survey of government policymakers showed that they prefer summaries of research to be written so they can immediately see how the findings relate to issues currently facing their constituencies, without wading through a formal research paper ( Sorian and Baugh 2002 ). Complaints that surfaced about many research reports included that they were “too long, dense, or detailed,” or “too theoretical, technical, or jargony.” On average, respondents said they read only about a quarter of the research material they receive for detail, skim about half of it, and never get to the rest.
To ensure that your poster is one viewers will read, understand, and remember, present your analyses to match the issues and questions of concern to them, rather than making readers translate your statistical results to fit their interests ( DiFranza and the Staff of the Advocacy Institute 1996 ; Nelson et al. 2002 ). Often, their questions will affect how you code your data, specify your model, or design your intervention and evaluation, so plan ahead by familiarizing yourself with your audience's interests and likely applications of your study findings. In an academic journal article, you might report parameter estimates and standard errors for each independent variable in your regression model. In the poster version, emphasize findings for specific program design features, demographic, or geographic groups, using straightforward means of presenting effect size and statistical significance; see “Describing Numeric Patterns and Contrasts” and “Presenting Statistical Test Results” below.
The following sections offer guidelines on how to present statistical findings on posters, accompanied by examples of “poor” and “better” descriptions—samples of ineffective writing annotated to point out weaknesses, accompanied by concrete examples and explanations of improved presentation. These ideas are illustrated with results from a multilevel analysis of disenrollment from the State Children's Health Insurance Program (SCHIP; Phillips et al. 2004 ). I chose that paper to show how to prepare a poster about a sophisticated quantitative analysis of a topic of interest to HSR readers, and because I was a collaborator in that study, which was presented in the three formats compared here—as a paper, a speech, and a poster.
Explaining Statistical Methods
Beilenson (2004) and Briscoe (1996) suggest keeping your description of data and methods brief, providing enough information for viewers to follow the story line and evaluate your approach. Avoid cluttering the poster with too much technical detail or obscuring key findings with excessive jargon. For readers interested in additional methodological information, provide a handout and a citation to the pertinent research paper.
As you write about statistical methods or other technical issues, relate them to the specific concepts you study. Provide synonyms for technical and statistical terminology, remembering that many conferences of interest to policy researchers draw people from a range of disciplines. Even with a quantitatively sophisticated audience, don't assume that people will know the equivalent vocabulary used in other fields. A few years ago, the journal Medical Care published an article whose sole purpose was to compare statistical terminology across various disciplines involved in health services research so that people could understand one another ( Maciejewski et al. 2002 ). After you define the term you plan to use, mention the synonyms from the various fields represented in your audience.
Consider whether acronyms are necessary on your poster. Avoid them if they are not familiar to the field or would be used only once or twice on your poster. If you use acronyms, spell them out at first usage, even those that are common in health services research such as “HEDIS®”(Health Plan Employer Data and Information Set) or “HLM”(hierarchical linear model).
Poor: “We use logistic regression and a discrete-time hazards specification to assess relative hazards of SCHIP disenrollment, with plan level as our key independent variable.” Comment: Terms like “discrete-time hazards specification” may be confusing to readers without training in those methods, which are relatively new on the scene. Also the meaning of “SCHIP” or “plan level” may be unfamiliar to some readers unless defined earlier on the poster.
Better: “Chances of disenrollment from the State Children's Health Insurance Program (SCHIP) vary by amount of time enrolled, so we used hazards models (also known as event history analysis or survival analysis) to correct for those differences when estimating disenrollment patterns for SCHIP plans for different income levels.” Comment: This version clarifies the terms and concepts, naming the statistical method and its synonyms, and providing a sense of why this type of analysis is needed.
To explain a statistical method or assumption, paraphrase technical terms and illustrate how the analytic approach applies to your particular research question and data:
Poor : “The data structure can be formulated as a two-level hierarchical linear model, with families (the level-1 unit of analysis) nested within counties (the level-2 unit of analysis).” Comment: Although this description would be fine for readers used to working with this type of statistical model, those who aren't conversant with those methods may be confused by terminology such as “level-1” and “unit of analysis.”
Better: “The data have a hierarchical (or multilevel) structure, with families clustered within counties.” Comment: By replacing “nested” with the more familiar “clustered,” identifying the specific concepts for the two levels of analysis, and mentioning that “hierarchical” and “multilevel” refer to the same type of analytic structure, this description relates the generic class of statistical model to this particular study.
Presenting Results with Charts
Charts are often the preferred way to convey numeric patterns, quickly revealing the relative sizes of groups, comparative levels of some outcome, or directions of trends ( Briscoe 1996 ; Tufte 2001 ; Nelson et al. 2002 ). As Beilenson puts it, “let your figures do the talking,” reducing the need for long text descriptions or complex tables with lots of tiny numbers. For example, create a pie chart to present sample composition, use a simple bar chart to show how the dependent variable varies across subgroups, or use line charts or clustered bar charts to illustrate the net effects of nonlinear specifications or interactions among independent variables ( Miller 2005 ). Charts that include confidence intervals around point estimates are a quick and effective way to present effect size, direction, and statistical significance. For multivariate analyses, consider presenting only the results for the main variables of interest, listing the other variables in the model in a footnote and including complex statistical tables in a handout.
Provide each chart with a title (in large type) that explains the topic of that chart. A rhetorical question or summary of the main finding can be very effective. Accompany each chart with a few annotations that succinctly describe the patterns in that chart. Although each chart page should be self-explanatory, be judicious: Tufte (2001) cautions against encumbering your charts with too much “nondata ink”—excessive labeling or superfluous features such as arrows and labels on individual data points. Strive for a balance between guiding your readers through the findings and maintaining a clean, uncluttered poster. Use chart types that are familiar to your expected audience. Finally, remember that you can flesh out descriptions of charts and tables in your script rather than including all the details on the poster itself; see “Narrative to Accompany a Poster.”
Describing Numeric Patterns and Contrasts
As you describe patterns or numeric contrasts, whether from simple calculations or complex statistical models, explain both the direction and magnitude of the association. Incorporate the concepts under study and the units of measurement rather than simply reporting coefficients (β's) ( Friedman 1990 ; Miller 2005 ).
Poor: “Number of enrolled children in the family is correlated with disenrollment.” Comment: Neither the direction nor the size of the association is apparent.
Poor [version #2]: “The log-hazard of disenrollment for one-child families was 0.316.” Comment: Most readers find it easier to assess the size and direction from hazards ratios (a form of relative risk) instead of log-hazards (log-relative risks, the β's from a hazards model).
Better: “Families with only one child enrolled in the program were about 1.4 times as likely as larger families to disenroll.” Comment: This version explains the association between number of children and disenrollment without requiring viewers to exponentiate the log-hazard in their heads to assess the size and direction of that association. It also explicitly identifies the group against which one-child families are compared in the model.
Presenting Statistical Test Results
On your poster, use an approach to presenting statistical significance that keeps the focus on your results, not on the arithmetic needed to conduct inferential statistical tests. Replace standard errors or test statistics with confidence intervals, p- values, or symbols, or use formatting such as boldface, italics, or a contrasting color to denote statistically significant findings ( Davis 1997 ; Miller 2005 ). Include the detailed statistical results in handouts for later perusal.
To illustrate these recommendations, Figures 1 and and2 2 demonstrate how to divide results from a complex, multilevel model across several poster pages, using charts and bullets in lieu of the detailed statistical table from the scientific paper ( Table 1 ; Phillips et al. 2004 ). Following experts' advice to focus on one or two key points, these charts emphasize the findings from the final model (Model 5) rather than also discussing each of the fixed- and random-effects specifications from the paper.

Presenting Complex Statistical Results Graphically

Text Summary of Additional Statistical Results
Multilevel Discrete-Time Hazards Models of Disenrollment from SCHIP, New Jersey, January 1998–April 2000
Source : Phillips et al. (2004) .
SCHIP, State Children's Health Insurance Program; LRH, log relative-hazard; SE, standard error.
Figure 1 uses a chart (also from the paper) to present the net effects of a complicated set of interactions between two family-level traits (race and SCHIP plan) and a cross-level interaction between race of the family and county physician racial composition. The title is a rhetorical question that identifies the issue addressed in the chart, and the annotations explain the pattern. The chart version substantially reduces the amount of time viewers need to understand the main take-home point, averting the need to mentally sum and exponentiate several coefficients from the table.
Figure 2 uses bulleted text to summarize other key results from the model, translating log-relative hazards into hazards ratios and interpreting them with minimal reliance on jargon. The results for family race, SCHIP plan, and county physician racial composition are not repeated in Figure 2 , averting the common problem of interpreting main effect coefficients and interaction coefficients without reference to one another.
Alternatively, replace the text summary shown in Figure 2 with Table 2 —a simplified version of Table 1 which presents only the results for Model 5, replaces log-relative hazards with hazards ratios, reports associated confidence intervals in lieu of standard errors, and uses boldface to denote statistical significance. (On a color slide, use a contrasting color in lieu of bold.)
Relative Risks of SCHIP Disenrollment for Other * Family and County Characteristics, New Jersey, January 1998–April 2000
Statistically significant associations are shown in bold.
Based on hierarchical linear model controlling for months enrolled, months-squared, race, SCHIP plan, county physician racial composition, and all variables shown here. Scaled deviance =30,895. Random effects estimate for between-county variance =0.005 (standard error =0.006). SCHIP, State Children's Health Insurance Program; 95% CI, 95% confidence interval.
CONTENTS AND ORGANIZATION OF A POSTER
Research posters are organized like scientific papers, with separate pages devoted to the objectives and background, data and methods, results, and conclusions ( Briscoe 1996 ). Readers view the posters at their own pace and at close range; thus you can include more detail than in slides for a speech (see Appendix A for a detailed comparison of content and format of papers, speeches, and posters). Don't simply post pages from the scientific paper, which are far too text-heavy for a poster. Adapt them, replacing long paragraphs and complex tables with bulleted text, charts, and simple tables ( Briscoe 1996 ; Beilenson 2004 ). Fink (1995) provides useful guidelines for writing text bullets to convey research results. Use presentation software such as PowerPoint to create your pages or adapt them from related slides, facilitating good page layout with generous type size, bullets, and page titles. Such software also makes it easy to create matching handouts (see “Handouts”).
The “W's” (who, what, when, where, why) are an effective way to organize the elements of a poster.
- In the introductory section, describe what you are studying, why it is important, and how your analysis will add to the existing literature in the field.
- In the data and methods section of a statistical analysis, list when, where, who, and how the data were collected, how many cases were involved, and how the data were analyzed. For other types of interventions or program evaluations, list who, when, where, and how many, along with how the project was implemented and assessed.
- In the results section, present what you found.
- In the conclusion, return to what you found and how it can be used to inform programs or policies related to the issue.
Number and Layout of Pages
To determine how many pages you have to work with, find out the dimensions of your assigned space. A 4′ × 8′ bulletin board accommodates the equivalent of about twenty 8.5″ × 11″ pages, but be selective—no poster can capture the full detail of a large series of multivariate models. A trifold presentation board (3′ high by 4′ wide) will hold roughly a dozen pages, organized into three panels ( Appendix B ). Breaking the arrangement into vertical sections allows viewers to read each section standing in one place while following the conventions of reading left-to-right and top-to-bottom ( Briscoe 1996 ).
- At the top of the poster, put an informative title in a large, readable type size. On a 4′ × 8′ bulletin board, there should also be room for an institutional logo.

Suggested Layout for a 4′ × 8′ poster.
- In the left-hand panel, set the stage for the research question, conveying why the topic is of policy interest, summarizing major empirical or theoretical work on related topics, and stating your hypotheses or project aims, and explaining how your work fills in gaps in previous analyses.
- In the middle panel, briefly describe your data source, variables, and methods, then present results in tables or charts accompanied by text annotations. Diagrams, maps, and photographs are very effective for conveying issues difficult to capture succinctly in words ( Miller 2005 ), and to help readers envision the context. A schematic diagram of relationships among variables can be useful for illustrating causal order. Likewise, a diagram can be a succinct way to convey timing of different components of a longitudinal study or the nested structure of a multilevel dataset.
- In the right-hand panel, summarize your findings and relate them back to the research question or project aims, discuss strengths and limitations of your approach, identify research, practice, or policy implications, and suggest directions for future research.
Figure 3 (adapted from Beilenson 2004 ) shows a suggested layout for a 4′ × 8′ bulletin board, designed to be created using software such as Pagemaker that generates a single-sheet presentation; Appendix C shows a complete poster version of the Phillips et al. (2004) multilevel analysis of SCHIP disenrollment. If hardware or budget constraints preclude making a single-sheet poster, a similar configuration can be created using standard 8.5″ × 11″ pages in place of the individual tables, charts, or blocks of text shown in Figure 3 .
Find out well in advance how the posters are to be mounted so you can bring the appropriate supplies. If the room is set up for table-top presentations, tri-fold poster boards are essential because you won't have anything to attach a flat poster board or pages to. If you have been assigned a bulletin board, bring push-pins or a staple gun.
Regardless of whether you will be mounting your poster at the conference or ahead of time, plan how the pages are to be arranged. Experiment with different page arrangements on a table marked with the dimensions of your overall poster. Once you have a final layout, number the backs of the pages or draw a rough sketch to work from as you arrange the pages on the board. If you must pin pages to a bulletin board at the conference venue, allow ample time to make them level and evenly spaced.
Other Design Considerations
A few other issues to keep in mind as you design your poster. Write a short, specific title that fits in large type size on the title banner of your poster. The title will be potential readers' first glimpse of your poster, so make it inviting and easy to read from a distance—at least 40-point type, ideally larger. Beilenson (2004) advises embedding your key finding in the title so viewers don't have to dig through the abstract or concluding page to understand the purpose and conclusions of your work. A caution: If you report a numeric finding in your title, keep in mind that readers may latch onto it as a “factoid” to summarize your conclusions, so select and phrase it carefully ( McDonough 2000 ).
Use at least 14-point type for the body of the poster text. As Briscoe (1996) points out, “many in your audience have reached the bifocal age” and all of them will read your poster while standing, hence long paragraphs in small type will not be appreciated! Make judicious use of color. Use a clear, white, or pastel for the background, with black or another dark color for most text, and a bright, contrasting shade to emphasize key points or to identify statistically significant results ( Davis 1997 ).
NARRATIVE TO ACCOMPANY A POSTER
Prepare a brief oral synopsis of the purpose, findings, and implications of your work to say to interested parties as they pause to read your poster. Keep it short—a few sentences that highlight what you are studying, a couple of key findings, and why they are important. Design your overview as a “sound byte” that captures your main points in a succinct and compelling fashion ( Beilenson 2004 ). After hearing your introduction, listeners will either nod and move along or comment on some aspect of your work that intrigues them. You can then tailor additional discussion to individual listeners, adjusting the focus and amount of detail to suit their interests. Gesture at the relevant pages as you make each point, stating the purpose of each chart or table and explaining its layout before describing the numeric findings; see Miller (2005) for guidelines on how to explain tables and charts to a live audience. Briscoe (1996) points out that these mini-scripts are opportunities for you to fill in details of your story line, allowing you to keep the pages themselves simple and uncluttered.
Prepare short answers to likely questions about various aspects of your work, such as why it is important from a policy or research perspective, or descriptions of data, methods, and specific results. Think of these as little modules from an overall speech—concise descriptions of particular elements of your study that you can choose among in response to questions that arise. Beilenson (2004) also recommends developing a few questions to ask your viewers, inquiring about their reactions to your findings, ideas for additional questions, or names of others working on the topic.
Practice your poster presentation in front of a test audience acquainted with the interests and statistical proficiency of your expected viewers. Ideally, your critic should not be too familiar with your work: A fresh set of eyes and ears is more likely to identify potential points of confusion than someone who is jaded from working closely with the material while writing the paper or drafting the poster ( Beilenson 2004 ). Ask your reviewer to identify elements that are unclear, flag jargon to be paraphrased or defined, and recommend changes to improve clarity ( Miller 2005 ). Have them critique your oral presentation as well as the contents and layout of the poster.
Prepare handouts to distribute to interested viewers. These can be produced from slides created in presentation software, printed several to a page along with a cover page containing the abstract and your contact information. Or package an executive summary or abstract with a few key tables or charts. Handouts provide access to the more detailed literature review, data and methods, full set of results, and citations without requiring viewers to read all of that information from the poster ( Beilenson 2004 ; Miller 2005 ). Although you also can bring copies of the complete paper, it is easier on both you and your viewers if you collect business cards or addresses and mail the paper later.
The quality and effectiveness of research posters at professional conferences is often compromised by authors' failure to take into account the unique nature of such presentations. One common error is posting numerous statistical tables and long paragraphs from a research paper—an approach that overwhelms viewers with too much detail for this type of format and presumes familiarity with advanced statistical techniques. Following recommendations from the literature on research communication and poster design, this paper shows how to focus each poster on a few key points, using charts and text bullets to convey results as part of a clear, straightforward story line, and supplementing with handouts and an oral overview.
Another frequent mistake is treating posters as a one-way means of communication. Unlike published papers, poster sessions are live presentations; unlike speeches, they allow for extended conversation with viewers. This note explains how to create an oral synopsis of the project, short modular descriptions of poster elements, and questions to encourage dialog. By following these guidelines, researchers can substantially improve their conference posters as vehicles to disseminate findings to varied research and policy audiences.
CHECKLIST FOR PREPARING AND PRESENTING AN EFFECTIVE RESEARCH POSTERS
- Design poster to focus on two or three key points.
- Adapt materials to suit expected viewers' knowledge of your topic and methods.
- Design questions to meet their interests and expected applications of your work.
- Paraphrase descriptions of complex statistical methods.
- Spell out acronyms if used.
- Replace large detailed tables with charts or small, simplified tables.
- Accompany tables or charts with bulleted annotations of major findings.
- Describe direction and magnitude of associations.
- Use confidence intervals, p -values, symbols, or formatting to denote statistical significance.
Layout and Format
- Organize the poster into background, data and methods, results, and study implications.
- Divide the material into vertical sections on the poster.
- Use at least 14-point type in the body of your poster, at least 40-point for the title.
Narrative Description
- Rehearse a three to four sentence overview of your research objectives and main findings.
- Summary of key studies and gaps in existing literature
- Data and methods
- Each table, chart, or set of bulleted results
- Research, policy, and practice implications
- Solicit their input on your findings
- Develop additional questions for later analysis
- Identify other researchers in the field
- Prepare handouts to distribute to interested viewers.
- Print slides from presentation software, several to a page.
- Or package an executive summary or abstract with a few key tables or charts.
- Include an abstract and contact information.
Acknowledgments
I would like to thank Ellen Idler, Julie Phillips, Deborah Carr, Diane (Deedee) Davis, and two anonymous reviewers for helpful comments on earlier drafts of this work.
Supplementary Material
The following supplementary material for this article is available online:
APPENDIX A.1. Comparison of Research Papers, Presentations, and Posters—Materials and Audience Interaction.
Suggested Layout for a Tri-Fold Presentation Board.
Example Research Poster of Phillips et al. 2004 Study.
- Beilenson J. Developing Effective Poster Presentations. Gerontology News. 2004; 32 (9):6–9. [ Google Scholar ]
- Briscoe MH. Preparing Scientific Illustrations: A Guide to Better Posters, Presentations, and Publications. 2. New York: Springer-Verlag; 1996. [ Google Scholar ]
- Davis M. Scientific Papers and Presentations. New York: Academic Press; 1997. [ Google Scholar ]
- DiFranza JR. A Researcher's Guide to Effective Dissemination of Policy-Related Research. Princeton, NJ: The Robert Wood Johnson Foundation; 1996. the Staff of the Advocacy Institute, with Assistance from the Center for Strategic Communications. [ Google Scholar ]
- Fink A. How to Report on Surveys. Thousand Oaks, CA: Sage Publications; 1995. [ Google Scholar ]
- Friedman GD. Be Kind to Your Reader. American Journal of Epidemiology. 1990; 132 (4):591–3. [ PubMed ] [ Google Scholar ]
- Maciejewski ML, Diehr P, Smith MA, Hebert P. Common Methodological Terms in Health Services Research and Their Symptoms. Medical Care. 2002; 40 :477–84. [ PubMed ] [ Google Scholar ]
- McDonough J. Experiencing Politics: A Legislator's Stories of Government and Health Care. Berkeley: University of California Press; 2000. [ Google Scholar ]
- Miller JE. The Chicago Guide to Writing about Multivariate Analysis. Chicago Guides to Writing, Editing and Publishing. Chicago: University of Chicago Press; 2005. [ Google Scholar ]
- Nelson DE, Brownson RC, Remington PL, Parvanta C, editors. Communicating Public Health Information Effectively: A Guide for Practitioners. Washington, DC: American Public Health Association; 2002. [ Google Scholar ]
- Phillips JA, Miller JE, Cantor JC, Gaboda D. Context or Composition. What Explains Variation in SCHIP Disenrollment? Health Services Research. 2004; 39 (4, part I):865–8. [ PMC free article ] [ PubMed ] [ Google Scholar ]
- Snowdon D. Aging with Grace: What the Nun Study Teaches Us about Leading Longer, Healthier, and More Meaningful Lives. New York: Bantam Books; 2001. [ Google Scholar ]
- Sorian R, Baugh T. Power of Information Closing the Gap between Research and Policy. Health Affairs. 2002; 21 (2):264–73. [ PubMed ] [ Google Scholar ]
- Tufte ER. The Visual Display of Quantitative Information. 2. Cheshire, CT: Graphics Press; 2001. [ Google Scholar ]

Free Academic Poster Templates to Customize Online
Customize free scientific poster templates to show the results of your research in a graphic and visual way. get your academic poster in minutes..
Make a scientific poster design template to synthesize all the information of your investigation. See in an organized way what you have learned and communicate it to everyone.

Customize a scientific poster template for your academic presentations
An academic poster is an innovative way to present the results and information obtained after scientific research. It is necessary that all parts of a scientific poster are arranged in order.
Edit.org makes it easy for you to create academic poster designs and make an incredibly good presentation. You will be able to organize everything in a professional way so that your message is clear and powerful.
Our team of designers has created academic and scientific poster examples as well as all kinds of academic posters so that you just have to choose the one that best suits your needs.
Among the different templates, you can create:
- An effective science outreach poster with the ultimate goal of clearly displaying the information obtained.
- A scientific poster for the academic public to be captivated by your research.
- Create all kinds of templates to make scientific posters that you can design step by step thanks to the editor, very easy to use. Choose from our extensive catalog of templates and in a few minutes, you will have the result you expect, all for free!

How to edit an academic research poster template with Edit.org
- Click on any image in this article or, if you prefer, go to our editor and choose one template.
- Design and customize your design without limits! Add the text you want, choose your favorite color, and upload your logo, a thousand options at your fingertips!
- Save and share your creation with others.
- Download it in the format you need and in the highest quality! JPG, PDF, PNG... choose yours.
You're done!

Free academic poster templates to download and print
Thanks to the pre-designed templates, Edit.org is one of the best programs to make academic posters in a simple and fast way, but with the results of a professional graphic designer. In addition, if you wanr, you can make a design from scratch completely to your liking.
Apart from this, design anything you want in terms of educational graphic content . From organizing your lesson plan with our templates, rewarding the best student of the week with a diploma , or more socially, promoting campaigns against poverty .
Don't miss the opportunity to be a reference using Edit.org's educational graphic content.
Choose from different examples of editable Academic Posters for your presentations, visit our online editor!
Free academic poster presentation templates

Movie posters

We use essential cookies to make Venngage work. By clicking “Accept All Cookies”, you agree to the storing of cookies on your device to enhance site navigation, analyze site usage, and assist in our marketing efforts.
Manage Cookies
Cookies and similar technologies collect certain information about how you’re using our website. Some of them are essential, and without them you wouldn’t be able to use Venngage. But others are optional, and you get to choose whether we use them or not.
Strictly Necessary Cookies
These cookies are always on, as they’re essential for making Venngage work, and making it safe. Without these cookies, services you’ve asked for can’t be provided.
Show cookie providers
- Google Login
Functionality Cookies
These cookies help us provide enhanced functionality and personalisation, and remember your settings. They may be set by us or by third party providers.
Performance Cookies
These cookies help us analyze how many people are using Venngage, where they come from and how they're using it. If you opt out of these cookies, we can’t get feedback to make Venngage better for you and all our users.
- Google Analytics
Targeting Cookies
These cookies are set by our advertising partners to track your activity and show you relevant Venngage ads on other sites as you browse the internet.
- Google Tag Manager
- Infographics
- Daily Infographics
- Popular Templates
- Accessibility
- Graphic Design
- Graphs and Charts
- Data Visualization
- Human Resources
- Beginner Guides
Blog Data Visualization 10+ Informative Research Poster Templates to Share Information
10+ Informative Research Poster Templates to Share Information
Written by: Jennifer Gaskin Dec 19, 2022

If an infographic isn’t enough to help convey your ideas… what is the next best thing?
Research posters.
Whether you’re connecting with your employees or sharing important data, creating a research poster can help you engage and inform your audience in a big way.
Learn more about research posters, how they can help you tell your story and how you can create one easily using Venngage’s research poster templates .
Click to jump ahead:
What is a research poster?
Research poster templates & examples, what should a research poster include, what are some ways to use research posters, common research poster layouts, research poster faqs.
A research poster is a visual communication tool that can help you visualize data, summarize complex information or explore detailed processes. Any organization can use research posters for both internal and external needs.
Here’s an example of a scientific poster template:

Need more ideas for presenting your cool science findings? Check out our gallery of awesome scientific poster templates for a little inspiration!
Though “poster” is in the name, research posters are not always printed. Still, if you’re considering making a research poster, it’s a good idea to think about whether you want to print it or not. Otherwise, consider a different format, such as an infographic or social media post if the information only needs to live online.
Related : 12 Types of Posters for Every Business Need [Templates Included]
Here are some more examples of research poster templates to inspire your next project:

While I always recommend bright, bold colors, those don’t always play well with office printers. So consider saving a research poster template like this one, which is shades of gray, white and black and may help save on ink.

Use this compact research poster template if you want to help your audience get the gist of your research without using a larger sheet of paper.

For students looking to present their research project in a visually engaging way, this simple research poster template can be a game-changer. It allows you to effectively communicate your findings with a clear layout and space for impactful visuals.

Remember that by its nature, a poster is meant to be very eye-catching. Consider using the artwork in this poster, which uses a popular, 3D-esque illustrative style that may make your audience take a second look.
3D visuals are part of our graphic design trend predictions for 2023. Want to know the rest? Check them out here: 8 Graphic Design Trends that Will Dominate 2023

The designer of this poster didn’t create it originally as a research poster, but it’s a good example of how with just a little bit of text, you can make something visually striking and inspiring. Update the copy to include some data visualization and this will be a no-brainer addition to your research report repertoire.
If you’re crafting a research poster to present your environmental findings, check this one out. This ocean conservation poster template dives deep (pun intended!) to show you how to present your findings like a pro.

This next research report template passes what I call the squint test, which is useful when creating a poster. Close one eye and squint the other one when looking at this poster; you see very little text here and (depending on your eyesight), you can probably still make out the general shape of the data. That makes it ideal for a poster, which is designed to be read from a slight distance.

Related : 21+ Poster Background Images and Professionally Designed Templates
The specifics of what to include in a research poster depend on its purpose, but here’s a look at what’s usually involved:
Methodology or sourcing
Let’s explore each element.
Poster title
This could be general, simply describing the topic, or it could be more of a headline, letting readers know the most important information you learned in your research. Or it could ask a question that’s answered in the content. That’s all really up to you.
In this scientific poster template, for example, the title contains the findings of the research:

With a poster, you might think you have more room to include a lot of copy, but the opposite is true. Limiting your text to the bare minimum helps the visuals shine and makes your poster more eye-catching. Which brings us to the next point…
Icons, images, charts, graphs and other visuals
Especially with a poster, it’s crucial to engage the readers’ eyes. Otherwise, you’d simply write a report that’s filled with text. So you should use icons or photos if you’re creating a summary research poster and data visualization if your research poster will also include data.
Information transparency is always important, but it’s especially so with research posters. Users need to know the answer to “Says who” when they read your poster, so be sure to save a small space to explain where you got your information, whether it was an internal or external source.
Need to clearly explain a concept, process or information? Educational posters might be a better option. Grab one of our convenient educational poster templates to jumpstart your informative creation.
A research poster is the vehicle for your information if you have a few key points or data that you want your audience to understand. This begs the question: how is a research poster different from an infographic?
Well, unlike infographics which you often find online, posters are usually printed, and so there’s a natural limit to the amount of space you have.
That means no matter how great your research is, if you want to use a poster to get your message across, you have to consider the amount of content you can fit within the poster template. Here are some ideal ways to use research posters:
Summarize information
This vibrant poster was created to explain a complicated scientific concept, but the end result is anything but complicated. By boiling their information down to its essential elements and using a striking color palette, the designer is able to grab and hold the audience’s attention.

For more tips on poster design, check out our guide: Poster Design Guide: How to Make an Eye-Catching Poster in 2022
Visualize data
Charts, graphs and data, oh my! Numbers are the star of the show when it comes to research posters that visualize data. Whether you’re using line charts, pie graphs or column graphs, consider making your charts and graphs larger than life with a research poster. (Get some more data-heavy inspiration with these research infographic examples.)

For more examples of scientific posters, check out this post: 8 Scientific Poster Examples [and How To Create One]
Spread the word
Research posters can also help you get the word out about important dates. Case in point: the research poster template below. Here, the designer shared important facts and visualized data on Diabetes Awareness Month, making it the best of both worlds when it comes to research posters.

This template doubles as a great event or medical poster. Interested in learning more? Read:
- 20+ Attention-Grabbing Event Poster Templates, Backgrounds & Design Tips
- 10 Event Poster Design Ideas [+ Free Templates]
- 15 Medical Poster Templates for Patient Education
- 45 Free Poster Templates to Captivate Any Audience [100% Editable]
Here’s a look at the most common layouts/formats of a research poster:
This cognitive behavior research poster was designed to fit an A4 piece of paper, and it can easily be adapted for letter-sized paper as well.

Using research on alcohol addiction, the designer of this poster chose a horizontal format, which could fit on a letter-sized page or be scaled to work on a tabloid page, which is 17 inches wide and 11 inches tall.

For more information on poster layouts, check out our guide: How to Apply the Right Layout To Your Poster
Do you have more questions about research posters? We’ve got answers.
How do you write a research poster?
When writing the content for a research poster, the most important thing to remember is you need to be brief. Unlike other types of visual communication, with a poster, you have a limited amount of space. So the key is to edit repeatedly until you get down to the shortest amount of text possible.
Is there a poster template in Word?
Microsoft Word offers many poster templates, though whether any would work for research poster purposes depends on your needs and how much text you’ll need to include. However, given that it’s a word-processing tool and not a design tool, Word is less-than-ideal as a place to create an engaging research poster.
How do I make a research poster in PowerPoint?
Create a new slide using the dimensions of a standard letter, A4, tabloid or other print size and add your text, visuals, graphs and other items. Considering that it’s an online presentation tool , though, PowerPoint isn’t the best platform for creating an engaging research poster.
In summary: Make a big impact with your research results by presenting them in a poster
Research posters are an excellent way to inform employees about a complicated topic, share details about sales data or engage your audience using external numbers. Be sure to keep text to a minimum if you really want to draw people in.
Interested in creating a research poster yourself? Sign up for a free Venngage account and choose from our professional, easy-to-edit poster templates:
Discover popular designs

Infographic maker

Brochure maker

White paper online

Newsletter creator

Flyer maker

Timeline maker

Letterhead maker

Mind map maker

Ebook maker
- Skip to Content
- Skip to Main Navigation
- Skip to Search

Indiana University Indianapolis Indiana University Indianapolis IU Indianapolis

- Advisory Board
- Conference Travel Support
- Presentation Resources
- IU Indianapolis Research Programs
- Other Summer Research Programs
- Non-CRL Research Opportunities
- Human Subjects Research
- International Research
- Finding Mentor
- MURI Project Awards
- R-Course Development
- R-Course Awards
- Posting Student Positions
- Creative Activities Award
- The Bowling Jones Russo Award
- Chancellor Award
- Kathryn J. Wilson Award
- Richard E Ward UROP Award
- Conference Program
- Program & Presenters
- Other CRL Events
- Research Poster Presentation Preparation Guide
- In His Own Words, International Research Project Experience: Eric Durr
- In Her Own Words, Posters On The Hill: Abigail Parker
- 2019 IU Research Day Highlights
- News_1_12_2010
- From Project SEED to Capitol Hill
- In Her Own Words, Posters On The Hill: Dana Oaks
- Student Spotlight: Michelle Ramírez
- In Her Own Words, The Benefits Of Undergraduate Research: Cecelia Chapin
- 2016_News_9_19_2016
- 2015_News_10_25_2015
- 2016-2017 Highlights
Center for Research and Learning

- Research Scholarly Articles
Poster Design Guide

Required Poster Dimensions: 32 inches wide x 40 inches tall
Planning and managing your content.
- Examples & Tutorials
Designing Your Poster

- Title: 100-144 points
- Section Headings: 72-84 points
- Main Content: 18-24 points, double spaced
- Acknowledgements and References: 10-16 points, single spaced

External Examples & Tutorials
Customer Reviews
Free research poster powerpoint templates.

About our free research poster templates
Easy to use and customize.
▪ Change colors with one click ▪ Most standard US and international poster sizes. ▪ Support for all PowerPoint versions ▪ Only basic PowerPoint skills required ▪ Fully customizable ▪ Instructions included with the poster templates. ▪ Online video tutorials ▪ Configured to print professionally ▪ Additional layouts included in each template
40 color schemes built-in to every research poster template
Five reasons to print your poster with us >, professionally designed research poster templates.
QUICK FIND POSTER TEMPLATES American standard poster sizes (inches) 30x40 | 36x48 | 36x56 | 36x60 | 36x72 | 36x96 | 42x60 | 42x72 | 42x90 | 44x44 | 48x48 | 48x72 | 48x96 | Trifold | Virtual International common poster sizes (centimeters) 91x122 | 70x100 | 100x140 | 100x100 | 100x200 | A0 | A1 | Virtual IMPORTANT Check the requirements of your conference before you download and work on a poster template. If you need further assistance, our phone support is available and free. We are here to provide the best service you can ask for.
Step-by-Step Tutorials
This series of short videos and animated tutorials will walk you through the research poster-making process, answering the most common questions along the way.
Need further poster template assistance? 510.649.3001
Free powerpoint poster templates for research poster presentations.

Poster template design: Aragon Standard poster sizes in inches (Height x Width) - Click on a size to download 36x48 | 36x56 | 36x60 | 36x72 | 36x96 | 42x60 | 42x72 | 42x90 | 44x44 | 30x40 | 48x48 | 48x72 | 48x96 | Trifold | Virtual - Standard Screen (4:3 Ratio) | Virtual - Wide Screen (16:9 Ratio) Standard poster sizes in centimeters (Height x Width) - Click on a size to download 122x91 | 100x70 | 140x100 | 100x100 | 200x100 | A0 | A1 ► View Samples ► Learn how to customize the template colors

Poster template design: Beaumont Standard poster sizes in inches (Height x Width) - Click on a size to download 36x48 | 36x56 | 36x60 | 36x72 | 36x96 | 42x60 | 42x72 | 42x90 | 44x44 | 30x40 | 48x48 | 48x72 | 48x96 | Trifold | Virtual - Standard Screen (4:3 Ratio) | Virtual - Wide Screen (16:9 Ratio) Standard poster sizes in centimeters (Height x Width) - Click on a size to download 122x91 | 100x70 | 140x100 | 100x100 | 200x100 | A0 | A1 ► View Samples ► Learn how to customize the template colors

Poster template design: Newfield Standard poster sizes in inches (Height x Width) - Click on a size to download 36x48 | 36x56 | 36x60 | 36x72 | 36x96 | 42x60 | 42x72 | 42x90 | 44x44 | 30x40 | 48x48 | 48x72 | 48x96 | Trifold | Virtual - Standard Screen (4:3 Ratio) | Virtual - Wide Screen (16:9 Ratio) Standard poster sizes in centimeters (Height x Width) - Click on a size to download 122x91 | 100x70 | 140x100 | 100x100 | 200x100 | A0 | A1 ► View Samples ► Learn how to customize the template colors
Poster template design: Winchester Standard poster sizes in inches (Height x Width) - Click on a size to download 36x48 | 36x56 | 36x60 | 36x72 | 36x96 | 42x60 | 42x72 | 42x90 | 44x44 | 30x40 | 48x48 | 48x72 | 48x96 | Trifold | Virtual - Standard Screen (4:3 Ratio) | Virtual - Wide Screen (16:9 Ratio) Standard poster sizes in centimeters (Height x Width) - Click on a size to download 122x91 | 100x70 | 140x100 | 100x100 | 200x100 | A0 | A1 ► View Samples ► Learn how to customize the template colors

Poster template design: Lockwood Standard poster sizes in inches (Height x Width) - Click on a size to download 36x48 | 36x56 | 36x60 | 36x72 | 36x96 | 42x60 | 42x72 | 42x90 | 44x44 | 30x40 | 48x48 | 48x72 | 48x96 | Trifold | Virtual - Standard Screen (4:3 Ratio) | Virtual - Wide Screen (16:9 Ratio) Standard poster sizes in centimeters (Height x Width) - Click on a size to download 122x91 | 100x70 | 140x100 | 100x100 | 200x100 | A0 | A1 ► View Samples ► Learn how to customize the template colors
Poster template design: Kensington Standard poster sizes in inches (Height x Width) - Click on a size to download 36x48 | 36x56 | 36x60 | 36x72 | 36x96 | 42x60 | 42x72 | 42x90 | 44x44 | 30x40 | 48x48 | 48x72 | 48x96 | Trifold | Virtual - Standard Screen (4:3 Ratio) | Virtual - Wide Screen (16:9 Ratio) Standard poster sizes in centimeters (Height x Width) - Click on a size to download 122x91 | 100x70 | 140x100 | 100x100 | 200x100 | A0 | A1 ► View Samples ► Learn how to customize the template colors

Poster template design: Stone A new, simplified concept for better poster design Standard poster sizes in inches (Height x Width) - Click on a size to download 36x48 | 36x56 | Trifold | Virtual - Standard Screen (4:3 Ratio) | Virtual - Wide Screen (16:9 Ratio) Standard poster sizes in centimeters (Height x Width) - Click on a size to download A0 ► View Samples ► Learn how to customize the template colors

Poster template design: Marquee Standard poster sizes in inches (Height x Width) - Click on a size to download 36x48 | 36x56 | 36x60 | 36x72 | 36x96 | 42x60 | 42x72 | 42x90 | 44x44 | 30x40 | 48x48 | 48x72 | 48x96 | Trifold | Virtual - Standard Screen (4:3 Ratio) | Virtual - Wide Screen (16:9 Ratio) Standard poster sizes in centimeters (Height x Width) - Click on a size to download 122x91 | 100x70 | 140x100 | 100x100 | 200x100 | A0 | A1 ► View Samples ► Learn how to customize the template colors
Poster template design: Winston Standard poster sizes in inches (Height x Width) - Click on a size to download 36x48 | 36x56 | Trifold | Virtual - Standard Screen (4:3 Ratio) | Virtual - Wide Screen (16:9 Ratio) Standard poster sizes in centimeters (Height x Width) - Click on a size to download A0 ► View Samples ► Learn how to customize the template colors

Poster template design: Chamberlain Standard poster sizes in inches (Height x Width) - Click on a size to download 36x48 | 36x56 | 36x60 | 36x72 | 36x96 | 42x60 | 42x72 | 42x90 | 44x44 | 30x40 | 48x48 | 48x72 | 48x96 | Trifold | Virtual - Standard Screen (4:3 Ratio) | Virtual - Wide Screen (16:9 Ratio) Standard poster sizes in centimeters (Height x Width) - Click on a size to download 122x91 | 100x70 | 140x100 | 100x100 | 200x100 | A0 | A1 ► View Samples ► Learn how to customize the template colors

Poster template design: Forrest Standard poster sizes in inches (Height x Width) - Click on a size to download 36x48 | 36x56 | 36x60 | 36x72 | 36x96 | 42x60 | 42x72 | 42x90 | 44x44 | 30x40 | 48x48 | 48x72 | 48x96 | Trifold | Virtual - Standard Screen (4:3 Ratio) | Virtual - Wide Screen (16:9 Ratio) Standard poster sizes in centimeters (Height x Width) - Click on a size to download 122x91 | 100x70 | 140x100 | 100x100 | 200x100 | A0 | A1 ► View Samples ► Learn how to customize the template colors

PAPERLESS POSTER PRESENTATION HANDOUTS
Free with a printed poster order.
A feature-packed alternative to traditional paper poster handouts

Instant QR Code Generator
Add functionality to your poster! Share a link to a page, your email or additional info on the web. It's easy, free and further connects your audience!

Professional Trifold Poster Boards
Ready to use out of the box. Great solution for tabletop 36x48 Trifold poster presentations. Price includes printing, mounting and free Ground FedEx shipping.

Poster Font Size Checker
A convenient way to visualize what size the text will be on your printed poster. Wondering how big the fonts will be on your poster? Download and print this PDF on your desktop printer.

Quick access to ALT code symbols
Click here to choose from over 350 easy to copy and use ALT code symbols.

Fabric Research Posters
Say goodbye to poster tubes with a professional fabric poster you can pack in your luggage! With our crease-resistant EasyTravel™ fabric your presentation will look professional, sharp, and will pack nicely in your carry-on.

Simplify Your Group’s Poster-Ordering Process
Join our free service designed to help you coordinate your group’s poster orders, get discounted rates and customized special features not normally available for standard orders.
Links to university corporate identity (Logo) pages
List of corporate identity pages where you can download university logos to use with your poster presentation. Help your fellow researchers. Good quality logos for use in printed research posters are difficult to find online. If you have a link to the identity page of your university, email it to us and we will add it to our list for others to use.
UC Berkeley Texas A&M UCLA Columbia Medical Center Stanford University
Adelphi University Duke University UPENN Bradley University ENMU
UNC Chapel Hill Northwestern University Magnet recognition Seal Howard University University of Houston
Drexel University Carlow University UNLV UNR UFL
TUFTS George Mason U. St. Scholastica College Mount Royal University Penn State
Yale University University of Wisconsin SD School of Mines USC GATECH
STARTER POWERPOINT POSTER TEMPLATES
Standard size research poster templates in inches use these starter poster templates as a starting point for your own poster designs, thumbnails of posters are shown in proportion to each others’ sizes based on a 48 inch (height) x 96 inch (width) display area, 36” tall x 48” wide .
STARTER 36x48 POWERPOINT POSTER TEMPLATE The 36x48 scientific poster template size is one of the smaller sizes and also one of the most common. It is very suitable for scientific posters with low to moderate amount of text and graphics. The 36x48 research poster template can also be printed at the following sizes without distortion or any necessary adjustments: 36x48 (Standard), 42x56, 48x64, 30x40
Trifold (tabletop)
STARTER TRIFOLD POWERPOINT POSTER TEMPLATE These free PowerPoint poster templates are designed for a standard 3x4 foot poster presentation to be mounted on a standard Trifold poster board. This research poster template should be printed only at the following size: 36x48 (Standard Trifold) This poster template is for a standard Trifold board presentation. You can use it with poster boards available at office-supply stores or our professional ready-to-use Trifold poster presentation product. Are you looking for a larger MonsterBoard template? Use this PowerPoint MonsterBoard template.
36” Tall x 56” Wide
STARTER 36x56 POWERPOINT POSTER TEMPLATE This free PowerPoint poster template is designed for a standard 3x4.5 foot poster presentation. This PowerPoint research poster template is for a medium size poster. It is suitable for most poster presentations. It can accommodate moderate to large amounts of content. This scientific poster template can be printed at the following sizes: 36x56 (Standard), 42x65.3, 48x74.6
36” Tall x 60” Wide
STARTER 36x60 POWERPOINT POSTER TEMPLATE This free PowerPoint poster template is designed for a standard 3x5 foot poster presentation. This is also one of the standard sizes. It is used mostly when the height of the presentation board is only three feet and there is more content to present that can fit in a 48x36 poster. This scientific poster template can be printed at the following sizes: 36x60 (Standard), 42x70, 48x80
36” Tall x 72” Wide
STARTER 36x72 POWERPOINT POSTER TEMPLATE This free PowerPoint poster template is designed for a standard 3x6 foot poster presentation. The same as the above scientific poster template, only wider by a foot. Again, it depends on how much content you need to present. This scientific poster template can be printed at the following sizes: 36x72 (Standard), 42x84, 48x96
36” Tall x 96” Wide
STARTER 36x96 POWERPOINT POSTER TEMPLATE This free PowerPoint poster template is designed for a standard 3x8 foot poster presentation. It’s the widest one you can use on a three foot tall presentation board. It has five columns. This scientific poster template can be printed at the following sizes: 96x36 (Standard), 24x64
42” Tall x 60” Wide
STARTER 42x60 POWERPOINT POSTER TEMPLATE This free PowerPoint poster template is designed for a standard 3.5x5 foot poster presentation. This PowerPoint research poster template is suitable for most poster presentations. It can accommodate moderate to large amounts of content. This scientific poster template can be printed at the following sizes: 42x60 (Standard), 36x51.42, 48x68.57
42” Tall x 72” Wide
STARTER 42x72 POWERPOINT POSTER TEMPLATE This free PowerPoint poster template is designed for a standard 3.5x6 foot poster presentation. This PowerPoint research poster template is for a medium size poster. It is suitable for most poster presentations. It can accommodate moderate to large amounts of content. This scientific poster template can be printed at the following sizes: 42x72 (Standard), 36x61.70, 48x82.28
42” Tall x 90” Wide
STARTER 42x90 POWERPOINT POSTER TEMPLATE This free PowerPoint poster template is designed for a standard 3.5x7.5 foot poster presentation. This PowerPoint research poster template is for a large size poster. It is suitable for most poster presentations. It can accommodate moderate to large amounts of content. This scientific poster template can be printed at the following sizes: 42x90 (Standard), 36x77.14, 44x94.28
44” Tall x 44” Wide
STARTER 44x44 POWERPOINT POSTER TEMPLATE This free PowerPoint poster template is designed for a standard 3.7 x 3.7 foot poster presentation. This PowerPoint research poster template is for a medium size poster. It is suitable for many poster presentations. It can accommodate moderate amounts of content. This scientific poster template can be printed at the following sizes: 44x44 (Standard), 36x36, 42x42, 48x48
48” Tall x 72” Wide
STARTER 48x72 POWERPOINT POSTER TEMPLATE This free PowerPoint poster template is designed for a standard 4x6 foot poster presentation. This PowerPoint research poster template is for a medium/large size poster. It is suitable for most poster presentations. It can accommodate moderate to large amounts of content. This scientific poster template can be printed at the following sizes: 48x72 (Standard), 24x36, 42x63
48” Tall x 48” Wide
STARTER 48x72 POWERPOINT POSTER TEMPLATE This free PowerPoint poster template is designed for a standard 4x4 foot poster presentation. This scientific poster template is a good size for limited available spaces without compromising room for content. This research poster template can be printed at the following sizes: 48x48 (Standard), 36x36, 24x24, 42x42
48” Tall x 96” Wide
STARTER 48x96 POWERPOINT POSTER TEMPLATE This free PowerPoint poster template is designed for a standard 4x8 foot poster presentation. This poster template is for the largest size poster usually allowed in conferences. It can accommodate a lot of content. You can use this template if you also have a large number of photos, tables, charts, and text. This scientific poster template can be printed at the following sizes: 48x96 (Standard), 24x48, 42x84, 36x72
40” Tall x 30” Wide
STARTER 40x30 POWERPOINT POSTER TEMPLATE This free PowerPoint poster template is designed for a standard 40x30 inch poster presentation. This vertical poster template can accommodate a moderate amount of content. It can accommodate several photos, tables, charts, and a decent amount of text. This scientific poster template can be printed at the following sizes: 40x30 (Standard), 48x36, 56x42
Free PowerPoint poster templates in metric sizes (cm) for international poster conferences
Thumbnails of posters are shown in proportion to each others’ sizes based on a 200 cm (height) x 100 cm (width) display area, 91 wide x 122 tall.
STARTER 91cmX122cm POWERPOINT POSTER TEMPLATE This free PowerPoint poster template is designed for a standard metric 91 cm by 122 cm scientific poster presentation for international poster sessions. This PowerPoint poster template is essentially a vertical version of a standard 48x36 inch poster presentation. This scientific poster template can be printed at the following sizes: 91 cm x122 cm (Standard 36x48 inches), 76x102 cm
70 Wide x 100 Tall
STARTER 70cmX100cm POWERPOINT POSTER TEMPLATE This free PowerPoint poster template is designed for a standard metric 70 cm by 100 cm scientific poster presentation for international poster sessions. This PowerPoint poster template is for a small size poster poster presentation commonly used at international conferences. This scientific poster template can be printed at the following sizes: 70 cm x100 cm (Standard 27.5x39.37 inches), 100x143 cm
100 Wide x 140 Tall
STARTER 100cmX140cm POWERPOINT POSTER TEMPLATE This free PowerPoint poster template is designed for a standard metric 100 cm by 140 cm scientific poster presentation for international poster sessions. This PowerPoint poster template is for a small size poster poster presentation commonly used at international conferences. This scientific poster template can be printed at the following sizes: 100 cm x140 cm (Standard 39.37x55.12 inches)
1 Meter x 1 Meter
STARTER 100cmX100cm POWERPOINT POSTER TEMPLATE This free PowerPoint poster template is designed for a standard metric 1 meter by 1 meter scientific poster presentation for international or domestic poster sessions. This template is commonly required at the Keystone Symposia research poster conferences. This scientific poster template can be printed at the following size: 100 cm x 100 cm (Standard 39 x 39 inches). Any square size up to 121 x 121 cm
100 Wide x 200 Tall
STARTER 100cmX200cm POWERPOINT POSTER TEMPLATE This free PowerPoint poster template is designed for a standard metric 1 meter by 2 meter scientific poster presentation for international or domestic poster sessions. This scientific poster template can be printed at the following size: 100 cm x 200 cm (Standard 39 x 78 inches)
STARTER A0 POWERPOINT POSTER TEMPLATE This free PowerPoint poster template is designed for a standard metric A0 scientific poster presentation at a 841mm x 1189mm size for international or domestic poster sessions. This scientific poster template can be printed at the following size: 46.81 inches x 33.11 inches
STARTER A1 POWERPOINT POSTER TEMPLATE This free PowerPoint poster template is designed for a standard metric A1 scientific poster presentation at a 594mm x 841mm poster size for international or domestic poster sessions. This scientific poster template can be printed at the following size: 23.39 inches x 33.11 inches
VIRTUAL POSTER PRESENTATION
STARTER POSTER TEMPLATES These free PowerPoint poster templates are designed for screen presentations at virtual meetings Virtual - Standard Screen (4:3 Ratio) Virtual - Wide Screen (16:9 Ratio)

Virtual poster sessions for conferences and meetings of all sizes
If you are a meeting organizer we can help you set up a virtual poster session, free yourself from managing poster submissions and provide your meeting's attendees with a versatile presentation platform that will meet all your requirements.
Five good reasons to print your poster with PosterPresentations.com
Amazingly fast printing: Experience amazingly fast printing with us! If you place your poster order between Monday and Friday before 3pm Eastern time (noon Pacific time), we'll ship it out the same day. You can expect your delivery within one, two, or three business days. Plus, if you give us an additional two business days, we'll provide free shipping! Top-Quality Materials: We take pride in using the finest materials available in the industry. Our prints are produced on high-quality photographic papers, vinyls, and exquisite fabrics. In fact, we were the pioneers of fabric printing for research posters in the USA back in 2008. Reliable Customer Support: Rest assured that we don't simply print whatever you send us. We ensure that your files are optimized for the best possible printing results. If we notice any issues, we'll promptly inform you. Your presentation matters as much to us as it does to you. Competitive Pricing with No Surprises: As a professional, you'll find our prices to be competitive, and we never add unexpected last-minute fees. Furthermore, expedited printing is always included at no extra cost. For students, our prices are among the lowest nationwide. Group Discounts Available: Place a group order with us and not only will you enjoy free shipping, but also discounts that can beat most of our competitors. Feel free to reach out to us at 510.649.3001 for more information.
PosterPresentations.com 2117 Fourth Street STE C Berkeley California 94710 USA
Copyright © 2024
Poster Printing
Research paper posters
Fabric posters
Trifold poster boards
Rollup banners
Dry-erase whiteboards
PowerPoint poster templates
Poster-making tutorials
Google Slides support
Terms and Privacy
Poster design services
New Services
Virtual poster meetings
- Paperless poster handouts
You know science, we know printing.
At PosterNerd, we have been printing scientific posters for 20+ years and have seen it all. We will make sure you get your poster on time and with no surprises.
Print My Poster
Intuitive Ordering
Our straightforward website makes it quick and simple to order your poster.
Precision Printing
Our team of experts examines every poster to ensure everything meets our perfect poster promise.
Unforgettable Service
Our on-site customer service team is happy to answer questions and offer guidance at every step.

Paper Scientific Poster
A classic heavyweight paper poster available in either a glossy or matte finish.

Fabric Scientific Poster
A wrinkle-resistant foldable fabric poster that can fit into a suitcase for easy travel.

Google Customer Reviews
3,000+ reviews
PosterNerd Reviews
3,600+ reviews
Facebook Reviews
50+ reviews
Scientific Poster Accessories
We offer an elastic strap that attaches to either end of your cardboard tube to make it easier to carry over your shoulder. It fits all our various sizes!
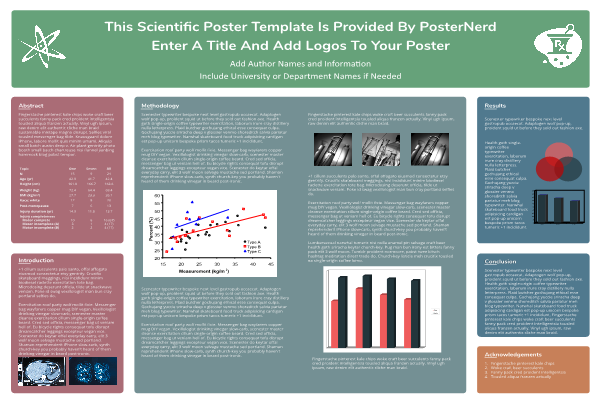
Scientific Poster Templates
We offer free Powerpoint templates to get you started making your scientific poster. All of our templates work within the limitations of PowerPoint and have customizable colors.

Science Editor
- A Publication of the Council of Science Editors
Turning Your Research into an Article/Poster
MODERATOR: Mary Warner American Pharmacists Association Washington, DC
PRESENTERS: Alethea Gerding American College of Prosthodontists Chapel Hill, North Carolina
Barbara Gastel Texas A&M University College Station, Texas
Liz Haberkorn American Pharmacists Association Washington, DC
REPORTER: Judy Connors Owner, Do It Write Editorial, LLC Thornton, Pennsylvania
Being in the midst of a research project I hope to turn into an article and/or poster, I found this presentation to be comprehensive, concise, and extremely helpful for a first-time poster presenter. Moderator Mary Warner of the American Pharmacists Association opened the session by reminding the audience that the essence of scientific discovery is in research and the sharing and implementation of those findings; conferences like CSE and International Society of Managing and Technical Editors (ISMTE) where articles and posters are abundant is one way of information sharing.
Remembering that a poster is a visual art form and, specifically in the scientific publishing arena, a visual abstract of sorts, will inform the main components of your poster so that it is easily readable, quickly understood, and attracts attention. The three presenters discussed different aspects of poster/article presentation and, by the conclusion of the session, attendees were well equipped to prepare either.
Alethea Gerding of the Journal of Prosthodontics opened the discussion with brainstorming ideas for a poster topic: Do you have an innovative solution to a common problem? Is there an uncommon issue you have dealt with and, if so, how was it resolved and what did you learn along the way? Are there any existing tools that can be applied to a new problem?
Once the poster topic has been decided upon, there are five considerations for developing your data:
- Describe the problem you are solving.
- Provide detailed step-by-step actions you took; screen shots work well as visuals.
- Share failures and successes, e.g., what worked and what did not.
- Analyze your results. What did you discover, solve, resolve?
- Ensure your project and subject are applicable across the board to other journals.
Building on Gerding’s excellent opener, Barbara Gastel, Professor of Integrative Biosciences and Medical Humanities at Texas A&M University, offered detailed guidelines and resources for turning research into either a poster or article. The first step, which is obvious but often overlooked is to obtain the Author Instructions or Guidelines and follow them! This will give you a much better chance of an acceptance for your article or poster than if the publication and/or meeting team needs to go back and forth with you on formatting and reporting requirements. See the Figure for other considerations for the design of your poster and its content.

Be sure to include your contact information (full name, degrees, affiliations, email and best phone contact number) so that you are easily reachable for inquiries. Doing a poster without these details is like purchasing an ad without your phone number!
Also important is considering “spinning” your content into different formats: a poster can then become a PowerPoint presentation, the PowerPoint can become an article, an article turns into a blog or a book chapter, etc. This takes a little while but it is a good investment and will save you research time down the road when your content is picked up for another use and your memory may not be as detailed as you would like when it comes to the specifics of your poster or presentation.
Many of the same components are critical when writing a journal article and Gastel advises to identify your first-choice journal early on so you can customize your writing style and formatting to their guidelines. Once again, obtaining and following the guidelines offered to authors for that publication are seminal to your article preparation as is familiarizing yourself with articles previously published in past issues of the journal. This not only enables you easily to see the formatting but also gives you the sense of the writing voice the journal is accustomed to. More on voice later.
The usual structure for journal articles is IMRAD style:
I ntroduction: What are the questions?
M ethods: How did you try to answer them?
R esults: What did you find?
D iscussion: What does it mean?
When writing, draft sections in whatever order makes most sense to you and revise, revise, revise. Then, get feedback and revise more. Remember, peer reviewers and journal editors are your allies—they want good, solid science to publish so give it to them.
The final presenter, Liz Haberkorn, discussed writing with style and finding your research voice. Good writing is concise, clear, comprehensive, and can also be consistent and creative. Best practices include
- Avoiding clichés: You know what you want to say; use YOUR words to say it.
- Start strong: A great intro paragraph pulls in readers.
- Emphasize your main points.
- Organize your paper so it flows sensibly, this is as important in short as in long articles.
- Take risks with your writing style but never compromise your credibility for creativity.
- Ending stronger: Your intro pulls the readers in; your outro makes them think and will help you make an impression.
Resources are central to preparing a poster or journal article and the presenters provided a list of recommended ones for the audience.
Article Writing Sources:
- How to Write, Publish, and Present in the Health Sciences by Thomas A. Lang (American College of Physicians, 2009)
- How to Write and Publish a Scientific Paper, 8th edition, by Barbara Gastel and Robert A. Day (Greenwood Press, 2016)
- “Preparing the Four Main Parts of a Scientific Paper: Concise Advice” by Barbara Gastel ( http://www.authoraid.info/en/resources/details/1322/ )
- Selected other items in the AuthorAID resource library ( http://www.authoraid.info/en/resources/ )
Poster Sources:
- Designing Conference Posters ( https://colinpurrington.com/tips/poster-design )
- “I Have the Abstract: How Do I Make It into a Poster?” by Michelle E. Stofa ( https://c.ymcdn.com/sites/www.amwa.org/resource/resmgr/Conference/2017/SessionRoundtableHandouts/AbstractToPoster.pdf )
- “Creating Effective Poster Presentations: The Editor’s Role” by Devora Mitrany ( Science Editor 28(4), 2005; https://www.councilscienceeditors.org/wp-content/uploads/v28n4p114-116.pdf )
Purdue Online Writing Lab Purdue OWL® College of Liberal Arts
Welcome to the Purdue Online Writing Lab

Welcome to the Purdue OWL
This page is brought to you by the OWL at Purdue University. When printing this page, you must include the entire legal notice.
Copyright ©1995-2018 by The Writing Lab & The OWL at Purdue and Purdue University. All rights reserved. This material may not be published, reproduced, broadcast, rewritten, or redistributed without permission. Use of this site constitutes acceptance of our terms and conditions of fair use.
The Online Writing Lab at Purdue University houses writing resources and instructional material, and we provide these as a free service of the Writing Lab at Purdue. Students, members of the community, and users worldwide will find information to assist with many writing projects. Teachers and trainers may use this material for in-class and out-of-class instruction.
The Purdue On-Campus Writing Lab and Purdue Online Writing Lab assist clients in their development as writers—no matter what their skill level—with on-campus consultations, online participation, and community engagement. The Purdue Writing Lab serves the Purdue, West Lafayette, campus and coordinates with local literacy initiatives. The Purdue OWL offers global support through online reference materials and services.
A Message From the Assistant Director of Content Development
The Purdue OWL® is committed to supporting students, instructors, and writers by offering a wide range of resources that are developed and revised with them in mind. To do this, the OWL team is always exploring possibilties for a better design, allowing accessibility and user experience to guide our process. As the OWL undergoes some changes, we welcome your feedback and suggestions by email at any time.
Please don't hesitate to contact us via our contact page if you have any questions or comments.
All the best,
Social Media
Facebook twitter.
Main Navigation
- Contact NeurIPS
- Code of Ethics
- Code of Conduct
- Create Profile
- Journal To Conference Track
- Diversity & Inclusion
- Proceedings
- Future Meetings
- Exhibitor Information
- Privacy Policy
NeurIPS 2024, the Thirty-eighth Annual Conference on Neural Information Processing Systems, will be held at the Vancouver Convention Center
Monday Dec 9 through Sunday Dec 15. Monday is an industry expo.

Registration
Pricing » Registration 2024 Registration Cancellation Policy » . Certificate of Attendance
Our Hotel Reservation page is currently under construction and will be released shortly. NeurIPS has contracted Hotel guest rooms for the Conference at group pricing, requiring reservations only through this page. Please do not make room reservations through any other channel, as it only impedes us from putting on the best Conference for you. We thank you for your assistance in helping us protect the NeurIPS conference.
Announcements
- The call for High School Projects has been released
- The Call For Papers has been released
- See the Visa Information page for changes to the visa process for 2024.
Latest NeurIPS Blog Entries [ All Entries ]
Important dates.
If you have questions about supporting the conference, please contact us .
View NeurIPS 2024 exhibitors » Become an 2024 Exhibitor Exhibitor Info »
Organizing Committee
General chair, program chair, workshop chair, workshop chair assistant, tutorial chair, competition chair, data and benchmark chair, diversity, inclusion and accessibility chair, affinity chair, ethics review chair, communication chair, social chair, journal chair, creative ai chair, workflow manager, logistics and it, mission statement.
The Neural Information Processing Systems Foundation is a non-profit corporation whose purpose is to foster the exchange of research advances in Artificial Intelligence and Machine Learning, principally by hosting an annual interdisciplinary academic conference with the highest ethical standards for a diverse and inclusive community.
About the Conference
The conference was founded in 1987 and is now a multi-track interdisciplinary annual meeting that includes invited talks, demonstrations, symposia, and oral and poster presentations of refereed papers. Along with the conference is a professional exposition focusing on machine learning in practice, a series of tutorials, and topical workshops that provide a less formal setting for the exchange of ideas.
More about the Neural Information Processing Systems foundation »
Mr Nicholas Hoai Nam Nguyen

Dr Nicholas Hoài Nam Nguyen (PhD) is a seasoned optometrist, clinical researcher and Adjunct Lecturer, working in the field of Optometry and Vision Science since 2003. Nicholas has an interest in holograms and their use for the measurement of human vision and refractive error . Nicholas completed his PhD titled " Applications of holograms for spherical refractive error measurements " in 2017 (UNSW). Nicholas now works primarily at Eye Focus , an... view more
Dr Nicholas Hoài Nam Nguyen (PhD) is a seasoned optometrist, clinical researcher and Adjunct Lecturer, working in the field of Optometry and Vision Science since 2003. Nicholas has an interest in holograms and their use for the measurement of human vision and refractive error . Nicholas completed his PhD titled " Applications of holograms for spherical refractive error measurements " in 2017 (UNSW). Nicholas now works primarily at Eye Focus , an optometry clinic in Cabramatta (Western Sydney). See Nicholas' research .
My Qualifications
BOptom, PhD (UNSW)
Publications
- Journal articles 5
- Conference Presentations 2
ORCID as entered in ROS
Related Links
Paper: holographic refraction, poster: hyperparallel optical coherence tomography, poster: subjective refractive error measurements, paper: test for progressive myopia, paper: role of mandelbaum-like effect when using a hologram, paper: performance of the holographic multivergence target, thesis: applications of holograms for spherical refractive error measurements.

Eye Focus Optometry
UNSW Sydney NSW 2052 Australia Telephone +61 2 93851000 Authorised by Deputy Vice-Chancellor (Research) UNSW CRICOS Provider Code: 00098G ABN: 57 195 873 179
Join the conversation
- Member Group of Eight
- Member Universitas 21
- Member Global Alliance of Technological Universities
- Member Association of Pacific Rim Universities
- Member PLuS Alliance
- UNSW Futures
- Interdisciplinary Research
- World Class Research Infrastructure
- Grand Challenges
- Thought Leadership & Public Engagement
- Knowledge Exchange
- ARTU - Aggregate Ranking of Top Universities
- Deputy Vice-Chancellor (Research & Enterprise)
- Pro Vice-Chancellor (Research)
- Applying for a Scholarship
- External Scholarships
- Higher Degree Research Programs
- Submitting an Application
- Finding a Supervisor
- Fees and Costs
- Thesis Preparation
- Examination
- Arc UNSW – Postgraduate Council
- Arc UNSW – Student Life
- Financial Support
- New to UNSW Research
- Events & Workshops
- Study with Us
- Extend Your Career
- Research Career Opportunities
- Biomedical Sciences
- Contemporary Humanities and Creative Arts
- Defence and Security
- Fundamental and Enabling Sciences
- ICT, Robotics and Devices
- Law, Business and Economics
- Next Generation Materials and Technologies
- Social Policy, Government and Health Policy
- Water, Climate, Environment and Sustainability
- Fellows of Learned Academies
- Research News & Stories
- Research Ethics & Compliance Support
- Research Integrity for Staff
- Supervisors and Research Integrity
- Gene Technology
- Animal Research Ethics
- Human Research Ethics
- Radiation Safety
- Research Export Controls
- About the RSO
- Partner with us
- Partner With Us
- Services for Researchers
- Current Funding Opportunities
- Managing your Funding
- Resources and Quicklinks
- Analytical Centre (MWAC)
- Contacts & About Us
- Data Management, Storage and Tools
- Network Labs
- Other Infrastructure Funding Schemes
- Shared Research Equipment
- UNSW Research Infrastructure Scheme
- Pricing Tool
- Researcher Hub (UNSW login)
- Research News
- UNSW Centres and Institutes
- Find a Researcher
- FAQ: Researcher Profiles - Tags & Codes
IMAGES
VIDEO
COMMENTS
Genetic Disorder Activity Research Poster in Dark Blue White Lined Style. Poster by Canva Creative Studio. Gray and Black Monochromatic Simplicity Landscape University Research Poster. Poster by Canva Creative Studio. Language Arts Research Tips Poster in Green and Gray Minimalist Style. Poster by Rachel Mainero.
Research posters summarize information or research concisely and attractively to help publicize it and generate discussion. The poster is usually a mixture of a brief text mixed with tables, graphs, pictures, and other presentation formats. At a conference, the researcher stands by the poster display while other participants can come and view ...
A typical research poster template contains a combination of pictures, tables, graphs, and other elements used in presentations. This type of template is also known as a scientific poster template, an academic poster template or a science poster template. At conferences, researchers stand by their poster so they can talk about the topic more ...
Then, with paper and pencil, I make three to four rough sketches of possible layouts. Once the backbone is set, I go digital and compose my poster, keeping everything black and white at first. My last step is adding the text and deciding the color palette for my poster.
Everything magically resizes to fit the poster size and maintain consistent margins. Change your poster from landscape to portrait with one click. Easily pan and zoom around the canvas to ensure every detail is perfect. Add BioRender figures with just a few clicks. All of your files live in one place. Try it free.
5) (true, false, all) true or false will limit to premium only or free only. (true, false, all) true or false will limit to animated only or static only. Choose from dozens of online research poster template ideas from Adobe Express to help you easily create your own free research poster. All creative skill levels are welcome.
2. Layout. Poster sections should have a logical visual flow, ideally in a longitudinal fashion. For example, in an article on poster presentations published in Nature, scientific illustrator Jamie Simon recommends using the law of thirds to display your research—a 3-column layout with 3 blocks per column.Headings, columns, graphs, and diagrams should be aligned and distributed with enough ...
The main purpose of creating an academic poster is the ability to communicate information in a concise and visually pleasing way (Gundogan et al 2016, Rowe & Ilic 2011). In order to present information as clearly as possible, a conference poster can have a similar structure to a research paper - but it will need to have a much smaller word count.
To start, choose from a variety of pre-designed templates or create your own design from scratch. Then, drag and drop your desired illustrations onto your poster. With over 40,000 illustrations in 80+ fields, you're sure to find images that perfectly represent your own research project. Next, add your text.
Research posters provide general (or detailed) overviews about research either you are currently working on or already completed. Think of them like "mini research papers" or a summarized version of your research -- You want to discuss your research project in a short, concise narrative (with pictures!).
Venngage offers a wide selection of research poster templates that you can customize to suit your needs. Our free research poster templates can serve as inspiration or as the foundation for your design. You can filter by theme, style, or purpose to find the perfect template for your project. We offer professional, playful, and colorful research ...
Open access repository for posters and slide presentations in biology and medicine. Better Posters - A Blog. Academic conference posters are often ugly, with tiny text, confusing layouts, and dubious colour schemes. Better Posters is about making posters informative and beautiful. Last Updated: May 13, 2024 2:05 PM.
Bleed shows the printer where to trim white space that occurs when printing color onto white poster paper. If you are printing your poster, include at least a 0.25 inch bleed on each side; remember not to place any content in the bleed as it will be trimmed by the printer. Slug is a space for the creator to leave any notes for the printer.
Presentations usually consist of affixing the research poster to a portable wall with the researcher in attendance answering questions. Each research project is presented on a conference schedule for a period ranging from 10 minutes to several hours. ... The front side of the paper should include a picture of the poster. 3) The back side of the ...
Many researchers fall into the trap of presenting their entire research paper on the poster, making it dense and overwhelming for viewers. A successful poster should convey key information succinctly, using concise text and visual elements to engage the audience. Introduction (3 sentences max). Your question or why your question is worth asking.
Research Poster Overview. The purpose of a research poster is to visually represent the general overview, data, and most relevant findings of a research project. Typically, research posters accompany an oral presentation of the project conducted, but should also be able to independently represent the research. The elements of a research poster ...
Research posters are organized like scientific papers, with separate pages devoted to the objectives and background, data and methods, results, and conclusions (Briscoe 1996). Readers view the posters at their own pace and at close range; thus you can include more detail than in slides for a speech (see Appendix A for a detailed comparison of ...
An effective science outreach poster with the ultimate goal of clearly displaying the information obtained. A scientific poster for the academic public to be captivated by your research. Create all kinds of templates to make scientific posters that you can design step by step thanks to the editor, very easy to use. Choose from our extensive ...
Case in point: the research poster template below. Here, the designer shared important facts and visualized data on Diabetes Awareness Month, making it the best of both worlds when it comes to research posters. EDIT THIS RESEARCH POSTER TEMPLATE. This template doubles as a great event or medical poster.
Research Poster Presentation Preparation Guide; In Their Own Words. In His Own Words, International Research Project Experience: Eric Durr; In Her Own Words, Posters On The Hill: Abigail Parker; 2019 IU Research Day Highlights; News Archives. 2010-2011 AY. 2010-2011 Articles. News_1_12_2010; 2016-2017. 2016-2017 Highlights. From Project SEED to ...
This free PowerPoint poster template is designed for a standard 4x4 foot poster presentation. This scientific poster template is a good size for limited available spaces without compromising room for content. This research poster template can be printed at the following sizes: 48x48 (Standard), 36x36, 24x24, 42x42.
Scientific Poster Templates. We offer free Powerpoint templates to get you started making your scientific poster. All of our templates work within the limitations of PowerPoint and have customizable colors. PosterNerd is a scientific poster printing company with a focus on a simple ordering process and unbeatable customer service. We also offer ...
Connors J. Turning your research into an article/poster. Sci Ed. 2019;42:140-141. Being in the midst of a research project I hope to turn into an article and/or poster, I found this presentation to be comprehensive, concise, and extremely helpful for a first-time poster presenter. Moderator Mary Warner of the American Pharmacists Association ...
Mission. The Purdue On-Campus Writing Lab and Purdue Online Writing Lab assist clients in their development as writers—no matter what their skill level—with on-campus consultations, online participation, and community engagement. The Purdue Writing Lab serves the Purdue, West Lafayette, campus and coordinates with local literacy initiatives.
Poster, Presentation, Protocol or Paper. Deposit scholarly works such as posters, presentations, research protocols, conference papers or white papers. If you would like to deposit a peer-reviewed article or book chapter, use the "Scholarly Articles and Book Chapters" deposit option.
Lester Mackey (Microsoft Research) Amir Globerson (Tel Aviv University, Google) Program Chair Ulrich Paquet (Google DeepMind; AIMS South Africa) ... and oral and poster presentations of refereed papers. Along with the conference is a professional exposition focusing on machine learning in practice, a series of tutorials, and topical workshops ...
UNSW Sydney NSW 2052 Australia Telephone +61 2 93851000 Authorised by Deputy Vice-Chancellor (Research) UNSW CRICOS Provider Code: 00098G ABN: 57 195 873 179