Initial Thoughts
Perspectives & resources, what is high-quality mathematics instruction and why is it important.
- Page 1: The Importance of High-Quality Mathematics Instruction
- Page 2: A Standards-Based Mathematics Curriculum
- Page 3: Evidence-Based Mathematics Practices

What evidence-based mathematics practices can teachers employ?
- Page 4: Explicit, Systematic Instruction
Page 5: Visual Representations
- Page 6: Schema Instruction
- Page 7: Metacognitive Strategies
- Page 8: Effective Classroom Practices
- Page 9: References & Additional Resources
- Page 10: Credits

Research Shows
- Students who use accurate visual representations are six times more likely to correctly solve mathematics problems than are students who do not use them. However, students who use inaccurate visual representations are less likely to correctly solve mathematics problems than those who do not use visual representations at all. (Boonen, van Wesel, Jolles, & van der Schoot, 2014)
- Students with a learning disability (LD) often do not create accurate visual representations or use them strategically to solve problems. Teaching students to systematically use a visual representation to solve word problems has led to substantial improvements in math achievement for students with learning disabilities. (van Garderen, Scheuermann, & Jackson, 2012; van Garderen, Scheuermann, & Poch, 2014)
- Students who use visual representations to solve word problems are more likely to solve the problems accurately. This was equally true for students who had LD, were low-achieving, or were average-achieving. (Krawec, 2014)
Visual representations are flexible; they can be used across grade levels and types of math problems. They can be used by teachers to teach mathematics facts and by students to learn mathematics content. Visual representations can take a number of forms. Click on the links below to view some of the visual representations most commonly used by teachers and students.
How does this practice align?
High-leverage practice (hlp).
- HLP15 : Provide scaffolded supports
CCSSM: Standards for Mathematical Practice
- MP1 : Make sense of problems and persevere in solving them.
Number Lines
Definition : A straight line that shows the order of and the relation between numbers.
Common Uses : addition, subtraction, counting

Strip Diagrams
Definition : A bar divided into rectangles that accurately represent quantities noted in the problem.
Common Uses : addition, fractions, proportions, ratios

Definition : Simple drawings of concrete or real items (e.g., marbles, trucks).
Common Uses : counting, addition, subtraction, multiplication, division

Graphs/Charts
Definition : Drawings that depict information using lines, shapes, and colors.
Common Uses : comparing numbers, statistics, ratios, algebra

Graphic Organizers
Definition : Visual that assists students in remembering and organizing information, as well as depicting the relationships between ideas (e.g., word webs, tables, Venn diagrams).
Common Uses : algebra, geometry
Before they can solve problems, however, students must first know what type of visual representation to create and use for a given mathematics problem. Some students—specifically, high-achieving students, gifted students—do this automatically, whereas others need to be explicitly taught how. This is especially the case for students who struggle with mathematics and those with mathematics learning disabilities. Without explicit, systematic instruction on how to create and use visual representations, these students often create visual representations that are disorganized or contain incorrect or partial information. Consider the examples below.
Elementary Example
Mrs. Aldridge ask her first-grade students to add 2 + 4 by drawing dots.
Notice that Talia gets the correct answer. However, because Colby draws his dots in haphazard fashion, he fails to count all of them and consequently arrives at the wrong solution.
High School Example
Mr. Huang asks his students to solve the following word problem:
The flagpole needs to be replaced. The school would like to replace it with the same size pole. When Juan stands 11 feet from the base of the pole, the angle of elevation from Juan’s feet to the top of the pole is 70 degrees. How tall is the pole?
Compare the drawings below created by Brody and Zoe to represent this problem. Notice that Brody drew an accurate representation and applied the correct strategy. In contrast, Zoe drew a picture with partially correct information. The 11 is in the correct place, but the 70° is not. As a result of her inaccurate representation, Zoe is unable to move forward and solve the problem. However, given an accurate representation developed by someone else, Zoe is more likely to solve the problem correctly.

Manipulatives
Some students will not be able to grasp mathematics skills and concepts using only the types of visual representations noted in the table above. Very young children and students who struggle with mathematics often require different types of visual representations known as manipulatives. These concrete, hands-on materials and objects—for example, an abacus or coins—help students to represent the mathematical idea they are trying to learn or the problem they are attempting to solve. Manipulatives can help students develop a conceptual understanding of mathematical topics. (For the purpose of this module, the term concrete objects refers to manipulatives and the term visual representations refers to schematic diagrams.)
It is important that the teacher make explicit the connection between the concrete object and the abstract concept being taught. The goal is for the student to eventually understand the concepts and procedures without the use of manipulatives. For secondary students who struggle with mathematics, teachers should show the abstract along with the concrete or visual representation and explicitly make the connection between them.
A move from concrete objects or visual representations to using abstract equations can be difficult for some students. One strategy teachers can use to help students systematically transition among concrete objects, visual representations, and abstract equations is the Concrete-Representational-Abstract (CRA) framework.
If you would like to learn more about this framework, click here.
Concrete-Representational-Abstract Framework

- Concrete —Students interact and manipulate three-dimensional objects, for example algebra tiles or other algebra manipulatives with representations of variables and units.
- Representational — Students use two-dimensional drawings to represent problems. These pictures may be presented to them by the teacher, or through the curriculum used in the class, or students may draw their own representation of the problem.
- Abstract — Students solve problems with numbers, symbols, and words without any concrete or representational assistance.
CRA is effective across all age levels and can assist students in learning concepts, procedures, and applications. When implementing each component, teachers should use explicit, systematic instruction and continually monitor student work to assess their understanding, asking them questions about their thinking and providing clarification as needed. Concrete and representational activities must reflect the actual process of solving the problem so that students are able to generalize the process to solve an abstract equation. The illustration below highlights each of these components.

For Your Information
One promising practice for moving secondary students with mathematics difficulties or disabilities from the use of manipulatives and visual representations to the abstract equation quickly is the CRA-I strategy . In this modified version of CRA, the teacher simultaneously presents the content using concrete objects, visual representations of the concrete objects, and the abstract equation. Studies have shown that this framework is effective for teaching algebra to this population of students (Strickland & Maccini, 2012; Strickland & Maccini, 2013; Strickland, 2017).
Kim Paulsen discusses the benefits of manipulatives and a number of things to keep in mind when using them (time: 2:35).
Kim Paulsen, EdD Associate Professor, Special Education Vanderbilt University
View Transcript

Transcript: Kim Paulsen, EdD
Manipulatives are a great way of helping kids understand conceptually. The use of manipulatives really helps students see that conceptually, and it clicks a little more with them. Some of the things, though, that we need to remember when we’re using manipulatives is that it is important to give students a little bit of free time when you’re using a new manipulative so that they can just explore with them. We need to have specific rules for how to use manipulatives, that they aren’t toys, that they really are learning materials, and how students pick them up, how they put them away, the right time to use them, and making sure that they’re not distracters while we’re actually doing the presentation part of the lesson. One of the important things is that we don’t want students to memorize the algorithm or the procedures while they’re using the manipulatives. It really is just to help them understand conceptually. That doesn’t mean that kids are automatically going to understand conceptually or be able to make that bridge between using the concrete manipulatives into them being able to solve the problems. For some kids, it is difficult to use the manipulatives. That’s not how they learn, and so we don’t want to force kids to have to use manipulatives if it’s not something that is helpful for them. So we have to remember that manipulatives are one way to think about teaching math.
I think part of the reason that some teachers don’t use them is because it takes a lot of time, it takes a lot of organization, and they also feel that students get too reliant on using manipulatives. One way to think about using manipulatives is that you do it a couple of lessons when you’re teaching a new concept, and then take those away so that students are able to do just the computation part of it. It is true we can’t walk around life with manipulatives in our hands. And I think one of the other reasons that a lot of schools or teachers don’t use manipulatives is because they’re very expensive. And so it’s very helpful if all of the teachers in the school can pool resources and have a manipulative room where teachers can go check out manipulatives so that it’s not so expensive. Teachers have to know how to use them, and that takes a lot of practice.
- Our Mission
The Power of Visualization in Math
Creating visual representations for math students can open up understanding. We have resources you can use in class tomorrow.

When do you know it’s time to try something different in your math lesson?
For me, I knew the moment I read this word problem to my fifth-grade summer school students: “On average, the sun’s energy density reaching Earth’s upper atmosphere is 1,350 watts per square meter. Assume the incident, monochromatic light has a wavelength of 800 nanometers (each photon has an energy of 2.48 × 10 -19 joules at this wavelength). How many photons are incident on the Earth’s upper atmosphere in one second?”

My students couldn’t get past the language, the sizes of the different numbers, or the science concepts addressed in the question. In short, I had effectively shut them down, and I needed a new approach to bring them back to their learning. So I started drawing on the whiteboard and created something with a little whimsy, a cartoon photon asking how much energy a photon has.
Immediately, students started yelling out, “2.48 × 10 -19 joules,” and they could even cite the text where they had learned the information. I knew I was on to something, so the next thing I drew was a series of boxes with our friend the photon.
If all of the photons in the image below were to hit in one second, how much energy is represented in the drawing?

Students realized that we were just adding up all the individual energy from each photon and then quickly realized that this was multiplication. And then they knew that the question we were trying to answer was just figuring out the number of photons, and since we knew the total energy in one second, we could compute the number of photons by division.
The point being, we reached a place where my students were able to process the learning. The power of the visual representation made all the difference for these students, and being able to sequence through the problem using the visual supports completely changed the interactions they were having with the problem.
If you’re like me, you’re thinking, “So the visual representations worked with this problem, but what about other types of problems? Surely there isn’t a visual model for every problem!”
The power of this moment, the change in the learning environment, and the excitement of my fifth graders as they could not only understand but explain to others what the problem was about convinced me it was worth the effort to pursue visualization and try to answer these questions: Is there a process to unlock visualizations in math? And are there resources already available to help make mathematics visual?

I realized that the first step in unlocking visualization as a scaffold for students was to change the kind of question I was asking myself. A powerful question to start with is: “How might I represent this learning target in a visual way?” This reframing opens a world of possible representations that we might not otherwise have considered. Thinking about many possible visual representations is the first step in creating a good one for students.
The Progressions published in tandem with the Common Core State Standards for mathematics are one resource for finding specific visual models based on grade level and standard. In my fifth-grade example, what I constructed was a sequenced process to develop a tape diagram—a type of visual model that uses rectangles to represent the parts of a ratio. I didn’t realize it, but to unlock my thinking I had to commit to finding a way to represent the problem in a visual way. Asking yourself a very simple series of questions leads you down a variety of learning paths, and primes you for the next step in the sequence—finding the right resources to complete your visualization journey.
Posing the question of visualization readies your brain to identify the right tool for the desired learning target and your students. That is, you’ll more readily know when you’ve identified the right tool for the job for your students. There are many, many resources available to help make this process even easier, and I’ve created a matrix of clickable tools, articles, and resources .
The process to visualize your math instruction is summarized at the top of my Visualizing Math graphic; below that is a mix of visualization strategies and resources you can use tomorrow in your classroom.
Our job as educators is to set a stage that maximizes the amount of learning done by our students, and teaching students mathematics in this visual way provides a powerful pathway for us to do our job well. The process of visualizing mathematics tests your abilities at first, and you’ll find that it makes both you and your students learn.
- Open access
- Published: 19 July 2015
The role of visual representations in scientific practices: from conceptual understanding and knowledge generation to ‘seeing’ how science works
- Maria Evagorou 1 ,
- Sibel Erduran 2 &
- Terhi Mäntylä 3
International Journal of STEM Education volume 2 , Article number: 11 ( 2015 ) Cite this article
73k Accesses
78 Citations
13 Altmetric
Metrics details
The use of visual representations (i.e., photographs, diagrams, models) has been part of science, and their use makes it possible for scientists to interact with and represent complex phenomena, not observable in other ways. Despite a wealth of research in science education on visual representations, the emphasis of such research has mainly been on the conceptual understanding when using visual representations and less on visual representations as epistemic objects. In this paper, we argue that by positioning visual representations as epistemic objects of scientific practices, science education can bring a renewed focus on how visualization contributes to knowledge formation in science from the learners’ perspective.
This is a theoretical paper, and in order to argue about the role of visualization, we first present a case study, that of the discovery of the structure of DNA that highlights the epistemic components of visual information in science. The second case study focuses on Faraday’s use of the lines of magnetic force. Faraday is known of his exploratory, creative, and yet systemic way of experimenting, and the visual reasoning leading to theoretical development was an inherent part of the experimentation. Third, we trace a contemporary account from science focusing on the experimental practices and how reproducibility of experimental procedures can be reinforced through video data.
Conclusions
Our conclusions suggest that in teaching science, the emphasis in visualization should shift from cognitive understanding—using the products of science to understand the content—to engaging in the processes of visualization. Furthermore, we suggest that is it essential to design curriculum materials and learning environments that create a social and epistemic context and invite students to engage in the practice of visualization as evidence, reasoning, experimental procedure, or a means of communication and reflect on these practices. Implications for teacher education include the need for teacher professional development programs to problematize the use of visual representations as epistemic objects that are part of scientific practices.
During the last decades, research and reform documents in science education across the world have been calling for an emphasis not only on the content but also on the processes of science (Bybee 2014 ; Eurydice 2012 ; Duschl and Bybee 2014 ; Osborne 2014 ; Schwartz et al. 2012 ), in order to make science accessible to the students and enable them to understand the epistemic foundation of science. Scientific practices, part of the process of science, are the cognitive and discursive activities that are targeted in science education to develop epistemic understanding and appreciation of the nature of science (Duschl et al. 2008 ) and have been the emphasis of recent reform documents in science education across the world (Achieve 2013 ; Eurydice 2012 ). With the term scientific practices, we refer to the processes that take place during scientific discoveries and include among others: asking questions, developing and using models, engaging in arguments, and constructing and communicating explanations (National Research Council 2012 ). The emphasis on scientific practices aims to move the teaching of science from knowledge to the understanding of the processes and the epistemic aspects of science. Additionally, by placing an emphasis on engaging students in scientific practices, we aim to help students acquire scientific knowledge in meaningful contexts that resemble the reality of scientific discoveries.
Despite a wealth of research in science education on visual representations, the emphasis of such research has mainly been on the conceptual understanding when using visual representations and less on visual representations as epistemic objects. In this paper, we argue that by positioning visual representations as epistemic objects, science education can bring a renewed focus on how visualization contributes to knowledge formation in science from the learners’ perspective. Specifically, the use of visual representations (i.e., photographs, diagrams, tables, charts) has been part of science and over the years has evolved with the new technologies (i.e., from drawings to advanced digital images and three dimensional models). Visualization makes it possible for scientists to interact with complex phenomena (Richards 2003 ), and they might convey important evidence not observable in other ways. Visual representations as a tool to support cognitive understanding in science have been studied extensively (i.e., Gilbert 2010 ; Wu and Shah 2004 ). Studies in science education have explored the use of images in science textbooks (i.e., Dimopoulos et al. 2003 ; Bungum 2008 ), students’ representations or models when doing science (i.e., Gilbert et al. 2008 ; Dori et al. 2003 ; Lehrer and Schauble 2012 ; Schwarz et al. 2009 ), and students’ images of science and scientists (i.e., Chambers 1983 ). Therefore, studies in the field of science education have been using the term visualization as “the formation of an internal representation from an external representation” (Gilbert et al. 2008 , p. 4) or as a tool for conceptual understanding for students.
In this paper, we do not refer to visualization as mental image, model, or presentation only (Gilbert et al. 2008 ; Philips et al. 2010 ) but instead focus on visual representations or visualization as epistemic objects. Specifically, we refer to visualization as a process for knowledge production and growth in science. In this respect, modeling is an aspect of visualization, but what we are focusing on with visualization is not on the use of model as a tool for cognitive understanding (Gilbert 2010 ; Wu and Shah 2004 ) but the on the process of modeling as a scientific practice which includes the construction and use of models, the use of other representations, the communication in the groups with the use of the visual representation, and the appreciation of the difficulties that the science phase in this process. Therefore, the purpose of this paper is to present through the history of science how visualization can be considered not only as a cognitive tool in science education but also as an epistemic object that can potentially support students to understand aspects of the nature of science.
Scientific practices and science education
According to the New Generation Science Standards (Achieve 2013 ), scientific practices refer to: asking questions and defining problems; developing and using models; planning and carrying out investigations; analyzing and interpreting data; using mathematical and computational thinking; constructing explanations and designing solutions; engaging in argument from evidence; and obtaining, evaluating, and communicating information. A significant aspect of scientific practices is that science learning is more than just about learning facts, concepts, theories, and laws. A fuller appreciation of science necessitates the understanding of the science relative to its epistemological grounding and the process that are involved in the production of knowledge (Hogan and Maglienti 2001 ; Wickman 2004 ).
The New Generation Science Standards is, among other changes, shifting away from science inquiry and towards the inclusion of scientific practices (Duschl and Bybee 2014 ; Osborne 2014 ). By comparing the abilities to do scientific inquiry (National Research Council 2000 ) with the set of scientific practices, it is evident that the latter is about engaging in the processes of doing science and experiencing in that way science in a more authentic way. Engaging in scientific practices according to Osborne ( 2014 ) “presents a more authentic picture of the endeavor that is science” (p.183) and also helps the students to develop a deeper understanding of the epistemic aspects of science. Furthermore, as Bybee ( 2014 ) argues, by engaging students in scientific practices, we involve them in an understanding of the nature of science and an understanding on the nature of scientific knowledge.
Science as a practice and scientific practices as a term emerged by the philosopher of science, Kuhn (Osborne 2014 ), refers to the processes in which the scientists engage during knowledge production and communication. The work that is followed by historians, philosophers, and sociologists of science (Latour 2011 ; Longino 2002 ; Nersessian 2008 ) revealed the scientific practices in which the scientists engage in and include among others theory development and specific ways of talking, modeling, and communicating the outcomes of science.
Visualization as an epistemic object
Schematic, pictorial symbols in the design of scientific instruments and analysis of the perceptual and functional information that is being stored in those images have been areas of investigation in philosophy of scientific experimentation (Gooding et al. 1993 ). The nature of visual perception, the relationship between thought and vision, and the role of reproducibility as a norm for experimental research form a central aspect of this domain of research in philosophy of science. For instance, Rothbart ( 1997 ) has argued that visualizations are commonplace in the theoretical sciences even if every scientific theory may not be defined by visualized models.
Visual representations (i.e., photographs, diagrams, tables, charts, models) have been used in science over the years to enable scientists to interact with complex phenomena (Richards 2003 ) and might convey important evidence not observable in other ways (Barber et al. 2006 ). Some authors (e.g., Ruivenkamp and Rip 2010 ) have argued that visualization is as a core activity of some scientific communities of practice (e.g., nanotechnology) while others (e.g., Lynch and Edgerton 1988 ) have differentiated the role of particular visualization techniques (e.g., of digital image processing in astronomy). Visualization in science includes the complex process through which scientists develop or produce imagery, schemes, and graphical representation, and therefore, what is of importance in this process is not only the result but also the methodology employed by the scientists, namely, how this result was produced. Visual representations in science may refer to objects that are believed to have some kind of material or physical existence but equally might refer to purely mental, conceptual, and abstract constructs (Pauwels 2006 ). More specifically, visual representations can be found for: (a) phenomena that are not observable with the eye (i.e., microscopic or macroscopic); (b) phenomena that do not exist as visual representations but can be translated as such (i.e., sound); and (c) in experimental settings to provide visual data representations (i.e., graphs presenting velocity of moving objects). Additionally, since science is not only about replicating reality but also about making it more understandable to people (either to the public or other scientists), visual representations are not only about reproducing the nature but also about: (a) functioning in helping solving a problem, (b) filling gaps in our knowledge, and (c) facilitating knowledge building or transfer (Lynch 2006 ).
Using or developing visual representations in the scientific practice can range from a straightforward to a complicated situation. More specifically, scientists can observe a phenomenon (i.e., mitosis) and represent it visually using a picture or diagram, which is quite straightforward. But they can also use a variety of complicated techniques (i.e., crystallography in the case of DNA studies) that are either available or need to be developed or refined in order to acquire the visual information that can be used in the process of theory development (i.e., Latour and Woolgar 1979 ). Furthermore, some visual representations need decoding, and the scientists need to learn how to read these images (i.e., radiologists); therefore, using visual representations in the process of science requires learning a new language that is specific to the medium/methods that is used (i.e., understanding an X-ray picture is different from understanding an MRI scan) and then communicating that language to other scientists and the public.
There are much intent and purposes of visual representations in scientific practices, as for example to make a diagnosis, compare, describe, and preserve for future study, verify and explore new territory, generate new data (Pauwels 2006 ), or present new methodologies. According to Latour and Woolgar ( 1979 ) and Knorr Cetina ( 1999 ), visual representations can be used either as primary data (i.e., image from a microscope). or can be used to help in concept development (i.e., models of DNA used by Watson and Crick), to uncover relationships and to make the abstract more concrete (graphs of sound waves). Therefore, visual representations and visual practices, in all forms, are an important aspect of the scientific practices in developing, clarifying, and transmitting scientific knowledge (Pauwels 2006 ).
Methods and Results: Merging Visualization and scientific practices in science
In this paper, we present three case studies that embody the working practices of scientists in an effort to present visualization as a scientific practice and present our argument about how visualization is a complex process that could include among others modeling and use of representation but is not only limited to that. The first case study explores the role of visualization in the construction of knowledge about the structure of DNA, using visuals as evidence. The second case study focuses on Faraday’s use of the lines of magnetic force and the visual reasoning leading to the theoretical development that was an inherent part of the experimentation. The third case study focuses on the current practices of scientists in the context of a peer-reviewed journal called the Journal of Visualized Experiments where the methodology is communicated through videotaped procedures. The three case studies represent the research interests of the three authors of this paper and were chosen to present how visualization as a practice can be involved in all stages of doing science, from hypothesizing and evaluating evidence (case study 1) to experimenting and reasoning (case study 2) to communicating the findings and methodology with the research community (case study 3), and represent in this way the three functions of visualization as presented by Lynch ( 2006 ). Furthermore, the last case study showcases how the development of visualization technologies has contributed to the communication of findings and methodologies in science and present in that way an aspect of current scientific practices. In all three cases, our approach is guided by the observation that the visual information is an integral part of scientific practices at the least and furthermore that they are particularly central in the scientific practices of science.
Case study 1: use visual representations as evidence in the discovery of DNA
The focus of the first case study is the discovery of the structure of DNA. The DNA was first isolated in 1869 by Friedrich Miescher, and by the late 1940s, it was known that it contained phosphate, sugar, and four nitrogen-containing chemical bases. However, no one had figured the structure of the DNA until Watson and Crick presented their model of DNA in 1953. Other than the social aspects of the discovery of the DNA, another important aspect was the role of visual evidence that led to knowledge development in the area. More specifically, by studying the personal accounts of Watson ( 1968 ) and Crick ( 1988 ) about the discovery of the structure of the DNA, the following main ideas regarding the role of visual representations in the production of knowledge can be identified: (a) The use of visual representations was an important part of knowledge growth and was often dependent upon the discovery of new technologies (i.e., better microscopes or better techniques in crystallography that would provide better visual representations as evidence of the helical structure of the DNA); and (b) Models (three-dimensional) were used as a way to represent the visual images (X-ray images) and connect them to the evidence provided by other sources to see whether the theory can be supported. Therefore, the model of DNA was built based on the combination of visual evidence and experimental data.
An example showcasing the importance of visual representations in the process of knowledge production in this case is provided by Watson, in his book The Double Helix (1968):
…since the middle of the summer Rosy [Rosalind Franklin] had had evidence for a new three-dimensional form of DNA. It occurred when the DNA 2molecules were surrounded by a large amount of water. When I asked what the pattern was like, Maurice went into the adjacent room to pick up a print of the new form they called the “B” structure. The instant I saw the picture, my mouth fell open and my pulse began to race. The pattern was unbelievably simpler than those previously obtained (A form). Moreover, the black cross of reflections which dominated the picture could arise only from a helical structure. With the A form the argument for the helix was never straightforward, and considerable ambiguity existed as to exactly which type of helical symmetry was present. With the B form however, mere inspection of its X-ray picture gave several of the vital helical parameters. (p. 167-169)
As suggested by Watson’s personal account of the discovery of the DNA, the photo taken by Rosalind Franklin (Fig. 1 ) convinced him that the DNA molecule must consist of two chains arranged in a paired helix, which resembles a spiral staircase or ladder, and on March 7, 1953, Watson and Crick finished and presented their model of the structure of DNA (Watson and Berry 2004 ; Watson 1968 ) which was based on the visual information provided by the X-ray image and their knowledge of chemistry.
X-ray chrystallography of DNA
In analyzing the visualization practice in this case study, we observe the following instances that highlight how the visual information played a role:
Asking questions and defining problems: The real world in the model of science can at some points only be observed through visual representations or representations, i.e., if we are using DNA as an example, the structure of DNA was only observable through the crystallography images produced by Rosalind Franklin in the laboratory. There was no other way to observe the structure of DNA, therefore the real world.
Analyzing and interpreting data: The images that resulted from crystallography as well as their interpretations served as the data for the scientists studying the structure of DNA.
Experimenting: The data in the form of visual information were used to predict the possible structure of the DNA.
Modeling: Based on the prediction, an actual three-dimensional model was prepared by Watson and Crick. The first model did not fit with the real world (refuted by Rosalind Franklin and her research group from King’s College) and Watson and Crick had to go through the same process again to find better visual evidence (better crystallography images) and create an improved visual model.
Example excerpts from Watson’s biography provide further evidence for how visualization practices were applied in the context of the discovery of DNA (Table 1 ).
In summary, by examining the history of the discovery of DNA, we showcased how visual data is used as scientific evidence in science, identifying in that way an aspect of the nature of science that is still unexplored in the history of science and an aspect that has been ignored in the teaching of science. Visual representations are used in many ways: as images, as models, as evidence to support or rebut a model, and as interpretations of reality.
Case study 2: applying visual reasoning in knowledge production, the example of the lines of magnetic force
The focus of this case study is on Faraday’s use of the lines of magnetic force. Faraday is known of his exploratory, creative, and yet systemic way of experimenting, and the visual reasoning leading to theoretical development was an inherent part of this experimentation (Gooding 2006 ). Faraday’s articles or notebooks do not include mathematical formulations; instead, they include images and illustrations from experimental devices and setups to the recapping of his theoretical ideas (Nersessian 2008 ). According to Gooding ( 2006 ), “Faraday’s visual method was designed not to copy apparent features of the world, but to analyse and replicate them” (2006, p. 46).
The lines of force played a central role in Faraday’s research on electricity and magnetism and in the development of his “field theory” (Faraday 1852a ; Nersessian 1984 ). Before Faraday, the experiments with iron filings around magnets were known and the term “magnetic curves” was used for the iron filing patterns and also for the geometrical constructs derived from the mathematical theory of magnetism (Gooding et al. 1993 ). However, Faraday used the lines of force for explaining his experimental observations and in constructing the theory of forces in magnetism and electricity. Examples of Faraday’s different illustrations of lines of magnetic force are given in Fig. 2 . Faraday gave the following experiment-based definition for the lines of magnetic forces:
a Iron filing pattern in case of bar magnet drawn by Faraday (Faraday 1852b , Plate IX, p. 158, Fig. 1), b Faraday’s drawing of lines of magnetic force in case of cylinder magnet, where the experimental procedure, knife blade showing the direction of lines, is combined into drawing (Faraday, 1855, vol. 1, plate 1)
A line of magnetic force may be defined as that line which is described by a very small magnetic needle, when it is so moved in either direction correspondent to its length, that the needle is constantly a tangent to the line of motion; or it is that line along which, if a transverse wire be moved in either direction, there is no tendency to the formation of any current in the wire, whilst if moved in any other direction there is such a tendency; or it is that line which coincides with the direction of the magnecrystallic axis of a crystal of bismuth, which is carried in either direction along it. The direction of these lines about and amongst magnets and electric currents, is easily represented and understood, in a general manner, by the ordinary use of iron filings. (Faraday 1852a , p. 25 (3071))
The definition describes the connection between the experiments and the visual representation of the results. Initially, the lines of force were just geometric representations, but later, Faraday treated them as physical objects (Nersessian 1984 ; Pocovi and Finlay 2002 ):
I have sometimes used the term lines of force so vaguely, as to leave the reader doubtful whether I intended it as a merely representative idea of the forces, or as the description of the path along which the power was continuously exerted. … wherever the expression line of force is taken simply to represent the disposition of forces, it shall have the fullness of that meaning; but that wherever it may seem to represent the idea of the physical mode of transmission of the force, it expresses in that respect the opinion to which I incline at present. The opinion may be erroneous, and yet all that relates or refers to the disposition of the force will remain the same. (Faraday, 1852a , p. 55-56 (3075))
He also felt that the lines of force had greater explanatory power than the dominant theory of action-at-a-distance:
Now it appears to me that these lines may be employed with great advantage to represent nature, condition, direction and comparative amount of the magnetic forces; and that in many cases they have, to the physical reasoned at least, a superiority over that method which represents the forces as concentrated in centres of action… (Faraday, 1852a , p. 26 (3074))
For giving some insight to Faraday’s visual reasoning as an epistemic practice, the following examples of Faraday’s studies of the lines of magnetic force (Faraday 1852a , 1852b ) are presented:
(a) Asking questions and defining problems: The iron filing patterns formed the empirical basis for the visual model: 2D visualization of lines of magnetic force as presented in Fig. 2 . According to Faraday, these iron filing patterns were suitable for illustrating the direction and form of the magnetic lines of force (emphasis added):
It must be well understood that these forms give no indication by their appearance of the relative strength of the magnetic force at different places, inasmuch as the appearance of the lines depends greatly upon the quantity of filings and the amount of tapping; but the direction and forms of these lines are well given, and these indicate, in a considerable degree, the direction in which the forces increase and diminish . (Faraday 1852b , p.158 (3237))
Despite being static and two dimensional on paper, the lines of magnetic force were dynamical (Nersessian 1992 , 2008 ) and three dimensional for Faraday (see Fig. 2 b). For instance, Faraday described the lines of force “expanding”, “bending,” and “being cut” (Nersessian 1992 ). In Fig. 2 b, Faraday has summarized his experiment (bar magnet and knife blade) and its results (lines of force) in one picture.
(b) Analyzing and interpreting data: The model was so powerful for Faraday that he ended up thinking them as physical objects (e.g., Nersessian 1984 ), i.e., making interpretations of the way forces act. Of course, he made a lot of experiments for showing the physical existence of the lines of force, but he did not succeed in it (Nersessian 1984 ). The following quote illuminates Faraday’s use of the lines of force in different situations:
The study of these lines has, at different times, been greatly influential in leading me to various results, which I think prove their utility as well as fertility. Thus, the law of magneto-electric induction; the earth’s inductive action; the relation of magnetism and light; diamagnetic action and its law, and magnetocrystallic action, are the cases of this kind… (Faraday 1852a , p. 55 (3174))
(c) Experimenting: In Faraday's case, he used a lot of exploratory experiments; in case of lines of magnetic force, he used, e.g., iron filings, magnetic needles, or current carrying wires (see the quote above). The magnetic field is not directly observable and the representation of lines of force was a visual model, which includes the direction, form, and magnitude of field.
(d) Modeling: There is no denying that the lines of magnetic force are visual by nature. Faraday’s views of lines of force developed gradually during the years, and he applied and developed them in different contexts such as electromagnetic, electrostatic, and magnetic induction (Nersessian 1984 ). An example of Faraday’s explanation of the effect of the wire b’s position to experiment is given in Fig. 3 . In Fig. 3 , few magnetic lines of force are drawn, and in the quote below, Faraday is explaining the effect using these magnetic lines of force (emphasis added):
Picture of an experiment with different arrangements of wires ( a , b’ , b” ), magnet, and galvanometer. Note the lines of force drawn around the magnet. (Faraday 1852a , p. 34)
It will be evident by inspection of Fig. 3 , that, however the wires are carried away, the general result will, according to the assumed principles of action, be the same; for if a be the axial wire, and b’, b”, b”’ the equatorial wire, represented in three different positions, whatever magnetic lines of force pass across the latter wire in one position, will also pass it in the other, or in any other position which can be given to it. The distance of the wire at the place of intersection with the lines of force, has been shown, by the experiments (3093.), to be unimportant. (Faraday 1852a , p. 34 (3099))
In summary, by examining the history of Faraday’s use of lines of force, we showed how visual imagery and reasoning played an important part in Faraday’s construction and representation of his “field theory”. As Gooding has stated, “many of Faraday’s sketches are far more that depictions of observation, they are tools for reasoning with and about phenomena” (2006, p. 59).
Case study 3: visualizing scientific methods, the case of a journal
The focus of the third case study is the Journal of Visualized Experiments (JoVE) , a peer-reviewed publication indexed in PubMed. The journal devoted to the publication of biological, medical, chemical, and physical research in a video format. The journal describes its history as follows:
JoVE was established as a new tool in life science publication and communication, with participation of scientists from leading research institutions. JoVE takes advantage of video technology to capture and transmit the multiple facets and intricacies of life science research. Visualization greatly facilitates the understanding and efficient reproduction of both basic and complex experimental techniques, thereby addressing two of the biggest challenges faced by today's life science research community: i) low transparency and poor reproducibility of biological experiments and ii) time and labor-intensive nature of learning new experimental techniques. ( http://www.jove.com/ )
By examining the journal content, we generate a set of categories that can be considered as indicators of relevance and significance in terms of epistemic practices of science that have relevance for science education. For example, the quote above illustrates how scientists view some norms of scientific practice including the norms of “transparency” and “reproducibility” of experimental methods and results, and how the visual format of the journal facilitates the implementation of these norms. “Reproducibility” can be considered as an epistemic criterion that sits at the heart of what counts as an experimental procedure in science:
Investigating what should be reproducible and by whom leads to different types of experimental reproducibility, which can be observed to play different roles in experimental practice. A successful application of the strategy of reproducing an experiment is an achievement that may depend on certain isiosyncratic aspects of a local situation. Yet a purely local experiment that cannot be carried out by other experimenters and in other experimental contexts will, in the end be unproductive in science. (Sarkar and Pfeifer 2006 , p.270)
We now turn to an article on “Elevated Plus Maze for Mice” that is available for free on the journal website ( http://www.jove.com/video/1088/elevated-plus-maze-for-mice ). The purpose of this experiment was to investigate anxiety levels in mice through behavioral analysis. The journal article consists of a 9-min video accompanied by text. The video illustrates the handling of the mice in soundproof location with less light, worksheets with characteristics of mice, computer software, apparatus, resources, setting up the computer software, and the video recording of mouse behavior on the computer. The authors describe the apparatus that is used in the experiment and state how procedural differences exist between research groups that lead to difficulties in the interpretation of results:
The apparatus consists of open arms and closed arms, crossed in the middle perpendicularly to each other, and a center area. Mice are given access to all of the arms and are allowed to move freely between them. The number of entries into the open arms and the time spent in the open arms are used as indices of open space-induced anxiety in mice. Unfortunately, the procedural differences that exist between laboratories make it difficult to duplicate and compare results among laboratories.
The authors’ emphasis on the particularity of procedural context echoes in the observations of some philosophers of science:
It is not just the knowledge of experimental objects and phenomena but also their actual existence and occurrence that prove to be dependent on specific, productive interventions by the experimenters” (Sarkar and Pfeifer 2006 , pp. 270-271)
The inclusion of a video of the experimental procedure specifies what the apparatus looks like (Fig. 4 ) and how the behavior of the mice is captured through video recording that feeds into a computer (Fig. 5 ). Subsequently, a computer software which captures different variables such as the distance traveled, the number of entries, and the time spent on each arm of the apparatus. Here, there is visual information at different levels of representation ranging from reconfiguration of raw video data to representations that analyze the data around the variables in question (Fig. 6 ). The practice of levels of visual representations is not particular to the biological sciences. For instance, they are commonplace in nanotechnological practices:
Visual illustration of apparatus
Video processing of experimental set-up
Computer software for video input and variable recording
In the visualization processes, instruments are needed that can register the nanoscale and provide raw data, which needs to be transformed into images. Some Imaging Techniques have software incorporated already where this transformation automatically takes place, providing raw images. Raw data must be translated through the use of Graphic Software and software is also used for the further manipulation of images to highlight what is of interest to capture the (inferred) phenomena -- and to capture the reader. There are two levels of choice: Scientists have to choose which imaging technique and embedded software to use for the job at hand, and they will then have to follow the structure of the software. Within such software, there are explicit choices for the scientists, e.g. about colour coding, and ways of sharpening images. (Ruivenkamp and Rip 2010 , pp.14–15)
On the text that accompanies the video, the authors highlight the role of visualization in their experiment:
Visualization of the protocol will promote better understanding of the details of the entire experimental procedure, allowing for standardization of the protocols used in different laboratories and comparisons of the behavioral phenotypes of various strains of mutant mice assessed using this test.
The software that takes the video data and transforms it into various representations allows the researchers to collect data on mouse behavior more reliably. For instance, the distance traveled across the arms of the apparatus or the time spent on each arm would have been difficult to observe and record precisely. A further aspect to note is how the visualization of the experiment facilitates control of bias. The authors illustrate how the olfactory bias between experimental procedures carried on mice in sequence is avoided by cleaning the equipment.
Our discussion highlights the role of visualization in science, particularly with respect to presenting visualization as part of the scientific practices. We have used case studies from the history of science highlighting a scientist’s account of how visualization played a role in the discovery of DNA and the magnetic field and from a contemporary illustration of a science journal’s practices in incorporating visualization as a way to communicate new findings and methodologies. Our implicit aim in drawing from these case studies was the need to align science education with scientific practices, particularly in terms of how visual representations, stable or dynamic, can engage students in the processes of science and not only to be used as tools for cognitive development in science. Our approach was guided by the notion of “knowledge-as-practice” as advanced by Knorr Cetina ( 1999 ) who studied scientists and characterized their knowledge as practice, a characterization which shifts focus away from ideas inside scientists’ minds to practices that are cultural and deeply contextualized within fields of science. She suggests that people working together can be examined as epistemic cultures whose collective knowledge exists as practice.
It is important to stress, however, that visual representations are not used in isolation, but are supported by other types of evidence as well, or other theories (i.e., in order to understand the helical form of DNA, or the structure, chemistry knowledge was needed). More importantly, this finding can also have implications when teaching science as argument (e.g., Erduran and Jimenez-Aleixandre 2008 ), since the verbal evidence used in the science classroom to maintain an argument could be supported by visual evidence (either a model, representation, image, graph, etc.). For example, in a group of students discussing the outcomes of an introduced species in an ecosystem, pictures of the species and the ecosystem over time, and videos showing the changes in the ecosystem, and the special characteristics of the different species could serve as visual evidence to help the students support their arguments (Evagorou et al. 2012 ). Therefore, an important implication for the teaching of science is the use of visual representations as evidence in the science curriculum as part of knowledge production. Even though studies in the area of science education have focused on the use of models and modeling as a way to support students in the learning of science (Dori et al. 2003 ; Lehrer and Schauble 2012 ; Mendonça and Justi 2013 ; Papaevripidou et al. 2007 ) or on the use of images (i.e., Korfiatis et al. 2003 ), with the term using visuals as evidence, we refer to the collection of all forms of visuals and the processes involved.
Another aspect that was identified through the case studies is that of the visual reasoning (an integral part of Faraday’s investigations). Both the verbalization and visualization were part of the process of generating new knowledge (Gooding 2006 ). Even today, most of the textbooks use the lines of force (or just field lines) as a geometrical representation of field, and the number of field lines is connected to the quantity of flux. Often, the textbooks use the same kind of visual imagery than in what is used by scientists. However, when using images, only certain aspects or features of the phenomena or data are captured or highlighted, and often in tacit ways. Especially in textbooks, the process of producing the image is not presented and instead only the product—image—is left. This could easily lead to an idea of images (i.e., photos, graphs, visual model) being just representations of knowledge and, in the worse case, misinterpreted representations of knowledge as the results of Pocovi and Finlay ( 2002 ) in case of electric field lines show. In order to avoid this, the teachers should be able to explain how the images are produced (what features of phenomena or data the images captures, on what ground the features are chosen to that image, and what features are omitted); in this way, the role of visualization in knowledge production can be made “visible” to students by engaging them in the process of visualization.
The implication of these norms for science teaching and learning is numerous. The classroom contexts can model the generation, sharing and evaluation of evidence, and experimental procedures carried out by students, thereby promoting not only some contemporary cultural norms in scientific practice but also enabling the learning of criteria, standards, and heuristics that scientists use in making decisions on scientific methods. As we have demonstrated with the three case studies, visual representations are part of the process of knowledge growth and communication in science, as demonstrated with two examples from the history of science and an example from current scientific practices. Additionally, visual information, especially with the use of technology is a part of students’ everyday lives. Therefore, we suggest making use of students’ knowledge and technological skills (i.e., how to produce their own videos showing their experimental method or how to identify or provide appropriate visual evidence for a given topic), in order to teach them the aspects of the nature of science that are often neglected both in the history of science and the design of curriculum. Specifically, what we suggest in this paper is that students should actively engage in visualization processes in order to appreciate the diverse nature of doing science and engage in authentic scientific practices.
However, as a word of caution, we need to distinguish the products and processes involved in visualization practices in science:
If one considers scientific representations and the ways in which they can foster or thwart our understanding, it is clear that a mere object approach, which would devote all attention to the representation as a free-standing product of scientific labor, is inadequate. What is needed is a process approach: each visual representation should be linked with its context of production (Pauwels 2006 , p.21).
The aforementioned suggests that the emphasis in visualization should shift from cognitive understanding—using the products of science to understand the content—to engaging in the processes of visualization. Therefore, an implication for the teaching of science includes designing curriculum materials and learning environments that create a social and epistemic context and invite students to engage in the practice of visualization as evidence, reasoning, experimental procedure, or a means of communication (as presented in the three case studies) and reflect on these practices (Ryu et al. 2015 ).
Finally, a question that arises from including visualization in science education, as well as from including scientific practices in science education is whether teachers themselves are prepared to include them as part of their teaching (Bybee 2014 ). Teacher preparation programs and teacher education have been critiqued, studied, and rethought since the time they emerged (Cochran-Smith 2004 ). Despite the years of history in teacher training and teacher education, the debate about initial teacher training and its content still pertains in our community and in policy circles (Cochran-Smith 2004 ; Conway et al. 2009 ). In the last decades, the debate has shifted from a behavioral view of learning and teaching to a learning problem—focusing on that way not only on teachers’ knowledge, skills, and beliefs but also on making the connection of the aforementioned with how and if pupils learn (Cochran-Smith 2004 ). The Science Education in Europe report recommended that “Good quality teachers, with up-to-date knowledge and skills, are the foundation of any system of formal science education” (Osborne and Dillon 2008 , p.9).
However, questions such as what should be the emphasis on pre-service and in-service science teacher training, especially with the new emphasis on scientific practices, still remain unanswered. As Bybee ( 2014 ) argues, starting from the new emphasis on scientific practices in the NGSS, we should consider teacher preparation programs “that would provide undergraduates opportunities to learn the science content and practices in contexts that would be aligned with their future work as teachers” (p.218). Therefore, engaging pre- and in-service teachers in visualization as a scientific practice should be one of the purposes of teacher preparation programs.
Achieve. (2013). The next generation science standards (pp. 1–3). Retrieved from http://www.nextgenscience.org/ .
Google Scholar
Barber, J, Pearson, D, & Cervetti, G. (2006). Seeds of science/roots of reading . California: The Regents of the University of California.
Bungum, B. (2008). Images of physics: an explorative study of the changing character of visual images in Norwegian physics textbooks. NorDiNa, 4 (2), 132–141.
Bybee, RW. (2014). NGSS and the next generation of science teachers. Journal of Science Teacher Education, 25 (2), 211–221. doi: 10.1007/s10972-014-9381-4 .
Article Google Scholar
Chambers, D. (1983). Stereotypic images of the scientist: the draw-a-scientist test. Science Education, 67 (2), 255–265.
Cochran-Smith, M. (2004). The problem of teacher education. Journal of Teacher Education, 55 (4), 295–299. doi: 10.1177/0022487104268057 .
Conway, PF, Murphy, R, & Rath, A. (2009). Learning to teach and its implications for the continuum of teacher education: a nine-country cross-national study .
Crick, F. (1988). What a mad pursuit . USA: Basic Books.
Dimopoulos, K, Koulaidis, V, & Sklaveniti, S. (2003). Towards an analysis of visual images in school science textbooks and press articles about science and technology. Research in Science Education, 33 , 189–216.
Dori, YJ, Tal, RT, & Tsaushu, M. (2003). Teaching biotechnology through case studies—can we improve higher order thinking skills of nonscience majors? Science Education, 87 (6), 767–793. doi: 10.1002/sce.10081 .
Duschl, RA, & Bybee, RW. (2014). Planning and carrying out investigations: an entry to learning and to teacher professional development around NGSS science and engineering practices. International Journal of STEM Education, 1 (1), 12. doi: 10.1186/s40594-014-0012-6 .
Duschl, R., Schweingruber, H. A., & Shouse, A. (2008). Taking science to school . Washington DC: National Academies Press.
Erduran, S, & Jimenez-Aleixandre, MP (Eds.). (2008). Argumentation in science education: perspectives from classroom-based research . Dordrecht: Springer.
Eurydice. (2012). Developing key competencies at school in Europe: challenges and opportunities for policy – 2011/12 (pp. 1–72).
Evagorou, M, Jimenez-Aleixandre, MP, & Osborne, J. (2012). “Should we kill the grey squirrels?” A study exploring students’ justifications and decision-making. International Journal of Science Education, 34 (3), 401–428. doi: 10.1080/09500693.2011.619211 .
Faraday, M. (1852a). Experimental researches in electricity. – Twenty-eighth series. Philosophical Transactions of the Royal Society of London, 142 , 25–56.
Faraday, M. (1852b). Experimental researches in electricity. – Twenty-ninth series. Philosophical Transactions of the Royal Society of London, 142 , 137–159.
Gilbert, JK. (2010). The role of visual representations in the learning and teaching of science: an introduction (pp. 1–19).
Gilbert, J., Reiner, M. & Nakhleh, M. (2008). Visualization: theory and practice in science education . Dordrecht, The Netherlands: Springer.
Gooding, D. (2006). From phenomenology to field theory: Faraday’s visual reasoning. Perspectives on Science, 14 (1), 40–65.
Gooding, D, Pinch, T, & Schaffer, S (Eds.). (1993). The uses of experiment: studies in the natural sciences . Cambridge: Cambridge University Press.
Hogan, K, & Maglienti, M. (2001). Comparing the epistemological underpinnings of students’ and scientists’ reasoning about conclusions. Journal of Research in Science Teaching, 38 (6), 663–687.
Knorr Cetina, K. (1999). Epistemic cultures: how the sciences make knowledge . Cambridge: Harvard University Press.
Korfiatis, KJ, Stamou, AG, & Paraskevopoulos, S. (2003). Images of nature in Greek primary school textbooks. Science Education, 88 (1), 72–89. doi: 10.1002/sce.10133 .
Latour, B. (2011). Visualisation and cognition: drawing things together (pp. 1–32).
Latour, B, & Woolgar, S. (1979). Laboratory life: the construction of scientific facts . Princeton: Princeton University Press.
Lehrer, R, & Schauble, L. (2012). Seeding evolutionary thinking by engaging children in modeling its foundations. Science Education, 96 (4), 701–724. doi: 10.1002/sce.20475 .
Longino, H. E. (2002). The fate of knowledge . Princeton: Princeton University Press.
Lynch, M. (2006). The production of scientific images: vision and re-vision in the history, philosophy, and sociology of science. In L Pauwels (Ed.), Visual cultures of science: rethinking representational practices in knowledge building and science communication (pp. 26–40). Lebanon, NH: Darthmouth College Press.
Lynch, M. & S. Y. Edgerton Jr. (1988). ‘Aesthetic and digital image processing representational craft in contemporary astronomy’, in G. Fyfe & J. Law (eds), Picturing Power; Visual Depictions and Social Relations (London, Routledge): 184 – 220.
Mendonça, PCC, & Justi, R. (2013). An instrument for analyzing arguments produced in modeling-based chemistry lessons. Journal of Research in Science Teaching, 51 (2), 192–218. doi: 10.1002/tea.21133 .
National Research Council (2000). Inquiry and the national science education standards . Washington DC: National Academies Press.
National Research Council (2012). A framework for K-12 science education . Washington DC: National Academies Press.
Nersessian, NJ. (1984). Faraday to Einstein: constructing meaning in scientific theories . Dordrecht: Martinus Nijhoff Publishers.
Book Google Scholar
Nersessian, NJ. (1992). How do scientists think? Capturing the dynamics of conceptual change in science. In RN Giere (Ed.), Cognitive Models of Science (pp. 3–45). Minneapolis: University of Minnesota Press.
Nersessian, NJ. (2008). Creating scientific concepts . Cambridge: The MIT Press.
Osborne, J. (2014). Teaching scientific practices: meeting the challenge of change. Journal of Science Teacher Education, 25 (2), 177–196. doi: 10.1007/s10972-014-9384-1 .
Osborne, J. & Dillon, J. (2008). Science education in Europe: critical reflections . London: Nuffield Foundation.
Papaevripidou, M, Constantinou, CP, & Zacharia, ZC. (2007). Modeling complex marine ecosystems: an investigation of two teaching approaches with fifth graders. Journal of Computer Assisted Learning, 23 (2), 145–157. doi: 10.1111/j.1365-2729.2006.00217.x .
Pauwels, L. (2006). A theoretical framework for assessing visual representational practices in knowledge building and science communications. In L Pauwels (Ed.), Visual cultures of science: rethinking representational practices in knowledge building and science communication (pp. 1–25). Lebanon, NH: Darthmouth College Press.
Philips, L., Norris, S. & McNab, J. (2010). Visualization in mathematics, reading and science education . Dordrecht, The Netherlands: Springer.
Pocovi, MC, & Finlay, F. (2002). Lines of force: Faraday’s and students’ views. Science & Education, 11 , 459–474.
Richards, A. (2003). Argument and authority in the visual representations of science. Technical Communication Quarterly, 12 (2), 183–206. doi: 10.1207/s15427625tcq1202_3 .
Rothbart, D. (1997). Explaining the growth of scientific knowledge: metaphors, models and meaning . Lewiston, NY: Mellen Press.
Ruivenkamp, M, & Rip, A. (2010). Visualizing the invisible nanoscale study: visualization practices in nanotechnology community of practice. Science Studies, 23 (1), 3–36.
Ryu, S, Han, Y, & Paik, S-H. (2015). Understanding co-development of conceptual and epistemic understanding through modeling practices with mobile internet. Journal of Science Education and Technology, 24 (2-3), 330–355. doi: 10.1007/s10956-014-9545-1 .
Sarkar, S, & Pfeifer, J. (2006). The philosophy of science, chapter on experimentation (Vol. 1, A-M). New York: Taylor & Francis.
Schwartz, RS, Lederman, NG, & Abd-el-Khalick, F. (2012). A series of misrepresentations: a response to Allchin’s whole approach to assessing nature of science understandings. Science Education, 96 (4), 685–692. doi: 10.1002/sce.21013 .
Schwarz, CV, Reiser, BJ, Davis, EA, Kenyon, L, Achér, A, Fortus, D, et al. (2009). Developing a learning progression for scientific modeling: making scientific modeling accessible and meaningful for learners. Journal of Research in Science Teaching, 46 (6), 632–654. doi: 10.1002/tea.20311 .
Watson, J. (1968). The Double Helix: a personal account of the discovery of the structure of DNA . New York: Scribner.
Watson, J, & Berry, A. (2004). DNA: the secret of life . New York: Alfred A. Knopf.
Wickman, PO. (2004). The practical epistemologies of the classroom: a study of laboratory work. Science Education, 88 , 325–344.
Wu, HK, & Shah, P. (2004). Exploring visuospatial thinking in chemistry learning. Science Education, 88 (3), 465–492. doi: 10.1002/sce.10126 .
Download references
Acknowledgements
The authors would like to acknowledge all reviewers for their valuable comments that have helped us improve the manuscript.
Author information
Authors and affiliations.
University of Nicosia, 46, Makedonitissa Avenue, Egkomi, 1700, Nicosia, Cyprus
Maria Evagorou
University of Limerick, Limerick, Ireland
Sibel Erduran
University of Tampere, Tampere, Finland
Terhi Mäntylä
You can also search for this author in PubMed Google Scholar
Corresponding author
Correspondence to Maria Evagorou .
Additional information
Competing interests.
The authors declare that they have no competing interests.
Authors’ contributions
ME carried out the introductory literature review, the analysis of the first case study, and drafted the manuscript. SE carried out the analysis of the third case study and contributed towards the “Conclusions” section of the manuscript. TM carried out the second case study. All authors read and approved the final manuscript.
Rights and permissions
Open Access This article is distributed under the terms of the Creative Commons Attribution 4.0 International License ( https://creativecommons.org/licenses/by/4.0 ), which permits use, duplication, adaptation, distribution, and reproduction in any medium or format, as long as you give appropriate credit to the original author(s) and the source, provide a link to the Creative Commons license, and indicate if changes were made.
Reprints and permissions
About this article
Cite this article.
Evagorou, M., Erduran, S. & Mäntylä, T. The role of visual representations in scientific practices: from conceptual understanding and knowledge generation to ‘seeing’ how science works. IJ STEM Ed 2 , 11 (2015). https://doi.org/10.1186/s40594-015-0024-x
Download citation
Received : 29 September 2014
Accepted : 16 May 2015
Published : 19 July 2015
DOI : https://doi.org/10.1186/s40594-015-0024-x
Share this article
Anyone you share the following link with will be able to read this content:
Sorry, a shareable link is not currently available for this article.
Provided by the Springer Nature SharedIt content-sharing initiative
- Visual representations
- Epistemic practices
- Science learning
Visual representation in solving mathematics problems
- Article contents
- Figures & tables
- Supplementary Data
- Peer Review
- Reprints and Permissions
- Cite Icon Cite
- Search Site
Mohamad Rif'at , Nilamsari Kusumastuti , Nurfadilah Siregar; Visual representation in solving mathematics problems. AIP Conf. Proc. 13 July 2022; 2577 (1): 020055. https://doi.org/10.1063/5.0096126
Download citation file:
- Ris (Zotero)
- Reference Manager
It explores an experimental design that implemented teaching and learning based on visual thinking to solve math problems. There are three treatments in solving the problems: picturing, expressing the algebraic relationship, and constructing ide from the visual representation. There is no difference in students' performance in visualizing, but significantly different after the last two actions. That is 1) Visual thinking used for reasoning in constructing algebraic expression; 2) The visual and algebraic thinking applied alternately; 3) The two kinds of thinking are not hierarchical, but inadequate relation; 4) Solving the problem always start from visual thinking, and then thinking algebraically; 5) Visual construction is a mental process, as an abstraction of systematic reflective visualization. The recommendations are 1) In teaching and learning, mathematics should be by using visual representation; 2) The mathematics content knowledge by visualizing is an integrated learning activity. The orientation is in developing creativity and thinking alternatively.
Sign in via your Institution
Citing articles via, publish with us - request a quote.

Sign up for alerts
- Online ISSN 1551-7616
- Print ISSN 0094-243X
- For Researchers
- For Librarians
- For Advertisers
- Our Publishing Partners
- Physics Today
- Conference Proceedings
- Special Topics
pubs.aip.org
- Privacy Policy
- Terms of Use
Connect with AIP Publishing
This feature is available to subscribers only.
Sign In or Create an Account
Word problem solving and pictorial representations: insights from an exploratory study in kindergarten
- Original Article
- Published: 29 November 2019
- Volume 52 , pages 17–31, ( 2020 )
Cite this article

- Iliada Elia ORCID: orcid.org/0000-0002-0072-4178 1
1036 Accesses
4 Citations
1 Altmetric
Explore all metrics
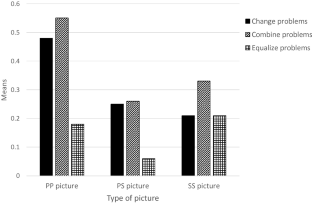
The aim of this study was to investigate how pictorial representations with different semiotic characteristics affect additive word problem solving by kindergartners. The focus of the study is on three categories of additive problems (change problems, combine problems and equalize problems) and on representational pictures with different semiotic characteristics: (a) pictures in which the problem quantities are represented in pictorial form, that is, as groups of illustrated objects (PP pictures), (b) pictures in which the quantities are represented partly in pictorial form and in symbolic form (PS pictures), and (c) pictures in which the quantities are represented in symbolic form (SS pictures). Data were collected from 63 kindergartners using a paper-and-pencil test. Results showed that the semiotic characteristics of representational pictures had a strong and significant effect on performance. Children’s performance was higher in the problems with PP pictures but declined in the problems with PS and SS pictures. However, the differences in children’s performance across the problems with different representational format varied between the problem categories and their mathematical structures. The semiotic characteristics of representational pictures had an important role in the establishment of close relations between children’s solutions in problems in different categories. Detailed analysis of children’s answers to the problems revealed a number of picture-related difficulties. Findings are discussed and directions for future research are drawn considering the methodological limitations of the study.
This is a preview of subscription content, log in via an institution to check access.
Access this article
Price includes VAT (Russian Federation)
Instant access to the full article PDF.
Rent this article via DeepDyve
Institutional subscriptions
Note The thickness of an arrow indicates the estimated probability of a correctly identified implicative relationship; thick arrow: p > 0.95, thin arrow: p > 0.90
Simple pictorial mathematics problems for children: locating sources of cognitive load and how to reduce it

The Effect of Interactive Picturebook Reading on Problem-Solving Skills in Preschool: A Quasi-Experiment

The role of relational preference in word-problem solving in 6- to 7-year-olds
Based on earlier studies (e.g., De Corte and Verschaffel 1987 ), in the present study a change or a combine problem is classified as an addition or a subtraction problem when the arithmetic solution (mathematical operation) of the problem is represented by addition or subtraction, respectively. The arithmetic solution may differ from the action described in the problem depending on the problem’s semantic structure (see Sect. 2 ).
Bodin, A., Coutourier, R., & Gras, R. (2000). CHIC: Classification hiérarchique implicative et cohésive - Version sous Windows — CHIC 1.2. Rennes: Association pour la Recherche en Didactique des Mathématiques.
Briars, D. J., & Larkin, J. H. (1984). An integrated model of skill in solving elementary problems. Cognition and Instruction, 1, 245–296.
Article Google Scholar
Carpenter, T. P., Ansell, E., Franke, M. L., Fennema, E., & Weisbeck, L. (1993). Models of problem solving: a study of kindergarten children’s problem-solving processes. Journal for Research in Mathematics Education, 24, 428–441.
Carpenter, T. P., & Moser, J. M. (1982). The development of addition and subtraction problem-solving skills. In T. P. Carpenter, J. M. Moser, & T. A. Romberg (Eds.), Addition and subtraction: A cognitive perspective (pp. 9–24). Hillsdale: Lawrence Erlbaurn Associates.
Google Scholar
Cyprus Ministry of Education and Culture. (2010). Program of studies in mathematics . Nicosia: Cyprus Ministry of Education and Culture.
Daroczy, G., Wolska, M., Meurers, W. D., & Nuerk, H. C. (2015). Word problems: a review of linguistic and numerical factors contributing to their difficulty. Frontiers in Psychology, 6, 348.
De Corte, E., & Verschaffel, L. (1985). Beginning first graders’ initial representation of arithmetic word problems. Journal of Mathematical Behavior, 4, 3–21.
De Corte, E., & Verschaffel, L. (1987). The effect of semantic structure on first graders’ solution strategies of elementary addition and subtraction word problems. Journal for Research in Mathematics Education, 18, 363–381.
De Corte, E., & Verschaffel, L. (1988). Computer simulation as a tool in research on problem solving in subject-matter domains. The International Journal of Educational Research, 12, 49–69.
De Corte, E., Verschaffel, L., & De Win, L. (1985). The influence of rewording verbal problems on children’s problem representations and solution. Journal of Educational Psychology, 77, 460–470.
Dewolf, T., Van Dooren, W., Ev Cimen, E., & Verschaffel, L. (2014). The impact of illustrations and warnings on solving mathematical word problems realistically. The Journal of Experimental Education, 82 (1), 103–120.
Elia, I., Gagatsis, A., & Demetriou, A. (2007). The effects of different modes of representation on the solution of one-step additive problems. Learning and Instruction, 17, 658–672.
Elia, I., & Philippou, G. (2004). The functions of pictures in problem solving. In M. Johnsen Høines & A. Berit Fuglestad (Eds.), Proceedings of the 28th Conference of the International Group for the Psychology of Mathematics Education (Vol. 2, pp. 327–334). Bergen: PME.
Elia, I., & Van den Heuvel-Panhuizen, M. (2015). Mapping kindergartners’ number competence. In X. Sun, B. Kaur & J. Novotná (Eds.), Proceedings of the twenty - third ICMI Study: Primary mathematics study on whole numbers (pp. 177–185). Macau: University of Macau
Ginsburg, H. P., Klein, A., & Starkey, P. (1998). The development of children’s mathematical thinking: Connecting research with practice. In I. Sigel & A. Renninger (Eds.), Handbook of child psychology (5th ed., Vol. 4, pp. 401–476). New York: Wiley.
Lahanier-Reuter, D. (2008). Didactics of mathematics and implicative statistical analysis. In R. Gras, E. Suzuki, F. Guillet, & F. Spagnolo (Eds.), Studies in computational intelligence 127: Statistical implicative analysis (pp. 277–298). Heidelberg: Springer-Verlag.
Chapter Google Scholar
Li, Y., Zhang, M., Chen, Y., Deng, Z., Zhu, X., & Yan, S. (2018). Children’s non-symbolic and symbolic numerical representations and their associations with mathematical ability. Frontiers in Psychology, 9, 1035.
Li, Y., Zhang, M., Chen, Y., Zhu, X., Deng, Z., & Yan, S. (2017). Children’s non-symbolic, symbolic addition and their mapping capacity at 4–7 years old. Frontiers in Psychology, 8, 1203.
Libertus, M. E., Feigenson, L., & Halberda, J. (2011). Preschool acuity of the approximate number system correlates with school math ability. Developmental Science, 14, 1292–1300.
Lyons, I. M., Bugden, S., Zheng, S., De Jesus, S., & Ansari, D. (2018). Symbolic number skills predict growth in non-symbolic number skills in kindergarteners. Developmental Psychology, 54 (3), 440–457.
Matalliotaki, E. (2012). Resolution of division problems by young children: What are children capable of and under which conditions? European Early Childhood Education Research Journal, 20 (2), 283–299.
Mayer, R. E. (2003). The promise of multimedia learning: using the same instructional design methods across different media. Learning and Instruction, 13, 125–139.
Múñez, D., Orrantia, J., & Rosales, J. (2013). The effect of external representations on compare word problems: Supporting mental model construction. The Journal of Experimental Education, 81 (3), 337–355.
Nesher, P., Greeno, J. G., & Riley, M. S. (1982). The development of semantic categories for addition and subtraction. Educational Studies in Mathematics, 13, 373–394.
Nistal, A. A., Van Dooren, W., Clarebout, G., Elen, J., & Verschaffel, L. (2009). Conceptualising, investigating and stimulating representational flexibility in mathematical problem solving and learning: a critical review. ZDM - The International Journal on Mathematics Education, 41 (5), 627–636.
Riley, M. S., & Greeno, J. G. (1988). Developmental analysis of understanding language about quantities and of solving problems. Cognition and Instruction, 5 (1), 49–101.
Schnotz, W., & Bannert, M. (2003). Construction and interference in learning from multiple representation. Learning and Instruction, 13, 141–156.
Sophian, C., & Vong, K. I. (1995). The parts and wholes of arithmetic story problems: developing knowledge in the preschool years. Cognition and Instruction, 13 (3), 469–477.
Sweller, J. (1994). Cognitive load theory, learning difficulty, and instructional design. Learning and Instruction, 4, 295–312.
Van den Heuvel-Panhuizen, M. (1996). Assessment and realistic mathematics education . Utrecht: CD-β Press, Center for Science and Mathematics Education.
Verschaffel, L., & De Corte, E. (1997). Word problems. A vehicle for promoting authentic mathematical understanding and problem solving in the primary school. In T. Nunes & P. Bryant (Eds.), Learning and teaching mathematics: An international perspective (pp. 69–97). Hove: Psychology Press.
Download references
Acknowledgements
The study reported in this paper was supported by the University of Cyprus (start-up funding).
Author information
Authors and affiliations.
Department of Education, University of Cyprus, Nicosia, Cyprus
Iliada Elia
You can also search for this author in PubMed Google Scholar
Corresponding author
Correspondence to Iliada Elia .
Additional information
Publisher's note.
Springer Nature remains neutral with regard to jurisdictional claims in published maps and institutional affiliations.
Sample of items
Change problems

Combine problems

Equalize problems

Rights and permissions
Reprints and permissions
About this article
Elia, I. Word problem solving and pictorial representations: insights from an exploratory study in kindergarten. ZDM Mathematics Education 52 , 17–31 (2020). https://doi.org/10.1007/s11858-019-01113-0
Download citation
Accepted : 22 November 2019
Published : 29 November 2019
Issue Date : April 2020
DOI : https://doi.org/10.1007/s11858-019-01113-0
Share this article
Anyone you share the following link with will be able to read this content:
Sorry, a shareable link is not currently available for this article.
Provided by the Springer Nature SharedIt content-sharing initiative
- Word problems
- Representational pictures
- Kindergartners
- Subtraction
- Find a journal
- Publish with us
- Track your research
Help | Advanced Search
Computer Science > Computer Vision and Pattern Recognition
Title: visiongraph: leveraging large multimodal models for graph theory problems in visual context.
Abstract: Large Multimodal Models (LMMs) have achieved impressive success in visual understanding and reasoning, remarkably improving the performance of mathematical reasoning in a visual context. Yet, a challenging type of visual math lies in the multimodal graph theory problem, which demands that LMMs understand the graphical structures accurately and perform multi-step reasoning on the visual graph. Additionally, exploring multimodal graph theory problems will lead to more effective strategies in fields like biology, transportation, and robotics planning. To step forward in this direction, we are the first to design a benchmark named VisionGraph, used to explore the capabilities of advanced LMMs in solving multimodal graph theory problems. It encompasses eight complex graph problem tasks, from connectivity to shortest path problems. Subsequently, we present a Description-Program-Reasoning (DPR) chain to enhance the logical accuracy of reasoning processes through graphical structure description generation and algorithm-aware multi-step reasoning. Our extensive study shows that 1) GPT-4V outperforms Gemini Pro in multi-step graph reasoning; 2) All LMMs exhibit inferior perception accuracy for graphical structures, whether in zero/few-shot settings or with supervised fine-tuning (SFT), which further affects problem-solving performance; 3) DPR significantly improves the multi-step graph reasoning capabilities of LMMs and the GPT-4V (DPR) agent achieves SOTA performance.
Submission history
Access paper:.
- HTML (experimental)
- Other Formats
References & Citations
- Google Scholar
- Semantic Scholar
BibTeX formatted citation
Bibliographic and Citation Tools
Code, data and media associated with this article, recommenders and search tools.
- Institution
arXivLabs: experimental projects with community collaborators
arXivLabs is a framework that allows collaborators to develop and share new arXiv features directly on our website.
Both individuals and organizations that work with arXivLabs have embraced and accepted our values of openness, community, excellence, and user data privacy. arXiv is committed to these values and only works with partners that adhere to them.
Have an idea for a project that will add value for arXiv's community? Learn more about arXivLabs .
- Astrology News
- Horoscope News
Virgo, Horoscope Today, May 14, 2024: Ideal day for problem-solving

About the Author
AstroDevam is a premium organisation providing ancient and authentic knowledge of Astrology, Vastu, Numerology, and Innovative Corporate Solutions with a contemporary perspective. AstroDevam, having patrons in more than 100 countries, has been promoted by Achary Anita Baranwal and Achary Kalki Krishnan, who not only have Master's Degrees in Astrology, but are engaged in teaching Scientific Astrology, Vastu, and Numerology for more than three decades. Read More
Visual Stories

IMAGES
VIDEO
COMMENTS
Page 5: Visual Representations. Yet another evidence-based strategy to help students learn abstract mathematics concepts and solve problems is the use of visual representations. More than simply a picture or detailed illustration, a visual representation—often referred to as a schematic representation or schematic diagram— is an accurate ...
types of visual representations interact with student characteristics and the problem-solving task. eyords Problem Solving Mathematics te[tbooNs Xse a Zide variety of visXal representations, inclding diagrams, tables, graphs, decorative images, and photographs. Given stdents fr eent se of tetboos and the large nmber of
Problem Solving Mary Hegarty and Maria Kozhevnikov University of California, Santa Barbara Although visual-spatial representations are used extensively in mathematics and spatial ability is highly correlated with success in mathematics education, research to date has not demonstrated a clear relationship between use of visual-spatial ...
The power of the visual representation made all the difference for these students, and being able to sequence through the problem using the visual supports completely changed the interactions they were having with the problem. ... but to unlock my thinking I had to commit to finding a way to represent the problem in a visual way. Asking ...
Using results from a controlled experiment and simulations based on cognitive models, we show that visual presentation style can have a significant impact on performance in a complex problem-solving task. We compared subject performances in two isomorphic, but visually different, tasks based on a card game of SET. Although subjects used the same strategy in both tasks, the difference in ...
an instructional treatment in which abstract and concrete visual problem representations were combined. Role of Visual Representations in Problem Solving One approach is to develop a general problem-solving model that can be applied to a diversity of problem categories and problem domains (Anderson, 1993; Bransford & Stein, 1984;
These three core strategies—visual representations, multiple approaches to problems, and mathematical notation—are the teacher's primary tools for taking advantage of the instructional opportunities available when problem solving. All three can be applied at all grade levels and with all mathematical topics.
Arguably, well-constructed visual representations could serve as an added scaffold for understanding and solving word problems. Dewolf, Van Dooren, Cimen, and Verschaffel (2014) examined how illustrations depicting the setting or action contained in the problem could foster student success.
Through visual learning, there is an increase in students' visual abilities in solving problems that require visual representation. Pattern 1 emphasizes the activity of visualizing the problem ...
Keywords: Representations, problem solving, argumentation, solution representation. ... Some researchers pointed out that visual representations play an important role in supporting reflection and as a tool of communicating mathematical ideas (Arcavi, 2003; Gagatsis et. all, 2010; Sfard, 1991). ...
The use of visual representations (i.e., photographs, diagrams, models) has been part of science, and their use makes it possible for scientists to interact with and represent complex phenomena, not observable in other ways. Despite a wealth of research in science education on visual representations, the emphasis of such research has mainly been on the conceptual understanding when using ...
representations in problem solving is a good way of learning and that it increase s the ... Students were assessed on measures of mathematical problem solving, visual imagery representation, and ...
Fig. 1.Example drawings by learners. Panel (a) shows a drawing created by a learner after reading about the law of action and reaction in swimming (Schmidgall et al., 2019).Panel (b) shows a drawing by a physics student asked to invent a three-dimensional depiction of a quantum-mechanical wave function they had previously encountered only in one-dimensional and two-dimensional depictions ...
Although visual-spatial representations are used extensively in mathematics and spatial ability is highly correlated with success in mathematics education, research to date has not demonstrated a clear relationship between use of visual-spatial representations and success in mathematical problem solving. The authors distinguished 2 types of visual-spatial representations: schematic ...
In the second part, written solutions to problems and verbal protocols of problem-solving episodes are analyzed to determine the frequency, nature, and function of the visual representations actually used during problem solving. Experts construct visual representations more frequently than do novices and use them as dynamic objects to explore ...
There are three treatments in solving the problems: picturing, expressing the algebraic relationship, and constructing ide from the visual representation. There is no difference in students' performance in visualizing, but significantly different after the last two actions. That is 1) Visual thinking used for reasoning in constructing algebraic ...
In 3 experiments, we examined the effects of using concrete and/or abstract visual problem representations during instruction on students' problem-solving practice, near transfer, problem representations, and learning perceptions. In Experiments 1 and 2, novice students learned about electrical circuit analysis with an instructional program that included worked-out and practice problems ...
Research on learning with multiple modalities investigated the potential of visual representations together with oral or written text to enhance the understanding of a topic under study (e.g., Mayer 2003).Considering the effectiveness of visual representations in mathematical problem solving, on the one hand, visual representations may be beneficial to the problem solving process (Matalliotaki ...
The purpose of this study was to investigate students' use of visual imagery while solving mathematical problems. Students with learning disabilities (LD), average achievers, and gifted students in sixth grade (N= 66) participated in this study.Students were assessed on measures of mathematical problem solving and visual-spatial representation.
Creating visual representations should not be seen as an additional aid to problem solving but as a process developed by students and forming part of the problem solving process (Ergan, 2018). ...
Expert mathematicians are contrasted with undergraduate students through a two-part analysis of the potential and actual use of visual representations in problem solving. In the first part, a classification task is used to indicate the extent to which visual representations are perceived as having potential utility for advanced mathematical problem solving. The analysis reveals that both ...
Large Multimodal Models (LMMs) have achieved impressive success in visual understanding and reasoning, remarkably improving the performance of mathematical reasoning in a visual context. Yet, a challenging type of visual math lies in the multimodal graph theory problem, which demands that LMMs understand the graphical structures accurately and perform multi-step reasoning on the visual graph ...
A computational model for solving problems from the Raven's Progressive Matrices intelligence test using iconic visual representations. We describe a computational model for solving problems from Raven's Progressive Matrices (RPM), a family of standardized intelligence tests. Existing computational models for solving RPM problems generally ...
Although visual-spatial representations are used extensively in mathematics and spatial ability is highly correlated with success in mathematics education, research to date has not demonstrated a clear relationship between use of visual-spatial representations and success in mathematical problem solving. The authors distinguished 2 types of visual-spatial representations: schematic ...
Horoscope(Old) News: Virgo excels with planetary alignments, enhancing analytical skills. Ideal for problem-solving. Reserved nature challenged by deeper emotional connect
The purpose of this study was to investigate students' use of visual imagery while solving mathematical problems. Students with learning disabilities (LD), average achievers, and gifted students in sixth grade (N = 66) participated in this study. Students were assessed on measures of mathematical problem solving and visual-spatial representation. Visual-spatial representations were coded as ...