
10 Real-Life Experimental Research Examples

Experimental research is research that involves using a scientific approach to examine research variables.
Below are some famous experimental research examples. Some of these studies were conducted quite a long time ago. Some were so controversial that they would never be attempted today. And some were so unethical that they would never be permitted again.
A few of these studies have also had very practical implications for modern society involving criminal investigations, the impact of television and the media, and the power of authority figures.
Examples of Experimental Research
1. pavlov’s dog: classical conditioning.
Dr. Ivan Pavlov was a physiologist studying animal digestive systems in the 1890s. In one study, he presented food to a dog and then collected its salivatory juices via a tube attached to the inside of the animal’s mouth.
As he was conducting his experiments, an annoying thing kept happening; every time his assistant would enter the lab with a bowl of food for the experiment, the dog would start to salivate at the sound of the assistant’s footsteps.
Although this disrupted his experimental procedures, eventually, it dawned on Pavlov that something else was to be learned from this problem.
Pavlov learned that animals could be conditioned into responding on a physiological level to various stimuli, such as food, or even the sound of the assistant bringing the food down the hall.
Hence, the creation of the theory of classical conditioning. One of the most influential theories in psychology still to this day.
2. Bobo Doll Experiment: Observational Learning
Dr. Albert Bandura conducted one of the most influential studies in psychology in the 1960s at Stanford University.
His intention was to demonstrate that cognitive processes play a fundamental role in learning. At the time, Behaviorism was the predominant theoretical perspective, which completely rejected all inferences to constructs not directly observable .
So, Bandura made two versions of a video. In version #1, an adult behaved aggressively with a Bobo doll by throwing it around the room and striking it with a wooden mallet. In version #2, the adult played gently with the doll by carrying it around to different parts of the room and pushing it gently.
After showing children one of the two versions, they were taken individually to a room that had a Bobo doll. Their behavior was observed and the results indicated that children that watched version #1 of the video were far more aggressive than those that watched version #2.
Not only did Bandura’s Bobo doll study form the basis of his social learning theory, it also helped start the long-lasting debate about the harmful effects of television on children.
Worth Checking Out: What’s the Difference between Experimental and Observational Studies?
3. The Asch Study: Conformity
Dr. Solomon Asch was interested in conformity and the power of group pressure. His study was quite simple. Different groups of students were shown lines of varying lengths and asked, “which line is longest.”
However, out of each group, only one was an actual participant. All of the others in the group were working with Asch and instructed to say that one of the shorter lines was actually the longest.
Nearly every time, the real participant gave an answer that was clearly wrong, but the same as the rest of the group.
The study is one of the most famous in psychology because it demonstrated the power of social pressure so clearly.
4. Car Crash Experiment: Leading Questions
In 1974, Dr. Elizabeth Loftus and her undergraduate student John Palmer designed a study to examine how fallible human judgement is under certain conditions.
They showed groups of research participants videos that depicted accidents between two cars. Later, the participants were asked to estimate the rate of speed of the cars.
Here’s the interesting part. All participants were asked the same question with the exception of a single word: “How fast were the two cars going when they ______into each other?” The word in the blank varied in its implied severity.
Participants’ estimates were completely affected by the word in the blank. When the word “smashed” was used, participants estimated the cars were going much faster than when the word “contacted” was used.
This line of research has had a huge impact on law enforcement interrogation practices, line-up procedures, and the credibility of eyewitness testimony .
5. The 6 Universal Emotions
The research by Dr. Paul Ekman has been influential in the study of emotions. His early research revealed that all human beings, regardless of culture, experience the same 6 basic emotions: happiness, sadness, disgust, fear, surprise, and anger.
In the late 1960s, Ekman traveled to Papua New Guinea. He approached a tribe of people that were extremely isolated from modern culture. With the help of a guide, he would describe different situations to individual members and take a photo of their facial expressions.
The situations included: if a good friend had come; their child had just died; they were about to get into a fight; or had just stepped on a dead pig.
The facial expressions of this highly isolated tribe were nearly identical to those displayed by people in his studies in California.
6. The Little Albert Study: Development of Phobias
Dr. John Watson and Dr. Rosalie Rayner sought to demonstrate how irrational fears were developed.
Their study involved showing a white rat to an infant. Initially, the child had no fear of the rat. However, the researchers then began to create a loud noise each time they showed the child the rat by striking a steel bar with a hammer.
Eventually, the child started to cry and feared the white rat. The child also developed a fear of other white, furry objects such as white rabbits and a Santa’s beard.
This study is famous because it demonstrated one way in which phobias are developed in humans, and also because it is now considered highly unethical for its mistreatment of children, lack of study debriefing , and intent to instil fear.
7. A Class Divided: Discrimination
Perhaps one of the most famous psychological experiments of all time was not conducted by a psychologist. In 1968, third grade teacher Jane Elliott conducted one of the most famous studies on discrimination in history. It took place shortly after the assassination of Dr. Martin Luther King, Jr.
She divided her class into two groups: brown-eyed and blue-eyed students. On the first day of the experiment, she announced the blue-eyed group as superior. They received extra privileges and were told not to intermingle with the brown-eyed students.
They instantly became happier, more self-confident, and started performing better academically.
The next day, the roles were reversed. The brown-eyed students were announced as superior and given extra privileges. Their behavior changed almost immediately and exhibited the same patterns as the other group had the day before.
This study was a remarkable demonstration of the harmful effects of discrimination.
8. The Milgram Study: Obedience to Authority
Dr. Stanley Milgram conducted one of the most influential experiments on authority and obedience in 1961 at Yale University.
Participants were told they were helping study the effects of punishment on learning. Their job was to administer an electric shock to another participant each time they made an error on a test. The other participant was actually an actor in another room that only pretended to be shocked.
However, each time a mistake was made, the level of shock was supposed to increase, eventually reaching quite high voltage levels. When the real participants expressed reluctance to administer the next level of shock, the experimenter, who served as the authority figure in the room, pressured the participant to deliver the next level of shock.
The results of this study were truly astounding. A surprisingly high percentage of participants continued to deliver the shocks to the highest level possible despite the very strong objections by the “other participant.”
This study demonstrated the power of authority figures.
9. The Marshmallow Test: Delay of Gratification
The Marshmallow Test was designed by Dr. Walter Mischel to examine the role of delay of gratification and academic success.
Children ages 4-6 years old were seated at a table with one marshmallow placed in front of them. The experimenter explained that if they did not eat the marshmallow, they would receive a second one. They could then eat both.
The children that were able to delay gratification the longest were rated as significantly more competent later in life and earned higher SAT scores than children that could not withstand the temptation.
The study has since been conceptually replicated by other researchers that have revealed additional factors involved in delay of gratification and academic achievement.
10. Stanford Prison Study: Deindividuation
Dr. Philip Zimbardo conducted one of the most famous psychological studies of all time in 1971. The purpose of the study was to investigate how the power structure in some situations can lead people to behave in ways highly uncharacteristic of their usual behavior.
College students were recruited to participate in the study. Some were randomly assigned to play the role of prison guard. The others were actually “arrested” by real police officers. They were blindfolded and taken to the basement of the university’s psychology building which had been converted to look like a prison.
Although the study was supposed to last 2 weeks, it had to be halted due to the abusive actions of the guards.
The study demonstrated that people will behave in ways they never thought possible when placed in certain roles and power structures. Although the Stanford Prison Study is so well-known for what it revealed about human nature, it is also famous because of the numerous violations of ethical principles.
The studies above are varied and focused on many different aspects of human behavior . However, each example of experimental research listed above has had a lasting impact on society. Some have had tremendous sway in how very practical matters are conducted, such as criminal investigations and legal proceedings.
Psychology is a field of study that is often not fully understood by the general public. When most people hear the term “psychology,” they think of a therapist that listens carefully to the revealing statements of a patient. The therapist then tries to help their patient learn to cope with many of life’s challenges. Nothing wrong with that.
In reality however, most psychologists are researchers. They spend most of their time designing and conducting experiments to enhance our understanding of the human condition.
Asch SE. (1956). Studies of independence and conformity: I. A minority of one against a unanimous majority . Psychological Monographs: General and Applied, 70 (9),1-70. https://doi.org/doi:10.1037/h0093718
Bandura A. (1965). Influence of models’ reinforcement contingencies on the acquisition of imitative responses. Journal of Personality and Social Psychology, 1 (6), 589-595. https://doi.org/doi:10.1037/h0022070
Beck, H. P., Levinson, S., & Irons, G. (2009). Finding little Albert: A journey to John B. Watson’s infant laboratory. American Psychologist, 64(7), 605-614.
Ekman, P. & Friesen, W. V. (1971). Constants Across Cultures in the Face and motion . Journal of Personality and Social Psychology, 17(2) , 124-129.
Loftus, E. F., & Palmer, J. C. (1974). Reconstruction of automobile destruction: An example of
the interaction between language and memory. Journal of Verbal Learning and Verbal
Behavior, 13 (5), 585–589.
Milgram S (1965). Some Conditions of Obedience and Disobedience to Authority. Human Relations, 18(1), 57–76.
Mischel, W., & Ebbesen, E. B. (1970). Attention in delay of gratification . Journal of Personality and Social Psychology, 16 (2), 329-337.
Pavlov, I.P. (1927). Conditioned Reflexes . London: Oxford University Press.
Watson, J. & Rayner, R. (1920). Conditioned emotional reactions. Journal of Experimental Psychology, 3 , 1-14. Zimbardo, P., Haney, C., Banks, W. C., & Jaffe, D. (1971). The Stanford Prison Experiment: A simulation study of the psychology of imprisonment . Stanford University, Stanford Digital Repository, Stanford.

Chris Drew (PhD)
Dr. Chris Drew is the founder of the Helpful Professor. He holds a PhD in education and has published over 20 articles in scholarly journals. He is the former editor of the Journal of Learning Development in Higher Education. [Image Descriptor: Photo of Chris]
- Chris Drew (PhD) https://helpfulprofessor.com/author/chris-drew-phd/ Social-Emotional Learning (Definition, Examples, Pros & Cons)
- Chris Drew (PhD) https://helpfulprofessor.com/author/chris-drew-phd/ What is Educational Psychology?
- Chris Drew (PhD) https://helpfulprofessor.com/author/chris-drew-phd/ What is IQ? (Intelligence Quotient)
- Chris Drew (PhD) https://helpfulprofessor.com/author/chris-drew-phd/ 5 Top Tips for Succeeding at University
Leave a Comment Cancel Reply
Your email address will not be published. Required fields are marked *
- - Google Chrome
Intended for healthcare professionals
- Access provided by Google Indexer
- My email alerts
- BMA member login
- Username * Password * Forgot your log in details? Need to activate BMA Member Log In Log in via OpenAthens Log in via your institution
Search form
- Advanced search
- Search responses
- Search blogs
- Beauty sleep:...
Beauty sleep: experimental study on the perceived health and attractiveness of sleep deprived people
- Related content
- Peer review
- John Axelsson , researcher 1 2 ,
- Tina Sundelin , research assistant and MSc student 2 ,
- Michael Ingre , statistician and PhD student 3 ,
- Eus J W Van Someren , researcher 4 ,
- Andreas Olsson , researcher 2 ,
- Mats Lekander , researcher 1 3
- 1 Osher Center for Integrative Medicine, Department of Clinical Neuroscience, Karolinska Institutet, 17177 Stockholm, Sweden
- 2 Division for Psychology, Department of Clinical Neuroscience, Karolinska Institutet
- 3 Stress Research Institute, Stockholm University, Stockholm
- 4 Netherlands Institute for Neuroscience, an Institute of the Royal Netherlands Academy of Arts and Sciences, and VU Medical Center, Amsterdam, Netherlands
- Correspondence to: J Axelsson john.axelsson{at}ki.se
- Accepted 22 October 2010
Objective To investigate whether sleep deprived people are perceived as less healthy, less attractive, and more tired than after a normal night’s sleep.
Design Experimental study.
Setting Sleep laboratory in Stockholm, Sweden.
Participants 23 healthy, sleep deprived adults (age 18-31) who were photographed and 65 untrained observers (age 18-61) who rated the photographs.
Intervention Participants were photographed after a normal night’s sleep (eight hours) and after sleep deprivation (31 hours of wakefulness after a night of reduced sleep). The photographs were presented in a randomised order and rated by untrained observers.
Main outcome measure Difference in observer ratings of perceived health, attractiveness, and tiredness between sleep deprived and well rested participants using a visual analogue scale (100 mm).
Results Sleep deprived people were rated as less healthy (visual analogue scale scores, mean 63 (SE 2) v 68 (SE 2), P<0.001), more tired (53 (SE 3) v 44 (SE 3), P<0.001), and less attractive (38 (SE 2) v 40 (SE 2), P<0.001) than after a normal night’s sleep. The decrease in rated health was associated with ratings of increased tiredness and decreased attractiveness.
Conclusion Our findings show that sleep deprived people appear less healthy, less attractive, and more tired compared with when they are well rested. This suggests that humans are sensitive to sleep related facial cues, with potential implications for social and clinical judgments and behaviour. Studies are warranted for understanding how these effects may affect clinical decision making and can add knowledge with direct implications in a medical context.
Introduction
The recognition [of the case] depends in great measure on the accurate and rapid appreciation of small points in which the diseased differs from the healthy state Joseph Bell (1837-1911)
Good clinical judgment is an important skill in medical practice. This is well illustrated in the quote by Joseph Bell, 1 who demonstrated impressive observational and deductive skills. Bell was one of Sir Arthur Conan Doyle’s teachers and served as a model for the fictitious detective Sherlock Holmes. 2 Generally, human judgment involves complex processes, whereby ingrained, often less consciously deliberated responses from perceptual cues are mixed with semantic calculations to affect decision making. 3 Thus all social interactions, including diagnosis in clinical practice, are influenced by reflexive as well as reflective processes in human cognition and communication.
Sleep is an essential homeostatic process with well established effects on an individual’s physiological, cognitive, and behavioural functionality 4 5 6 7 and long term health, 8 but with only anecdotal support of a role in social perception, such as that underlying judgments of attractiveness and health. As illustrated by the common expression “beauty sleep,” an individual’s sleep history may play an integral part in the perception and judgments of his or her attractiveness and health. To date, the concept of beauty sleep has lacked scientific support, but the biological importance of sleep may have favoured a sensitivity to perceive sleep related cues in others. It seems warranted to explore such sensitivity, as sleep disorders and disturbed sleep are increasingly common in today’s 24 hour society and often coexist with some of the most common health problems, such as hypertension 9 10 and inflammatory conditions. 11
To describe the relation between sleep deprivation and perceived health and attractiveness we asked untrained observers to rate the faces of people who had been photographed after a normal night’s sleep and after a night of sleep deprivation. We chose facial photographs as the human face is the primary source of information in social communication. 12 A perceiver’s response to facial cues, signalling the bearer’s emotional state, intentions, and potential mate value, serves to guide actions in social contexts and may ultimately promote survival. 13 14 15 We hypothesised that untrained observers would perceive sleep deprived people as more tired, less healthy, and less attractive compared with after a normal night’s sleep.
Using an experimental design we photographed the faces of 23 adults (mean age 23, range 18-31 years, 11 women) between 14.00 and 15.00 under two conditions in a balanced design: after a normal night’s sleep (at least eight hours of sleep between 23.00-07.00 and seven hours of wakefulness) and after sleep deprivation (sleep 02.00-07.00 and 31 hours of wakefulness). We advertised for participants at four universities in the Stockholm area. Twenty of 44 potentially eligible people were excluded. Reasons for exclusion were reported sleep disturbances, abnormal sleep requirements (for example, sleep need out of the 7-9 hour range), health problems, or availability on study days (the main reason). We also excluded smokers and those who had consumed alcohol within two days of the protocol. One woman failed to participate in both conditions. Overall, we enrolled 12 women and 12 men.
The participants slept in their own homes. Sleep times were confirmed with sleep diaries and text messages. The sleep diaries (Karolinska sleep diary) included information on sleep latency, quality, duration, and sleepiness. Participants sent a text message to the research assistant by mobile phone (SMS) at bedtime and when they got up on the night before sleep deprivation. They had been instructed not to nap. During the normal sleep condition the participants’ mean duration of sleep, estimated from sleep diaries, was 8.45 (SE 0.20) hours. The sleep deprivation condition started with a restriction of sleep to five hours in bed; the participants sent text messages (SMS) when they went to sleep and when they woke up. The mean duration of sleep during this night, estimated from sleep diaries and text messages, was 5.06 (SE 0.04) hours. For the following night of total sleep deprivation, the participants were monitored in the sleep laboratory at all times. Thus, for the sleep deprivation condition, participants came to the laboratory at 22.00 (after 15 hours of wakefulness) to be monitored, and stayed awake for a further 16 hours. We therefore did not observe the participants during the first 15 hours of wakefulness, when they had had a slightly restricted sleep, but had good control over the last 16 hours of wakefulness when sleepiness increased in magnitude. For the sleep condition, participants came to the laboratory at 12.00 (after five hours of wakefulness). They were kept indoors two hours before being photographed to avoid the effects of exposure to sunlight and the weather. We had a series of five or six photographs (resolution 3872×2592 pixels) taken in a well lit room, with a constant white balance (×900l; colour temperature 4200 K, Nikon D80; Nikon, Tokyo). The white balance was differently set during the two days of the study and affected seven photographs (four taken during sleep deprivation and three during a normal night’s sleep). Removing these participants from the analyses did not affect the results. The distance from camera to head was fixed, as was the focal length, within 14 mm (between 44 and 58 mm). To ensure a fixed surface area of each face on the photograph, the focal length was adapted to the head size of each participant.
For the photo shoot, participants wore no makeup, had their hair loose (combed backwards if long), underwent similar cleaning or shaving procedures for both conditions, and were instructed to “sit with a straight back and look straight into the camera with a neutral, relaxed facial expression.” Although the photographer was not blinded to the sleep conditions, she followed a highly standardised procedure during each photo shoot, including minimal interaction with the participants. A blinded rater chose the most typical photograph from each series of photographs. This process resulted in 46 photographs; two (one from each sleep condition) of each of the 23 participants. This part of the study took place between June and September 2007.
In October 2007 the photographs were presented at a fixed interval of six seconds in a randomised order to 65 observers (mainly students at the Karolinska Institute, mean age 30 (range 18-61) years, 40 women), who were unaware of the conditions of the study. They rated the faces for attractiveness (very unattractive to very attractive), health (very sick to very healthy), and tiredness (not at all tired to very tired) on a 100 mm visual analogue scale. After every 23 photographs a brief intermission was allowed, including a working memory task lasting 23 seconds to prevent the faces being memorised. To ensure that the observers were not primed to tiredness when rating health and attractiveness they rated the photographs for attractiveness and health in the first two sessions and tiredness in the last. To avoid the influence of possible order effects we presented the photographs in a balanced order between conditions for each session.
Statistical analyses
Data were analysed using multilevel mixed effects linear regression, with two crossed independent random effects accounting for random variation between observers and participants using the xtmixed procedure in Stata 9.2. We present the effect of condition as a percentage of change from the baseline condition as the reference using the absolute value in millimetres (rated on the visual analogue scale). No data were missing in the analyses.
Sixty five observers rated each of the 46 photographs for attractiveness, health, and tiredness: 138 ratings by each observer and 2990 ratings for each of the three factors rated. When sleep deprived, people were rated as less healthy (visual analogue scale scores, mean 63 (SE 2) v 68 (SE 2)), more tired (53 (SE 3) v 44 (SE 3)), and less attractive (38 (SE 2) v 40 (SE 2); P<0.001 for all) than after a normal night’s sleep (table 1 ⇓ ). Compared with the normal sleep condition, perceptions of health and attractiveness in the sleep deprived condition decreased on average by 6% and 4% and tiredness increased by 19%.
Multilevel mixed effects regression on effect of how sleep deprived people are perceived with respect to attractiveness, health, and tiredness
- View inline
A 10 mm increase in tiredness was associated with a −3.0 mm change in health, a 10 mm increase in health increased attractiveness by 2.4 mm, and a 10 mm increase in tiredness reduced attractiveness by 1.2 mm (table 2 ⇓ ). These findings were also presented as correlation, suggesting that faces with perceived attractiveness are positively associated with perceived health (r=0.42, fig 1 ⇓ ) and negatively with perceived tiredness (r=−0.28, fig 1). In addition, the average decrease (for each face) in attractiveness as a result of deprived sleep was associated with changes in tiredness (−0.53, n=23, P=0.03) and in health (0.50, n=23, P=0.01). Moreover, a strong negative association was found between the respective perceptions of tiredness and health (r=−0.54, fig 1). Figure 2 ⇓ shows an example of observer rated faces.
Associations between health, tiredness, and attractiveness
Fig 1 Relations between health, tiredness, and attractiveness of 46 photographs (two each of 23 participants) rated by 65 observers on 100 mm visual analogue scales, with variation between observers removed using empirical Bayes’ estimates
- Download figure
- Open in new tab
- Download powerpoint
Fig 2 Participant after a normal night’s sleep (left) and after sleep deprivation (right). Faces were presented in a counterbalanced order
To evaluate the mediation effects of sleep loss on attractiveness and health, tiredness was added to the models presented in table 1 following recommendations. 16 The effect of sleep loss was significantly mediated by tiredness on both health (P<0.001) and attractiveness (P<0.001). When tiredness was added to the model (table 1) with an estimated coefficient of −2.9 (SE 0.1; P<0.001) the independent effect of sleep loss on health decreased from −4.2 to −1.8 (SE 0.5; P<0.001). The effect of sleep loss on attractiveness decreased from −1.6 (table 1) to −0.62 (SE 0.4; P=0.133), with tiredness estimated at −1.1 (SE 0.1; P<0.001). The same approach applied to the model of attractiveness and health (table 2), with a decrease in the association from 2.4 to 2.1 (SE 0.1; P<0.001) with tiredness estimated at −0.56 (SE 0.1; P<0.001).
Sleep deprived people are perceived as less attractive, less healthy, and more tired compared with when they are well rested. Apparent tiredness was strongly related to looking less healthy and less attractive, which was also supported by the mediating analyses, indicating that a large part of the found effects and relations on appearing healthy and attractive were mediated by looking tired. The fact that untrained observers detected the effects of sleep loss in others not only provides evidence for a perceptual ability not previously subjected to experimental control, but also supports the notion that sleep history gives rise to socially relevant signals that provide information about the bearer. The adaptiveness of an ability to detect sleep related facial cues resonates well with other research, showing that small deviations from the average sleep duration in the long term are associated with an increased risk of health problems and with a decreased longevity. 8 17 Indeed, even a few hours of sleep deprivation inflict an array of physiological changes, including neural, endocrinological, immunological, and cellular functioning, that if sustained are relevant for long term health. 7 18 19 20 Here, we show that such physiological changes are paralleled by detectable facial changes.
These results are related to photographs taken in an artificial setting and presented to the observers for only six seconds. It is likely that the effects reported here would be larger in real life person to person situations, when overt behaviour and interactions add further information. Blink interval and blink duration are known to be indicators of sleepiness, 21 and trained observers are able to evaluate reliably the drowsiness of drivers by watching their videotaped faces. 22 In addition, a few of the people were perceived as healthier, less tired, and more attractive during the sleep deprived condition. It remains to be evaluated in follow-up research whether this is due to random error noise in judgments, or associated with specific characteristics of observers or the sleep deprived people they judge. Nevertheless, we believe that the present findings can be generalised to a wide variety of settings, but further studies will have to investigate the impact on clinical studies and other social situations.
Importantly, our findings suggest a prominent role of sleep history in several domains of interpersonal perception and judgment, in which sleep history has previously not been considered of importance, such as in clinical judgment. In addition, because attractiveness motivates sexual behaviour, collaboration, and superior treatment, 13 sleep loss may have consequences in other social contexts. For example, it has been proposed that facial cues perceived as attractive are signals of good health and that this recognition has been selected evolutionarily to guide choice of mate and successful transmission of genes. 13 The fact that good sleep supports a healthy look and poor sleep the reverse may be of particular relevance in the medical setting, where health estimates are an essential part. It is possible that people with sleep disturbances, clinical or otherwise, would be judged as more unhealthy, whereas those who have had an unusually good night’s sleep may be perceived as rather healthy. Compared with the sleep deprivation used in the present investigation, further studies are needed to investigate the effects of less drastic acute reductions of sleep as well as long term clinical effects.
Conclusions
People are capable of detecting sleep loss related facial cues, and these cues modify judgments of another’s health and attractiveness. These conclusions agree well with existing models describing a link between sleep and good health, 18 23 as well as a link between attractiveness and health. 13 Future studies should focus on the relevance of these facial cues in clinical settings. These could investigate whether clinicians are better than the average population at detecting sleep or health related facial cues, and whether patients with a clinical diagnosis exhibit more tiredness and are less healthy looking than healthy people. Perhaps the more successful doctors are those who pick up on these details and act accordingly.
Taken together, our results provide important insights into judgments about health and attractiveness that are reminiscent of the anecdotal wisdom harboured in Bell’s words, and in the colloquial notion of “beauty sleep.”
What is already known on this topic
Short or disturbed sleep and fatigue constitute major risk factors for health and safety
Complaints of short or disturbed sleep are common among patients seeking healthcare
The human face is the main source of information for social signalling
What this study adds
The facial cues of sleep deprived people are sufficient for others to judge them as more tired, less healthy, and less attractive, lending the first scientific support to the concept of “beauty sleep”
By affecting doctors’ general perception of health, the sleep history of a patient may affect clinical decisions and diagnostic precision
Cite this as: BMJ 2010;341:c6614
We thank B Karshikoff for support with data acquisition and M Ingvar for comments on an earlier draft of the manuscript, both without compensation and working at the Department for Clinical Neuroscience, Karolinska Institutet, Sweden.
Contributors: JA designed the data collection, supervised and monitored data collection, wrote the statistical analysis plan, carried out the statistical analyses, obtained funding, drafted and revised the manuscript, and is guarantor. TS designed and carried out the data collection, cleaned the data, drafted, revised the manuscript, and had final approval of the manuscript. JA and TS contributed equally to the work. MI wrote the statistical analysis plan, carried out the statistical analyses, drafted the manuscript, and critically revised the manuscript. EJWVS provided statistical advice, advised on data handling, and critically revised the manuscript. AO provided advice on the methods and critically revised the manuscript. ML provided administrative support, drafted the manuscript, and critically revised the manuscript. All authors approved the final version of the manuscript.
Funding: This study was funded by the Swedish Society for Medical Research, Rut and Arvid Wolff’s Memory Fund, and the Osher Center for Integrative Medicine.
Competing interests: All authors have completed the Unified Competing Interest form at www.icmje.org/coi_disclosure.pdf (available on request from the corresponding author) and declare: no support from any company for the submitted work; no financial relationships with any companies that might have an interest in the submitted work in the previous 3 years; no other relationships or activities that could appear to have influenced the submitted work.
Ethical approval: This study was approved by the Karolinska Institutet’s ethical committee. Participants were compensated for their participation.
Participant consent: Participant’s consent obtained.
Data sharing: Statistical code and dataset of ratings are available from the corresponding author at john.axelsson{at}ki.se .
This is an open-access article distributed under the terms of the Creative Commons Attribution Non-commercial License, which permits use, distribution, and reproduction in any medium, provided the original work is properly cited, the use is non commercial and is otherwise in compliance with the license. See: http://creativecommons.org/licenses/by-nc/2.0/ and http://creativecommons.org/licenses/by-nc/2.0/legalcode .
- ↵ Deten A, Volz HC, Clamors S, Leiblein S, Briest W, Marx G, et al. Hematopoietic stem cells do not repair the infarcted mouse heart. Cardiovasc Res 2005 ; 65 : 52 -63. OpenUrl Abstract / FREE Full Text
- ↵ Doyle AC. The case-book of Sherlock Holmes: selected stories. Wordsworth, 1993.
- ↵ Lieberman MD, Gaunt R, Gilbert DT, Trope Y. Reflection and reflexion: a social cognitive neuroscience approach to attributional inference. Adv Exp Soc Psychol 2002 ; 34 : 199 -249. OpenUrl CrossRef
- ↵ Drummond SPA, Brown GG, Gillin JC, Stricker JL, Wong EC, Buxton RB. Altered brain response to verbal learning following sleep deprivation. Nature 2000 ; 403 : 655 -7. OpenUrl CrossRef PubMed
- ↵ Harrison Y, Horne JA. The impact of sleep deprivation on decision making: a review. J Exp Psychol Appl 2000 ; 6 : 236 -49. OpenUrl CrossRef PubMed Web of Science
- ↵ Huber R, Ghilardi MF, Massimini M, Tononi G. Local sleep and learning. Nature 2004 ; 430 : 78 -81. OpenUrl CrossRef PubMed Web of Science
- ↵ Spiegel K, Leproult R, Van Cauter E. Impact of sleep debt on metabolic and endocrine function. Lancet 1999 ; 354 : 1435 -9. OpenUrl CrossRef PubMed Web of Science
- ↵ Kripke DF, Garfinkel L, Wingard DL, Klauber MR, Marler MR. Mortality associated with sleep duration and insomnia. Arch Gen Psychiatry 2002 ; 59 : 131 -6. OpenUrl CrossRef PubMed Web of Science
- ↵ Olson LG, Ambrogetti A. Waking up to sleep disorders. Br J Hosp Med (Lond) 2006 ; 67 : 118 , 20. OpenUrl PubMed
- ↵ Rajaratnam SM, Arendt J. Health in a 24-h society. Lancet 2001 ; 358 : 999 -1005. OpenUrl CrossRef PubMed Web of Science
- ↵ Ranjbaran Z, Keefer L, Stepanski E, Farhadi A, Keshavarzian A. The relevance of sleep abnormalities to chronic inflammatory conditions. Inflamm Res 2007 ; 56 : 51 -7. OpenUrl CrossRef PubMed Web of Science
- ↵ Haxby JV, Hoffman EA, Gobbini MI. The distributed human neural system for face perception. Trends Cogn Sci 2000 ; 4 : 223 -33. OpenUrl CrossRef PubMed Web of Science
- ↵ Rhodes G. The evolutionary psychology of facial beauty. Annu Rev Psychol 2006 ; 57 : 199 -226. OpenUrl CrossRef PubMed Web of Science
- ↵ Todorov A, Mandisodza AN, Goren A, Hall CC. Inferences of competence from faces predict election outcomes. Science 2005 ; 308 : 1623 -6. OpenUrl Abstract / FREE Full Text
- ↵ Willis J, Todorov A. First impressions: making up your mind after a 100-ms exposure to a face. Psychol Sci 2006 ; 17 : 592 -8. OpenUrl Abstract / FREE Full Text
- ↵ Krull JL, MacKinnon DP. Multilevel modeling of individual and group level mediated effects. Multivariate Behav Res 2001 ; 36 : 249 -77. OpenUrl CrossRef Web of Science
- ↵ Ayas NT, White DP, Manson JE, Stampfer MJ, Speizer FE, Malhotra A, et al. A prospective study of sleep duration and coronary heart disease in women. Arch Intern Med 2003 ; 163 : 205 -9. OpenUrl CrossRef PubMed Web of Science
- ↵ Bryant PA, Trinder J, Curtis N. Sick and tired: does sleep have a vital role in the immune system. Nat Rev Immunol 2004 ; 4 : 457 -67. OpenUrl CrossRef PubMed Web of Science
- ↵ Cirelli C. Cellular consequences of sleep deprivation in the brain. Sleep Med Rev 2006 ; 10 : 307 -21. OpenUrl CrossRef PubMed Web of Science
- ↵ Irwin MR, Wang M, Campomayor CO, Collado-Hidalgo A, Cole S. Sleep deprivation and activation of morning levels of cellular and genomic markers of inflammation. Arch Intern Med 2006 ; 166 : 1756 -62. OpenUrl CrossRef PubMed Web of Science
- ↵ Schleicher R, Galley N, Briest S, Galley L. Blinks and saccades as indicators of fatigue in sleepiness warnings: looking tired? Ergonomics 2008 ; 51 : 982 -1010. OpenUrl CrossRef PubMed Web of Science
- ↵ Wierwille WW, Ellsworth LA. Evaluation of driver drowsiness by trained raters. Accid Anal Prev 1994 ; 26 : 571 -81. OpenUrl CrossRef PubMed Web of Science
- ↵ Horne J. Why we sleep—the functions of sleep in humans and other mammals. Oxford University Press, 1988.
19+ Experimental Design Examples (Methods + Types)
Ever wondered how scientists discover new medicines, psychologists learn about behavior, or even how marketers figure out what kind of ads you like? Well, they all have something in common: they use a special plan or recipe called an "experimental design."
Imagine you're baking cookies. You can't just throw random amounts of flour, sugar, and chocolate chips into a bowl and hope for the best. You follow a recipe, right? Scientists and researchers do something similar. They follow a "recipe" called an experimental design to make sure their experiments are set up in a way that the answers they find are meaningful and reliable.
Experimental design is the roadmap researchers use to answer questions. It's a set of rules and steps that researchers follow to collect information, or "data," in a way that is fair, accurate, and makes sense.

Long ago, people didn't have detailed game plans for experiments. They often just tried things out and saw what happened. But over time, people got smarter about this. They started creating structured plans—what we now call experimental designs—to get clearer, more trustworthy answers to their questions.
In this article, we'll take you on a journey through the world of experimental designs. We'll talk about the different types, or "flavors," of experimental designs, where they're used, and even give you a peek into how they came to be.
What Is Experimental Design?
Alright, before we dive into the different types of experimental designs, let's get crystal clear on what experimental design actually is.
Imagine you're a detective trying to solve a mystery. You need clues, right? Well, in the world of research, experimental design is like the roadmap that helps you find those clues. It's like the game plan in sports or the blueprint when you're building a house. Just like you wouldn't start building without a good blueprint, researchers won't start their studies without a strong experimental design.
So, why do we need experimental design? Think about baking a cake. If you toss ingredients into a bowl without measuring, you'll end up with a mess instead of a tasty dessert.
Similarly, in research, if you don't have a solid plan, you might get confusing or incorrect results. A good experimental design helps you ask the right questions ( think critically ), decide what to measure ( come up with an idea ), and figure out how to measure it (test it). It also helps you consider things that might mess up your results, like outside influences you hadn't thought of.
For example, let's say you want to find out if listening to music helps people focus better. Your experimental design would help you decide things like: Who are you going to test? What kind of music will you use? How will you measure focus? And, importantly, how will you make sure that it's really the music affecting focus and not something else, like the time of day or whether someone had a good breakfast?
In short, experimental design is the master plan that guides researchers through the process of collecting data, so they can answer questions in the most reliable way possible. It's like the GPS for the journey of discovery!
History of Experimental Design
Around 350 BCE, people like Aristotle were trying to figure out how the world works, but they mostly just thought really hard about things. They didn't test their ideas much. So while they were super smart, their methods weren't always the best for finding out the truth.
Fast forward to the Renaissance (14th to 17th centuries), a time of big changes and lots of curiosity. People like Galileo started to experiment by actually doing tests, like rolling balls down inclined planes to study motion. Galileo's work was cool because he combined thinking with doing. He'd have an idea, test it, look at the results, and then think some more. This approach was a lot more reliable than just sitting around and thinking.
Now, let's zoom ahead to the 18th and 19th centuries. This is when people like Francis Galton, an English polymath, started to get really systematic about experimentation. Galton was obsessed with measuring things. Seriously, he even tried to measure how good-looking people were ! His work helped create the foundations for a more organized approach to experiments.
Next stop: the early 20th century. Enter Ronald A. Fisher , a brilliant British statistician. Fisher was a game-changer. He came up with ideas that are like the bread and butter of modern experimental design.
Fisher invented the concept of the " control group "—that's a group of people or things that don't get the treatment you're testing, so you can compare them to those who do. He also stressed the importance of " randomization ," which means assigning people or things to different groups by chance, like drawing names out of a hat. This makes sure the experiment is fair and the results are trustworthy.
Around the same time, American psychologists like John B. Watson and B.F. Skinner were developing " behaviorism ." They focused on studying things that they could directly observe and measure, like actions and reactions.
Skinner even built boxes—called Skinner Boxes —to test how animals like pigeons and rats learn. Their work helped shape how psychologists design experiments today. Watson performed a very controversial experiment called The Little Albert experiment that helped describe behaviour through conditioning—in other words, how people learn to behave the way they do.
In the later part of the 20th century and into our time, computers have totally shaken things up. Researchers now use super powerful software to help design their experiments and crunch the numbers.
With computers, they can simulate complex experiments before they even start, which helps them predict what might happen. This is especially helpful in fields like medicine, where getting things right can be a matter of life and death.
Also, did you know that experimental designs aren't just for scientists in labs? They're used by people in all sorts of jobs, like marketing, education, and even video game design! Yes, someone probably ran an experiment to figure out what makes a game super fun to play.
So there you have it—a quick tour through the history of experimental design, from Aristotle's deep thoughts to Fisher's groundbreaking ideas, and all the way to today's computer-powered research. These designs are the recipes that help people from all walks of life find answers to their big questions.
Key Terms in Experimental Design
Before we dig into the different types of experimental designs, let's get comfy with some key terms. Understanding these terms will make it easier for us to explore the various types of experimental designs that researchers use to answer their big questions.
Independent Variable : This is what you change or control in your experiment to see what effect it has. Think of it as the "cause" in a cause-and-effect relationship. For example, if you're studying whether different types of music help people focus, the kind of music is the independent variable.
Dependent Variable : This is what you're measuring to see the effect of your independent variable. In our music and focus experiment, how well people focus is the dependent variable—it's what "depends" on the kind of music played.
Control Group : This is a group of people who don't get the special treatment or change you're testing. They help you see what happens when the independent variable is not applied. If you're testing whether a new medicine works, the control group would take a fake pill, called a placebo , instead of the real medicine.
Experimental Group : This is the group that gets the special treatment or change you're interested in. Going back to our medicine example, this group would get the actual medicine to see if it has any effect.
Randomization : This is like shaking things up in a fair way. You randomly put people into the control or experimental group so that each group is a good mix of different kinds of people. This helps make the results more reliable.
Sample : This is the group of people you're studying. They're a "sample" of a larger group that you're interested in. For instance, if you want to know how teenagers feel about a new video game, you might study a sample of 100 teenagers.
Bias : This is anything that might tilt your experiment one way or another without you realizing it. Like if you're testing a new kind of dog food and you only test it on poodles, that could create a bias because maybe poodles just really like that food and other breeds don't.
Data : This is the information you collect during the experiment. It's like the treasure you find on your journey of discovery!
Replication : This means doing the experiment more than once to make sure your findings hold up. It's like double-checking your answers on a test.
Hypothesis : This is your educated guess about what will happen in the experiment. It's like predicting the end of a movie based on the first half.
Steps of Experimental Design
Alright, let's say you're all fired up and ready to run your own experiment. Cool! But where do you start? Well, designing an experiment is a bit like planning a road trip. There are some key steps you've got to take to make sure you reach your destination. Let's break it down:
- Ask a Question : Before you hit the road, you've got to know where you're going. Same with experiments. You start with a question you want to answer, like "Does eating breakfast really make you do better in school?"
- Do Some Homework : Before you pack your bags, you look up the best places to visit, right? In science, this means reading up on what other people have already discovered about your topic.
- Form a Hypothesis : This is your educated guess about what you think will happen. It's like saying, "I bet this route will get us there faster."
- Plan the Details : Now you decide what kind of car you're driving (your experimental design), who's coming with you (your sample), and what snacks to bring (your variables).
- Randomization : Remember, this is like shuffling a deck of cards. You want to mix up who goes into your control and experimental groups to make sure it's a fair test.
- Run the Experiment : Finally, the rubber hits the road! You carry out your plan, making sure to collect your data carefully.
- Analyze the Data : Once the trip's over, you look at your photos and decide which ones are keepers. In science, this means looking at your data to see what it tells you.
- Draw Conclusions : Based on your data, did you find an answer to your question? This is like saying, "Yep, that route was faster," or "Nope, we hit a ton of traffic."
- Share Your Findings : After a great trip, you want to tell everyone about it, right? Scientists do the same by publishing their results so others can learn from them.
- Do It Again? : Sometimes one road trip just isn't enough. In the same way, scientists often repeat their experiments to make sure their findings are solid.
So there you have it! Those are the basic steps you need to follow when you're designing an experiment. Each step helps make sure that you're setting up a fair and reliable way to find answers to your big questions.
Let's get into examples of experimental designs.
1) True Experimental Design

In the world of experiments, the True Experimental Design is like the superstar quarterback everyone talks about. Born out of the early 20th-century work of statisticians like Ronald A. Fisher, this design is all about control, precision, and reliability.
Researchers carefully pick an independent variable to manipulate (remember, that's the thing they're changing on purpose) and measure the dependent variable (the effect they're studying). Then comes the magic trick—randomization. By randomly putting participants into either the control or experimental group, scientists make sure their experiment is as fair as possible.
No sneaky biases here!
True Experimental Design Pros
The pros of True Experimental Design are like the perks of a VIP ticket at a concert: you get the best and most trustworthy results. Because everything is controlled and randomized, you can feel pretty confident that the results aren't just a fluke.
True Experimental Design Cons
However, there's a catch. Sometimes, it's really tough to set up these experiments in a real-world situation. Imagine trying to control every single detail of your day, from the food you eat to the air you breathe. Not so easy, right?
True Experimental Design Uses
The fields that get the most out of True Experimental Designs are those that need super reliable results, like medical research.
When scientists were developing COVID-19 vaccines, they used this design to run clinical trials. They had control groups that received a placebo (a harmless substance with no effect) and experimental groups that got the actual vaccine. Then they measured how many people in each group got sick. By comparing the two, they could say, "Yep, this vaccine works!"
So next time you read about a groundbreaking discovery in medicine or technology, chances are a True Experimental Design was the VIP behind the scenes, making sure everything was on point. It's been the go-to for rigorous scientific inquiry for nearly a century, and it's not stepping off the stage anytime soon.
2) Quasi-Experimental Design
So, let's talk about the Quasi-Experimental Design. Think of this one as the cool cousin of True Experimental Design. It wants to be just like its famous relative, but it's a bit more laid-back and flexible. You'll find quasi-experimental designs when it's tricky to set up a full-blown True Experimental Design with all the bells and whistles.
Quasi-experiments still play with an independent variable, just like their stricter cousins. The big difference? They don't use randomization. It's like wanting to divide a bag of jelly beans equally between your friends, but you can't quite do it perfectly.
In real life, it's often not possible or ethical to randomly assign people to different groups, especially when dealing with sensitive topics like education or social issues. And that's where quasi-experiments come in.
Quasi-Experimental Design Pros
Even though they lack full randomization, quasi-experimental designs are like the Swiss Army knives of research: versatile and practical. They're especially popular in fields like education, sociology, and public policy.
For instance, when researchers wanted to figure out if the Head Start program , aimed at giving young kids a "head start" in school, was effective, they used a quasi-experimental design. They couldn't randomly assign kids to go or not go to preschool, but they could compare kids who did with kids who didn't.
Quasi-Experimental Design Cons
Of course, quasi-experiments come with their own bag of pros and cons. On the plus side, they're easier to set up and often cheaper than true experiments. But the flip side is that they're not as rock-solid in their conclusions. Because the groups aren't randomly assigned, there's always that little voice saying, "Hey, are we missing something here?"
Quasi-Experimental Design Uses
Quasi-Experimental Design gained traction in the mid-20th century. Researchers were grappling with real-world problems that didn't fit neatly into a laboratory setting. Plus, as society became more aware of ethical considerations, the need for flexible designs increased. So, the quasi-experimental approach was like a breath of fresh air for scientists wanting to study complex issues without a laundry list of restrictions.
In short, if True Experimental Design is the superstar quarterback, Quasi-Experimental Design is the versatile player who can adapt and still make significant contributions to the game.
3) Pre-Experimental Design
Now, let's talk about the Pre-Experimental Design. Imagine it as the beginner's skateboard you get before you try out for all the cool tricks. It has wheels, it rolls, but it's not built for the professional skatepark.
Similarly, pre-experimental designs give researchers a starting point. They let you dip your toes in the water of scientific research without diving in head-first.
So, what's the deal with pre-experimental designs?
Pre-Experimental Designs are the basic, no-frills versions of experiments. Researchers still mess around with an independent variable and measure a dependent variable, but they skip over the whole randomization thing and often don't even have a control group.
It's like baking a cake but forgetting the frosting and sprinkles; you'll get some results, but they might not be as complete or reliable as you'd like.
Pre-Experimental Design Pros
Why use such a simple setup? Because sometimes, you just need to get the ball rolling. Pre-experimental designs are great for quick-and-dirty research when you're short on time or resources. They give you a rough idea of what's happening, which you can use to plan more detailed studies later.
A good example of this is early studies on the effects of screen time on kids. Researchers couldn't control every aspect of a child's life, but they could easily ask parents to track how much time their kids spent in front of screens and then look for trends in behavior or school performance.
Pre-Experimental Design Cons
But here's the catch: pre-experimental designs are like that first draft of an essay. It helps you get your ideas down, but you wouldn't want to turn it in for a grade. Because these designs lack the rigorous structure of true or quasi-experimental setups, they can't give you rock-solid conclusions. They're more like clues or signposts pointing you in a certain direction.
Pre-Experimental Design Uses
This type of design became popular in the early stages of various scientific fields. Researchers used them to scratch the surface of a topic, generate some initial data, and then decide if it's worth exploring further. In other words, pre-experimental designs were the stepping stones that led to more complex, thorough investigations.
So, while Pre-Experimental Design may not be the star player on the team, it's like the practice squad that helps everyone get better. It's the starting point that can lead to bigger and better things.
4) Factorial Design
Now, buckle up, because we're moving into the world of Factorial Design, the multi-tasker of the experimental universe.
Imagine juggling not just one, but multiple balls in the air—that's what researchers do in a factorial design.
In Factorial Design, researchers are not satisfied with just studying one independent variable. Nope, they want to study two or more at the same time to see how they interact.
It's like cooking with several spices to see how they blend together to create unique flavors.
Factorial Design became the talk of the town with the rise of computers. Why? Because this design produces a lot of data, and computers are the number crunchers that help make sense of it all. So, thanks to our silicon friends, researchers can study complicated questions like, "How do diet AND exercise together affect weight loss?" instead of looking at just one of those factors.
Factorial Design Pros
This design's main selling point is its ability to explore interactions between variables. For instance, maybe a new study drug works really well for young people but not so great for older adults. A factorial design could reveal that age is a crucial factor, something you might miss if you only studied the drug's effectiveness in general. It's like being a detective who looks for clues not just in one room but throughout the entire house.
Factorial Design Cons
However, factorial designs have their own bag of challenges. First off, they can be pretty complicated to set up and run. Imagine coordinating a four-way intersection with lots of cars coming from all directions—you've got to make sure everything runs smoothly, or you'll end up with a traffic jam. Similarly, researchers need to carefully plan how they'll measure and analyze all the different variables.
Factorial Design Uses
Factorial designs are widely used in psychology to untangle the web of factors that influence human behavior. They're also popular in fields like marketing, where companies want to understand how different aspects like price, packaging, and advertising influence a product's success.
And speaking of success, the factorial design has been a hit since statisticians like Ronald A. Fisher (yep, him again!) expanded on it in the early-to-mid 20th century. It offered a more nuanced way of understanding the world, proving that sometimes, to get the full picture, you've got to juggle more than one ball at a time.
So, if True Experimental Design is the quarterback and Quasi-Experimental Design is the versatile player, Factorial Design is the strategist who sees the entire game board and makes moves accordingly.
5) Longitudinal Design

Alright, let's take a step into the world of Longitudinal Design. Picture it as the grand storyteller, the kind who doesn't just tell you about a single event but spins an epic tale that stretches over years or even decades. This design isn't about quick snapshots; it's about capturing the whole movie of someone's life or a long-running process.
You know how you might take a photo every year on your birthday to see how you've changed? Longitudinal Design is kind of like that, but for scientific research.
With Longitudinal Design, instead of measuring something just once, researchers come back again and again, sometimes over many years, to see how things are going. This helps them understand not just what's happening, but why it's happening and how it changes over time.
This design really started to shine in the latter half of the 20th century, when researchers began to realize that some questions can't be answered in a hurry. Think about studies that look at how kids grow up, or research on how a certain medicine affects you over a long period. These aren't things you can rush.
The famous Framingham Heart Study , started in 1948, is a prime example. It's been studying heart health in a small town in Massachusetts for decades, and the findings have shaped what we know about heart disease.
Longitudinal Design Pros
So, what's to love about Longitudinal Design? First off, it's the go-to for studying change over time, whether that's how people age or how a forest recovers from a fire.
Longitudinal Design Cons
But it's not all sunshine and rainbows. Longitudinal studies take a lot of patience and resources. Plus, keeping track of participants over many years can be like herding cats—difficult and full of surprises.
Longitudinal Design Uses
Despite these challenges, longitudinal studies have been key in fields like psychology, sociology, and medicine. They provide the kind of deep, long-term insights that other designs just can't match.
So, if the True Experimental Design is the superstar quarterback, and the Quasi-Experimental Design is the flexible athlete, then the Factorial Design is the strategist, and the Longitudinal Design is the wise elder who has seen it all and has stories to tell.
6) Cross-Sectional Design
Now, let's flip the script and talk about Cross-Sectional Design, the polar opposite of the Longitudinal Design. If Longitudinal is the grand storyteller, think of Cross-Sectional as the snapshot photographer. It captures a single moment in time, like a selfie that you take to remember a fun day. Researchers using this design collect all their data at one point, providing a kind of "snapshot" of whatever they're studying.
In a Cross-Sectional Design, researchers look at multiple groups all at the same time to see how they're different or similar.
This design rose to popularity in the mid-20th century, mainly because it's so quick and efficient. Imagine wanting to know how people of different ages feel about a new video game. Instead of waiting for years to see how opinions change, you could just ask people of all ages what they think right now. That's Cross-Sectional Design for you—fast and straightforward.
You'll find this type of research everywhere from marketing studies to healthcare. For instance, you might have heard about surveys asking people what they think about a new product or political issue. Those are usually cross-sectional studies, aimed at getting a quick read on public opinion.
Cross-Sectional Design Pros
So, what's the big deal with Cross-Sectional Design? Well, it's the go-to when you need answers fast and don't have the time or resources for a more complicated setup.
Cross-Sectional Design Cons
Remember, speed comes with trade-offs. While you get your results quickly, those results are stuck in time. They can't tell you how things change or why they're changing, just what's happening right now.
Cross-Sectional Design Uses
Also, because they're so quick and simple, cross-sectional studies often serve as the first step in research. They give scientists an idea of what's going on so they can decide if it's worth digging deeper. In that way, they're a bit like a movie trailer, giving you a taste of the action to see if you're interested in seeing the whole film.
So, in our lineup of experimental designs, if True Experimental Design is the superstar quarterback and Longitudinal Design is the wise elder, then Cross-Sectional Design is like the speedy running back—fast, agile, but not designed for long, drawn-out plays.
7) Correlational Design
Next on our roster is the Correlational Design, the keen observer of the experimental world. Imagine this design as the person at a party who loves people-watching. They don't interfere or get involved; they just observe and take mental notes about what's going on.
In a correlational study, researchers don't change or control anything; they simply observe and measure how two variables relate to each other.
The correlational design has roots in the early days of psychology and sociology. Pioneers like Sir Francis Galton used it to study how qualities like intelligence or height could be related within families.
This design is all about asking, "Hey, when this thing happens, does that other thing usually happen too?" For example, researchers might study whether students who have more study time get better grades or whether people who exercise more have lower stress levels.
One of the most famous correlational studies you might have heard of is the link between smoking and lung cancer. Back in the mid-20th century, researchers started noticing that people who smoked a lot also seemed to get lung cancer more often. They couldn't say smoking caused cancer—that would require a true experiment—but the strong correlation was a red flag that led to more research and eventually, health warnings.
Correlational Design Pros
This design is great at proving that two (or more) things can be related. Correlational designs can help prove that more detailed research is needed on a topic. They can help us see patterns or possible causes for things that we otherwise might not have realized.
Correlational Design Cons
But here's where you need to be careful: correlational designs can be tricky. Just because two things are related doesn't mean one causes the other. That's like saying, "Every time I wear my lucky socks, my team wins." Well, it's a fun thought, but those socks aren't really controlling the game.
Correlational Design Uses
Despite this limitation, correlational designs are popular in psychology, economics, and epidemiology, to name a few fields. They're often the first step in exploring a possible relationship between variables. Once a strong correlation is found, researchers may decide to conduct more rigorous experimental studies to examine cause and effect.
So, if the True Experimental Design is the superstar quarterback and the Longitudinal Design is the wise elder, the Factorial Design is the strategist, and the Cross-Sectional Design is the speedster, then the Correlational Design is the clever scout, identifying interesting patterns but leaving the heavy lifting of proving cause and effect to the other types of designs.
8) Meta-Analysis
Last but not least, let's talk about Meta-Analysis, the librarian of experimental designs.
If other designs are all about creating new research, Meta-Analysis is about gathering up everyone else's research, sorting it, and figuring out what it all means when you put it together.
Imagine a jigsaw puzzle where each piece is a different study. Meta-Analysis is the process of fitting all those pieces together to see the big picture.
The concept of Meta-Analysis started to take shape in the late 20th century, when computers became powerful enough to handle massive amounts of data. It was like someone handed researchers a super-powered magnifying glass, letting them examine multiple studies at the same time to find common trends or results.
You might have heard of the Cochrane Reviews in healthcare . These are big collections of meta-analyses that help doctors and policymakers figure out what treatments work best based on all the research that's been done.
For example, if ten different studies show that a certain medicine helps lower blood pressure, a meta-analysis would pull all that information together to give a more accurate answer.
Meta-Analysis Pros
The beauty of Meta-Analysis is that it can provide really strong evidence. Instead of relying on one study, you're looking at the whole landscape of research on a topic.
Meta-Analysis Cons
However, it does have some downsides. For one, Meta-Analysis is only as good as the studies it includes. If those studies are flawed, the meta-analysis will be too. It's like baking a cake: if you use bad ingredients, it doesn't matter how good your recipe is—the cake won't turn out well.
Meta-Analysis Uses
Despite these challenges, meta-analyses are highly respected and widely used in many fields like medicine, psychology, and education. They help us make sense of a world that's bursting with information by showing us the big picture drawn from many smaller snapshots.
So, in our all-star lineup, if True Experimental Design is the quarterback and Longitudinal Design is the wise elder, the Factorial Design is the strategist, the Cross-Sectional Design is the speedster, and the Correlational Design is the scout, then the Meta-Analysis is like the coach, using insights from everyone else's plays to come up with the best game plan.
9) Non-Experimental Design
Now, let's talk about a player who's a bit of an outsider on this team of experimental designs—the Non-Experimental Design. Think of this design as the commentator or the journalist who covers the game but doesn't actually play.
In a Non-Experimental Design, researchers are like reporters gathering facts, but they don't interfere or change anything. They're simply there to describe and analyze.
Non-Experimental Design Pros
So, what's the deal with Non-Experimental Design? Its strength is in description and exploration. It's really good for studying things as they are in the real world, without changing any conditions.
Non-Experimental Design Cons
Because a non-experimental design doesn't manipulate variables, it can't prove cause and effect. It's like a weather reporter: they can tell you it's raining, but they can't tell you why it's raining.
The downside? Since researchers aren't controlling variables, it's hard to rule out other explanations for what they observe. It's like hearing one side of a story—you get an idea of what happened, but it might not be the complete picture.
Non-Experimental Design Uses
Non-Experimental Design has always been a part of research, especially in fields like anthropology, sociology, and some areas of psychology.
For instance, if you've ever heard of studies that describe how people behave in different cultures or what teens like to do in their free time, that's often Non-Experimental Design at work. These studies aim to capture the essence of a situation, like painting a portrait instead of taking a snapshot.
One well-known example you might have heard about is the Kinsey Reports from the 1940s and 1950s, which described sexual behavior in men and women. Researchers interviewed thousands of people but didn't manipulate any variables like you would in a true experiment. They simply collected data to create a comprehensive picture of the subject matter.
So, in our metaphorical team of research designs, if True Experimental Design is the quarterback and Longitudinal Design is the wise elder, Factorial Design is the strategist, Cross-Sectional Design is the speedster, Correlational Design is the scout, and Meta-Analysis is the coach, then Non-Experimental Design is the sports journalist—always present, capturing the game, but not part of the action itself.
10) Repeated Measures Design

Time to meet the Repeated Measures Design, the time traveler of our research team. If this design were a player in a sports game, it would be the one who keeps revisiting past plays to figure out how to improve the next one.
Repeated Measures Design is all about studying the same people or subjects multiple times to see how they change or react under different conditions.
The idea behind Repeated Measures Design isn't new; it's been around since the early days of psychology and medicine. You could say it's a cousin to the Longitudinal Design, but instead of looking at how things naturally change over time, it focuses on how the same group reacts to different things.
Imagine a study looking at how a new energy drink affects people's running speed. Instead of comparing one group that drank the energy drink to another group that didn't, a Repeated Measures Design would have the same group of people run multiple times—once with the energy drink, and once without. This way, you're really zeroing in on the effect of that energy drink, making the results more reliable.
Repeated Measures Design Pros
The strong point of Repeated Measures Design is that it's super focused. Because it uses the same subjects, you don't have to worry about differences between groups messing up your results.
Repeated Measures Design Cons
But the downside? Well, people can get tired or bored if they're tested too many times, which might affect how they respond.
Repeated Measures Design Uses
A famous example of this design is the "Little Albert" experiment, conducted by John B. Watson and Rosalie Rayner in 1920. In this study, a young boy was exposed to a white rat and other stimuli several times to see how his emotional responses changed. Though the ethical standards of this experiment are often criticized today, it was groundbreaking in understanding conditioned emotional responses.
In our metaphorical lineup of research designs, if True Experimental Design is the quarterback and Longitudinal Design is the wise elder, Factorial Design is the strategist, Cross-Sectional Design is the speedster, Correlational Design is the scout, Meta-Analysis is the coach, and Non-Experimental Design is the journalist, then Repeated Measures Design is the time traveler—always looping back to fine-tune the game plan.
11) Crossover Design
Next up is Crossover Design, the switch-hitter of the research world. If you're familiar with baseball, you'll know a switch-hitter is someone who can bat both right-handed and left-handed.
In a similar way, Crossover Design allows subjects to experience multiple conditions, flipping them around so that everyone gets a turn in each role.
This design is like the utility player on our team—versatile, flexible, and really good at adapting.
The Crossover Design has its roots in medical research and has been popular since the mid-20th century. It's often used in clinical trials to test the effectiveness of different treatments.
Crossover Design Pros
The neat thing about this design is that it allows each participant to serve as their own control group. Imagine you're testing two new kinds of headache medicine. Instead of giving one type to one group and another type to a different group, you'd give both kinds to the same people but at different times.
Crossover Design Cons
What's the big deal with Crossover Design? Its major strength is in reducing the "noise" that comes from individual differences. Since each person experiences all conditions, it's easier to see real effects. However, there's a catch. This design assumes that there's no lasting effect from the first condition when you switch to the second one. That might not always be true. If the first treatment has a long-lasting effect, it could mess up the results when you switch to the second treatment.
Crossover Design Uses
A well-known example of Crossover Design is in studies that look at the effects of different types of diets—like low-carb vs. low-fat diets. Researchers might have participants follow a low-carb diet for a few weeks, then switch them to a low-fat diet. By doing this, they can more accurately measure how each diet affects the same group of people.
In our team of experimental designs, if True Experimental Design is the quarterback and Longitudinal Design is the wise elder, Factorial Design is the strategist, Cross-Sectional Design is the speedster, Correlational Design is the scout, Meta-Analysis is the coach, Non-Experimental Design is the journalist, and Repeated Measures Design is the time traveler, then Crossover Design is the versatile utility player—always ready to adapt and play multiple roles to get the most accurate results.
12) Cluster Randomized Design
Meet the Cluster Randomized Design, the team captain of group-focused research. In our imaginary lineup of experimental designs, if other designs focus on individual players, then Cluster Randomized Design is looking at how the entire team functions.
This approach is especially common in educational and community-based research, and it's been gaining traction since the late 20th century.
Here's how Cluster Randomized Design works: Instead of assigning individual people to different conditions, researchers assign entire groups, or "clusters." These could be schools, neighborhoods, or even entire towns. This helps you see how the new method works in a real-world setting.
Imagine you want to see if a new anti-bullying program really works. Instead of selecting individual students, you'd introduce the program to a whole school or maybe even several schools, and then compare the results to schools without the program.
Cluster Randomized Design Pros
Why use Cluster Randomized Design? Well, sometimes it's just not practical to assign conditions at the individual level. For example, you can't really have half a school following a new reading program while the other half sticks with the old one; that would be way too confusing! Cluster Randomization helps get around this problem by treating each "cluster" as its own mini-experiment.
Cluster Randomized Design Cons
There's a downside, too. Because entire groups are assigned to each condition, there's a risk that the groups might be different in some important way that the researchers didn't account for. That's like having one sports team that's full of veterans playing against a team of rookies; the match wouldn't be fair.
Cluster Randomized Design Uses
A famous example is the research conducted to test the effectiveness of different public health interventions, like vaccination programs. Researchers might roll out a vaccination program in one community but not in another, then compare the rates of disease in both.
In our metaphorical research team, if True Experimental Design is the quarterback, Longitudinal Design is the wise elder, Factorial Design is the strategist, Cross-Sectional Design is the speedster, Correlational Design is the scout, Meta-Analysis is the coach, Non-Experimental Design is the journalist, Repeated Measures Design is the time traveler, and Crossover Design is the utility player, then Cluster Randomized Design is the team captain—always looking out for the group as a whole.
13) Mixed-Methods Design
Say hello to Mixed-Methods Design, the all-rounder or the "Renaissance player" of our research team.
Mixed-Methods Design uses a blend of both qualitative and quantitative methods to get a more complete picture, just like a Renaissance person who's good at lots of different things. It's like being good at both offense and defense in a sport; you've got all your bases covered!
Mixed-Methods Design is a fairly new kid on the block, becoming more popular in the late 20th and early 21st centuries as researchers began to see the value in using multiple approaches to tackle complex questions. It's the Swiss Army knife in our research toolkit, combining the best parts of other designs to be more versatile.
Here's how it could work: Imagine you're studying the effects of a new educational app on students' math skills. You might use quantitative methods like tests and grades to measure how much the students improve—that's the 'numbers part.'
But you also want to know how the students feel about math now, or why they think they got better or worse. For that, you could conduct interviews or have students fill out journals—that's the 'story part.'
Mixed-Methods Design Pros
So, what's the scoop on Mixed-Methods Design? The strength is its versatility and depth; you're not just getting numbers or stories, you're getting both, which gives a fuller picture.
Mixed-Methods Design Cons
But, it's also more challenging. Imagine trying to play two sports at the same time! You have to be skilled in different research methods and know how to combine them effectively.
Mixed-Methods Design Uses
A high-profile example of Mixed-Methods Design is research on climate change. Scientists use numbers and data to show temperature changes (quantitative), but they also interview people to understand how these changes are affecting communities (qualitative).
In our team of experimental designs, if True Experimental Design is the quarterback, Longitudinal Design is the wise elder, Factorial Design is the strategist, Cross-Sectional Design is the speedster, Correlational Design is the scout, Meta-Analysis is the coach, Non-Experimental Design is the journalist, Repeated Measures Design is the time traveler, Crossover Design is the utility player, and Cluster Randomized Design is the team captain, then Mixed-Methods Design is the Renaissance player—skilled in multiple areas and able to bring them all together for a winning strategy.
14) Multivariate Design
Now, let's turn our attention to Multivariate Design, the multitasker of the research world.
If our lineup of research designs were like players on a basketball court, Multivariate Design would be the player dribbling, passing, and shooting all at once. This design doesn't just look at one or two things; it looks at several variables simultaneously to see how they interact and affect each other.
Multivariate Design is like baking a cake with many ingredients. Instead of just looking at how flour affects the cake, you also consider sugar, eggs, and milk all at once. This way, you understand how everything works together to make the cake taste good or bad.
Multivariate Design has been a go-to method in psychology, economics, and social sciences since the latter half of the 20th century. With the advent of computers and advanced statistical software, analyzing multiple variables at once became a lot easier, and Multivariate Design soared in popularity.
Multivariate Design Pros
So, what's the benefit of using Multivariate Design? Its power lies in its complexity. By studying multiple variables at the same time, you can get a really rich, detailed understanding of what's going on.
Multivariate Design Cons
But that complexity can also be a drawback. With so many variables, it can be tough to tell which ones are really making a difference and which ones are just along for the ride.
Multivariate Design Uses
Imagine you're a coach trying to figure out the best strategy to win games. You wouldn't just look at how many points your star player scores; you'd also consider assists, rebounds, turnovers, and maybe even how loud the crowd is. A Multivariate Design would help you understand how all these factors work together to determine whether you win or lose.
A well-known example of Multivariate Design is in market research. Companies often use this approach to figure out how different factors—like price, packaging, and advertising—affect sales. By studying multiple variables at once, they can find the best combination to boost profits.
In our metaphorical research team, if True Experimental Design is the quarterback, Longitudinal Design is the wise elder, Factorial Design is the strategist, Cross-Sectional Design is the speedster, Correlational Design is the scout, Meta-Analysis is the coach, Non-Experimental Design is the journalist, Repeated Measures Design is the time traveler, Crossover Design is the utility player, Cluster Randomized Design is the team captain, and Mixed-Methods Design is the Renaissance player, then Multivariate Design is the multitasker—juggling many variables at once to get a fuller picture of what's happening.
15) Pretest-Posttest Design
Let's introduce Pretest-Posttest Design, the "Before and After" superstar of our research team. You've probably seen those before-and-after pictures in ads for weight loss programs or home renovations, right?
Well, this design is like that, but for science! Pretest-Posttest Design checks out what things are like before the experiment starts and then compares that to what things are like after the experiment ends.
This design is one of the classics, a staple in research for decades across various fields like psychology, education, and healthcare. It's so simple and straightforward that it has stayed popular for a long time.
In Pretest-Posttest Design, you measure your subject's behavior or condition before you introduce any changes—that's your "before" or "pretest." Then you do your experiment, and after it's done, you measure the same thing again—that's your "after" or "posttest."
Pretest-Posttest Design Pros
What makes Pretest-Posttest Design special? It's pretty easy to understand and doesn't require fancy statistics.
Pretest-Posttest Design Cons
But there are some pitfalls. For example, what if the kids in our math example get better at multiplication just because they're older or because they've taken the test before? That would make it hard to tell if the program is really effective or not.
Pretest-Posttest Design Uses
Let's say you're a teacher and you want to know if a new math program helps kids get better at multiplication. First, you'd give all the kids a multiplication test—that's your pretest. Then you'd teach them using the new math program. At the end, you'd give them the same test again—that's your posttest. If the kids do better on the second test, you might conclude that the program works.
One famous use of Pretest-Posttest Design is in evaluating the effectiveness of driver's education courses. Researchers will measure people's driving skills before and after the course to see if they've improved.
16) Solomon Four-Group Design
Next up is the Solomon Four-Group Design, the "chess master" of our research team. This design is all about strategy and careful planning. Named after Richard L. Solomon who introduced it in the 1940s, this method tries to correct some of the weaknesses in simpler designs, like the Pretest-Posttest Design.
Here's how it rolls: The Solomon Four-Group Design uses four different groups to test a hypothesis. Two groups get a pretest, then one of them receives the treatment or intervention, and both get a posttest. The other two groups skip the pretest, and only one of them receives the treatment before they both get a posttest.
Sound complicated? It's like playing 4D chess; you're thinking several moves ahead!
Solomon Four-Group Design Pros
What's the pro and con of the Solomon Four-Group Design? On the plus side, it provides really robust results because it accounts for so many variables.
Solomon Four-Group Design Cons
The downside? It's a lot of work and requires a lot of participants, making it more time-consuming and costly.
Solomon Four-Group Design Uses
Let's say you want to figure out if a new way of teaching history helps students remember facts better. Two classes take a history quiz (pretest), then one class uses the new teaching method while the other sticks with the old way. Both classes take another quiz afterward (posttest).
Meanwhile, two more classes skip the initial quiz, and then one uses the new method before both take the final quiz. Comparing all four groups will give you a much clearer picture of whether the new teaching method works and whether the pretest itself affects the outcome.
The Solomon Four-Group Design is less commonly used than simpler designs but is highly respected for its ability to control for more variables. It's a favorite in educational and psychological research where you really want to dig deep and figure out what's actually causing changes.
17) Adaptive Designs
Now, let's talk about Adaptive Designs, the chameleons of the experimental world.
Imagine you're a detective, and halfway through solving a case, you find a clue that changes everything. You wouldn't just stick to your old plan; you'd adapt and change your approach, right? That's exactly what Adaptive Designs allow researchers to do.
In an Adaptive Design, researchers can make changes to the study as it's happening, based on early results. In a traditional study, once you set your plan, you stick to it from start to finish.
Adaptive Design Pros
This method is particularly useful in fast-paced or high-stakes situations, like developing a new vaccine in the middle of a pandemic. The ability to adapt can save both time and resources, and more importantly, it can save lives by getting effective treatments out faster.
Adaptive Design Cons
But Adaptive Designs aren't without their drawbacks. They can be very complex to plan and carry out, and there's always a risk that the changes made during the study could introduce bias or errors.
Adaptive Design Uses
Adaptive Designs are most often seen in clinical trials, particularly in the medical and pharmaceutical fields.
For instance, if a new drug is showing really promising results, the study might be adjusted to give more participants the new treatment instead of a placebo. Or if one dose level is showing bad side effects, it might be dropped from the study.
The best part is, these changes are pre-planned. Researchers lay out in advance what changes might be made and under what conditions, which helps keep everything scientific and above board.
In terms of applications, besides their heavy usage in medical and pharmaceutical research, Adaptive Designs are also becoming increasingly popular in software testing and market research. In these fields, being able to quickly adjust to early results can give companies a significant advantage.
Adaptive Designs are like the agile startups of the research world—quick to pivot, keen to learn from ongoing results, and focused on rapid, efficient progress. However, they require a great deal of expertise and careful planning to ensure that the adaptability doesn't compromise the integrity of the research.
18) Bayesian Designs
Next, let's dive into Bayesian Designs, the data detectives of the research universe. Named after Thomas Bayes, an 18th-century statistician and minister, this design doesn't just look at what's happening now; it also takes into account what's happened before.
Imagine if you were a detective who not only looked at the evidence in front of you but also used your past cases to make better guesses about your current one. That's the essence of Bayesian Designs.
Bayesian Designs are like detective work in science. As you gather more clues (or data), you update your best guess on what's really happening. This way, your experiment gets smarter as it goes along.
In the world of research, Bayesian Designs are most notably used in areas where you have some prior knowledge that can inform your current study. For example, if earlier research shows that a certain type of medicine usually works well for a specific illness, a Bayesian Design would include that information when studying a new group of patients with the same illness.
Bayesian Design Pros
One of the major advantages of Bayesian Designs is their efficiency. Because they use existing data to inform the current experiment, often fewer resources are needed to reach a reliable conclusion.
Bayesian Design Cons
However, they can be quite complicated to set up and require a deep understanding of both statistics and the subject matter at hand.
Bayesian Design Uses
Bayesian Designs are highly valued in medical research, finance, environmental science, and even in Internet search algorithms. Their ability to continually update and refine hypotheses based on new evidence makes them particularly useful in fields where data is constantly evolving and where quick, informed decisions are crucial.
Here's a real-world example: In the development of personalized medicine, where treatments are tailored to individual patients, Bayesian Designs are invaluable. If a treatment has been effective for patients with similar genetics or symptoms in the past, a Bayesian approach can use that data to predict how well it might work for a new patient.
This type of design is also increasingly popular in machine learning and artificial intelligence. In these fields, Bayesian Designs help algorithms "learn" from past data to make better predictions or decisions in new situations. It's like teaching a computer to be a detective that gets better and better at solving puzzles the more puzzles it sees.
19) Covariate Adaptive Randomization

Now let's turn our attention to Covariate Adaptive Randomization, which you can think of as the "matchmaker" of experimental designs.
Picture a soccer coach trying to create the most balanced teams for a friendly match. They wouldn't just randomly assign players; they'd take into account each player's skills, experience, and other traits.
Covariate Adaptive Randomization is all about creating the most evenly matched groups possible for an experiment.
In traditional randomization, participants are allocated to different groups purely by chance. This is a pretty fair way to do things, but it can sometimes lead to unbalanced groups.
Imagine if all the professional-level players ended up on one soccer team and all the beginners on another; that wouldn't be a very informative match! Covariate Adaptive Randomization fixes this by using important traits or characteristics (called "covariates") to guide the randomization process.
Covariate Adaptive Randomization Pros
The benefits of this design are pretty clear: it aims for balance and fairness, making the final results more trustworthy.
Covariate Adaptive Randomization Cons
But it's not perfect. It can be complex to implement and requires a deep understanding of which characteristics are most important to balance.
Covariate Adaptive Randomization Uses
This design is particularly useful in medical trials. Let's say researchers are testing a new medication for high blood pressure. Participants might have different ages, weights, or pre-existing conditions that could affect the results.
Covariate Adaptive Randomization would make sure that each treatment group has a similar mix of these characteristics, making the results more reliable and easier to interpret.
In practical terms, this design is often seen in clinical trials for new drugs or therapies, but its principles are also applicable in fields like psychology, education, and social sciences.
For instance, in educational research, it might be used to ensure that classrooms being compared have similar distributions of students in terms of academic ability, socioeconomic status, and other factors.
Covariate Adaptive Randomization is like the wise elder of the group, ensuring that everyone has an equal opportunity to show their true capabilities, thereby making the collective results as reliable as possible.
20) Stepped Wedge Design
Let's now focus on the Stepped Wedge Design, a thoughtful and cautious member of the experimental design family.
Imagine you're trying out a new gardening technique, but you're not sure how well it will work. You decide to apply it to one section of your garden first, watch how it performs, and then gradually extend the technique to other sections. This way, you get to see its effects over time and across different conditions. That's basically how Stepped Wedge Design works.
In a Stepped Wedge Design, all participants or clusters start off in the control group, and then, at different times, they 'step' over to the intervention or treatment group. This creates a wedge-like pattern over time where more and more participants receive the treatment as the study progresses. It's like rolling out a new policy in phases, monitoring its impact at each stage before extending it to more people.
Stepped Wedge Design Pros
The Stepped Wedge Design offers several advantages. Firstly, it allows for the study of interventions that are expected to do more good than harm, which makes it ethically appealing.
Secondly, it's useful when resources are limited and it's not feasible to roll out a new treatment to everyone at once. Lastly, because everyone eventually receives the treatment, it can be easier to get buy-in from participants or organizations involved in the study.
Stepped Wedge Design Cons
However, this design can be complex to analyze because it has to account for both the time factor and the changing conditions in each 'step' of the wedge. And like any study where participants know they're receiving an intervention, there's the potential for the results to be influenced by the placebo effect or other biases.
Stepped Wedge Design Uses
This design is particularly useful in health and social care research. For instance, if a hospital wants to implement a new hygiene protocol, it might start in one department, assess its impact, and then roll it out to other departments over time. This allows the hospital to adjust and refine the new protocol based on real-world data before it's fully implemented.
In terms of applications, Stepped Wedge Designs are commonly used in public health initiatives, organizational changes in healthcare settings, and social policy trials. They are particularly useful in situations where an intervention is being rolled out gradually and it's important to understand its impacts at each stage.
21) Sequential Design
Next up is Sequential Design, the dynamic and flexible member of our experimental design family.
Imagine you're playing a video game where you can choose different paths. If you take one path and find a treasure chest, you might decide to continue in that direction. If you hit a dead end, you might backtrack and try a different route. Sequential Design operates in a similar fashion, allowing researchers to make decisions at different stages based on what they've learned so far.
In a Sequential Design, the experiment is broken down into smaller parts, or "sequences." After each sequence, researchers pause to look at the data they've collected. Based on those findings, they then decide whether to stop the experiment because they've got enough information, or to continue and perhaps even modify the next sequence.
Sequential Design Pros
This allows for a more efficient use of resources, as you're only continuing with the experiment if the data suggests it's worth doing so.
One of the great things about Sequential Design is its efficiency. Because you're making data-driven decisions along the way, you can often reach conclusions more quickly and with fewer resources.
Sequential Design Cons
However, it requires careful planning and expertise to ensure that these "stop or go" decisions are made correctly and without bias.
Sequential Design Uses
In terms of its applications, besides healthcare and medicine, Sequential Design is also popular in quality control in manufacturing, environmental monitoring, and financial modeling. In these areas, being able to make quick decisions based on incoming data can be a big advantage.
This design is often used in clinical trials involving new medications or treatments. For example, if early results show that a new drug has significant side effects, the trial can be stopped before more people are exposed to it.
On the flip side, if the drug is showing promising results, the trial might be expanded to include more participants or to extend the testing period.
Think of Sequential Design as the nimble athlete of experimental designs, capable of quick pivots and adjustments to reach the finish line in the most effective way possible. But just like an athlete needs a good coach, this design requires expert oversight to make sure it stays on the right track.
22) Field Experiments
Last but certainly not least, let's explore Field Experiments—the adventurers of the experimental design world.
Picture a scientist leaving the controlled environment of a lab to test a theory in the real world, like a biologist studying animals in their natural habitat or a social scientist observing people in a real community. These are Field Experiments, and they're all about getting out there and gathering data in real-world settings.
Field Experiments embrace the messiness of the real world, unlike laboratory experiments, where everything is controlled down to the smallest detail. This makes them both exciting and challenging.
Field Experiment Pros
On one hand, the results often give us a better understanding of how things work outside the lab.
While Field Experiments offer real-world relevance, they come with challenges like controlling for outside factors and the ethical considerations of intervening in people's lives without their knowledge.
Field Experiment Cons
On the other hand, the lack of control can make it harder to tell exactly what's causing what. Yet, despite these challenges, they remain a valuable tool for researchers who want to understand how theories play out in the real world.
Field Experiment Uses
Let's say a school wants to improve student performance. In a Field Experiment, they might change the school's daily schedule for one semester and keep track of how students perform compared to another school where the schedule remained the same.
Because the study is happening in a real school with real students, the results could be very useful for understanding how the change might work in other schools. But since it's the real world, lots of other factors—like changes in teachers or even the weather—could affect the results.
Field Experiments are widely used in economics, psychology, education, and public policy. For example, you might have heard of the famous "Broken Windows" experiment in the 1980s that looked at how small signs of disorder, like broken windows or graffiti, could encourage more serious crime in neighborhoods. This experiment had a big impact on how cities think about crime prevention.
From the foundational concepts of control groups and independent variables to the sophisticated layouts like Covariate Adaptive Randomization and Sequential Design, it's clear that the realm of experimental design is as varied as it is fascinating.
We've seen that each design has its own special talents, ideal for specific situations. Some designs, like the Classic Controlled Experiment, are like reliable old friends you can always count on.
Others, like Sequential Design, are flexible and adaptable, making quick changes based on what they learn. And let's not forget the adventurous Field Experiments, which take us out of the lab and into the real world to discover things we might not see otherwise.
Choosing the right experimental design is like picking the right tool for the job. The method you choose can make a big difference in how reliable your results are and how much people will trust what you've discovered. And as we've learned, there's a design to suit just about every question, every problem, and every curiosity.
So the next time you read about a new discovery in medicine, psychology, or any other field, you'll have a better understanding of the thought and planning that went into figuring things out. Experimental design is more than just a set of rules; it's a structured way to explore the unknown and answer questions that can change the world.
Related posts:
- Experimental Psychologist Career (Salary + Duties + Interviews)
- 40+ Famous Psychologists (Images + Biographies)
- 11+ Psychology Experiment Ideas (Goals + Methods)
- The Little Albert Experiment
- 41+ White Collar Job Examples (Salary + Path)
Reference this article:
About The Author
Free Personality Test

Free Memory Test

Free IQ Test

PracticalPie.com is a participant in the Amazon Associates Program. As an Amazon Associate we earn from qualifying purchases.
Follow Us On:
Youtube Facebook Instagram X/Twitter
Psychology Resources
Developmental
Personality
Relationships
Psychologists
Serial Killers
Psychology Tests
Personality Quiz
Memory Test
Depression test
Type A/B Personality Test
© PracticalPsychology. All rights reserved
Privacy Policy | Terms of Use

Experimental Research Design — 6 mistakes you should never make!
Since school days’ students perform scientific experiments that provide results that define and prove the laws and theorems in science. These experiments are laid on a strong foundation of experimental research designs.
An experimental research design helps researchers execute their research objectives with more clarity and transparency.
In this article, we will not only discuss the key aspects of experimental research designs but also the issues to avoid and problems to resolve while designing your research study.
Table of Contents
What Is Experimental Research Design?
Experimental research design is a framework of protocols and procedures created to conduct experimental research with a scientific approach using two sets of variables. Herein, the first set of variables acts as a constant, used to measure the differences of the second set. The best example of experimental research methods is quantitative research .
Experimental research helps a researcher gather the necessary data for making better research decisions and determining the facts of a research study.
When Can a Researcher Conduct Experimental Research?
A researcher can conduct experimental research in the following situations —
- When time is an important factor in establishing a relationship between the cause and effect.
- When there is an invariable or never-changing behavior between the cause and effect.
- Finally, when the researcher wishes to understand the importance of the cause and effect.
Importance of Experimental Research Design
To publish significant results, choosing a quality research design forms the foundation to build the research study. Moreover, effective research design helps establish quality decision-making procedures, structures the research to lead to easier data analysis, and addresses the main research question. Therefore, it is essential to cater undivided attention and time to create an experimental research design before beginning the practical experiment.
By creating a research design, a researcher is also giving oneself time to organize the research, set up relevant boundaries for the study, and increase the reliability of the results. Through all these efforts, one could also avoid inconclusive results. If any part of the research design is flawed, it will reflect on the quality of the results derived.
Types of Experimental Research Designs
Based on the methods used to collect data in experimental studies, the experimental research designs are of three primary types:
1. Pre-experimental Research Design
A research study could conduct pre-experimental research design when a group or many groups are under observation after implementing factors of cause and effect of the research. The pre-experimental design will help researchers understand whether further investigation is necessary for the groups under observation.
Pre-experimental research is of three types —
- One-shot Case Study Research Design
- One-group Pretest-posttest Research Design
- Static-group Comparison
2. True Experimental Research Design
A true experimental research design relies on statistical analysis to prove or disprove a researcher’s hypothesis. It is one of the most accurate forms of research because it provides specific scientific evidence. Furthermore, out of all the types of experimental designs, only a true experimental design can establish a cause-effect relationship within a group. However, in a true experiment, a researcher must satisfy these three factors —
- There is a control group that is not subjected to changes and an experimental group that will experience the changed variables
- A variable that can be manipulated by the researcher
- Random distribution of the variables
This type of experimental research is commonly observed in the physical sciences.
3. Quasi-experimental Research Design
The word “Quasi” means similarity. A quasi-experimental design is similar to a true experimental design. However, the difference between the two is the assignment of the control group. In this research design, an independent variable is manipulated, but the participants of a group are not randomly assigned. This type of research design is used in field settings where random assignment is either irrelevant or not required.
The classification of the research subjects, conditions, or groups determines the type of research design to be used.

Advantages of Experimental Research
Experimental research allows you to test your idea in a controlled environment before taking the research to clinical trials. Moreover, it provides the best method to test your theory because of the following advantages:
- Researchers have firm control over variables to obtain results.
- The subject does not impact the effectiveness of experimental research. Anyone can implement it for research purposes.
- The results are specific.
- Post results analysis, research findings from the same dataset can be repurposed for similar research ideas.
- Researchers can identify the cause and effect of the hypothesis and further analyze this relationship to determine in-depth ideas.
- Experimental research makes an ideal starting point. The collected data could be used as a foundation to build new research ideas for further studies.
6 Mistakes to Avoid While Designing Your Research
There is no order to this list, and any one of these issues can seriously compromise the quality of your research. You could refer to the list as a checklist of what to avoid while designing your research.
1. Invalid Theoretical Framework
Usually, researchers miss out on checking if their hypothesis is logical to be tested. If your research design does not have basic assumptions or postulates, then it is fundamentally flawed and you need to rework on your research framework.
2. Inadequate Literature Study
Without a comprehensive research literature review , it is difficult to identify and fill the knowledge and information gaps. Furthermore, you need to clearly state how your research will contribute to the research field, either by adding value to the pertinent literature or challenging previous findings and assumptions.
3. Insufficient or Incorrect Statistical Analysis
Statistical results are one of the most trusted scientific evidence. The ultimate goal of a research experiment is to gain valid and sustainable evidence. Therefore, incorrect statistical analysis could affect the quality of any quantitative research.
4. Undefined Research Problem
This is one of the most basic aspects of research design. The research problem statement must be clear and to do that, you must set the framework for the development of research questions that address the core problems.
5. Research Limitations
Every study has some type of limitations . You should anticipate and incorporate those limitations into your conclusion, as well as the basic research design. Include a statement in your manuscript about any perceived limitations, and how you considered them while designing your experiment and drawing the conclusion.
6. Ethical Implications
The most important yet less talked about topic is the ethical issue. Your research design must include ways to minimize any risk for your participants and also address the research problem or question at hand. If you cannot manage the ethical norms along with your research study, your research objectives and validity could be questioned.
Experimental Research Design Example
In an experimental design, a researcher gathers plant samples and then randomly assigns half the samples to photosynthesize in sunlight and the other half to be kept in a dark box without sunlight, while controlling all the other variables (nutrients, water, soil, etc.)
By comparing their outcomes in biochemical tests, the researcher can confirm that the changes in the plants were due to the sunlight and not the other variables.
Experimental research is often the final form of a study conducted in the research process which is considered to provide conclusive and specific results. But it is not meant for every research. It involves a lot of resources, time, and money and is not easy to conduct, unless a foundation of research is built. Yet it is widely used in research institutes and commercial industries, for its most conclusive results in the scientific approach.
Have you worked on research designs? How was your experience creating an experimental design? What difficulties did you face? Do write to us or comment below and share your insights on experimental research designs!
Frequently Asked Questions
Randomization is important in an experimental research because it ensures unbiased results of the experiment. It also measures the cause-effect relationship on a particular group of interest.
Experimental research design lay the foundation of a research and structures the research to establish quality decision making process.
There are 3 types of experimental research designs. These are pre-experimental research design, true experimental research design, and quasi experimental research design.
The difference between an experimental and a quasi-experimental design are: 1. The assignment of the control group in quasi experimental research is non-random, unlike true experimental design, which is randomly assigned. 2. Experimental research group always has a control group; on the other hand, it may not be always present in quasi experimental research.
Experimental research establishes a cause-effect relationship by testing a theory or hypothesis using experimental groups or control variables. In contrast, descriptive research describes a study or a topic by defining the variables under it and answering the questions related to the same.

good and valuable
Very very good
Good presentation.
Rate this article Cancel Reply
Your email address will not be published.

Enago Academy's Most Popular Articles

- Publishing Research
- Reporting Research
How to Optimize Your Research Process: A step-by-step guide
For researchers across disciplines, the path to uncovering novel findings and insights is often filled…

- Industry News
- Trending Now
Breaking Barriers: Sony and Nature unveil “Women in Technology Award”
Sony Group Corporation and the prestigious scientific journal Nature have collaborated to launch the inaugural…

Achieving Research Excellence: Checklist for good research practices
Academia is built on the foundation of trustworthy and high-quality research, supported by the pillars…

- Promoting Research
Plain Language Summary — Communicating your research to bridge the academic-lay gap
Science can be complex, but does that mean it should not be accessible to the…

Science under Surveillance: Journals adopt advanced AI to uncover image manipulation
Journals are increasingly turning to cutting-edge AI tools to uncover deceitful images published in manuscripts.…
Choosing the Right Analytical Approach: Thematic analysis vs. content analysis for…
Comparing Cross Sectional and Longitudinal Studies: 5 steps for choosing the right…
Research Recommendations – Guiding policy-makers for evidence-based decision making

Sign-up to read more
Subscribe for free to get unrestricted access to all our resources on research writing and academic publishing including:
- 2000+ blog articles
- 50+ Webinars
- 10+ Expert podcasts
- 50+ Infographics
- 10+ Checklists
- Research Guides
We hate spam too. We promise to protect your privacy and never spam you.
I am looking for Editing/ Proofreading services for my manuscript Tentative date of next journal submission:

As a researcher, what do you consider most when choosing an image manipulation detector?
Have a language expert improve your writing
Run a free plagiarism check in 10 minutes, automatically generate references for free.
- Knowledge Base
- Methodology
- A Quick Guide to Experimental Design | 5 Steps & Examples
A Quick Guide to Experimental Design | 5 Steps & Examples
Published on 11 April 2022 by Rebecca Bevans . Revised on 5 December 2022.
Experiments are used to study causal relationships . You manipulate one or more independent variables and measure their effect on one or more dependent variables.
Experimental design means creating a set of procedures to systematically test a hypothesis . A good experimental design requires a strong understanding of the system you are studying.
There are five key steps in designing an experiment:
- Consider your variables and how they are related
- Write a specific, testable hypothesis
- Design experimental treatments to manipulate your independent variable
- Assign subjects to groups, either between-subjects or within-subjects
- Plan how you will measure your dependent variable
For valid conclusions, you also need to select a representative sample and control any extraneous variables that might influence your results. If if random assignment of participants to control and treatment groups is impossible, unethical, or highly difficult, consider an observational study instead.
Table of contents
Step 1: define your variables, step 2: write your hypothesis, step 3: design your experimental treatments, step 4: assign your subjects to treatment groups, step 5: measure your dependent variable, frequently asked questions about experimental design.
You should begin with a specific research question . We will work with two research question examples, one from health sciences and one from ecology:
To translate your research question into an experimental hypothesis, you need to define the main variables and make predictions about how they are related.
Start by simply listing the independent and dependent variables .
Then you need to think about possible extraneous and confounding variables and consider how you might control them in your experiment.
Finally, you can put these variables together into a diagram. Use arrows to show the possible relationships between variables and include signs to show the expected direction of the relationships.

Here we predict that increasing temperature will increase soil respiration and decrease soil moisture, while decreasing soil moisture will lead to decreased soil respiration.
Prevent plagiarism, run a free check.
Now that you have a strong conceptual understanding of the system you are studying, you should be able to write a specific, testable hypothesis that addresses your research question.
The next steps will describe how to design a controlled experiment . In a controlled experiment, you must be able to:
- Systematically and precisely manipulate the independent variable(s).
- Precisely measure the dependent variable(s).
- Control any potential confounding variables.
If your study system doesn’t match these criteria, there are other types of research you can use to answer your research question.
How you manipulate the independent variable can affect the experiment’s external validity – that is, the extent to which the results can be generalised and applied to the broader world.
First, you may need to decide how widely to vary your independent variable.
- just slightly above the natural range for your study region.
- over a wider range of temperatures to mimic future warming.
- over an extreme range that is beyond any possible natural variation.
Second, you may need to choose how finely to vary your independent variable. Sometimes this choice is made for you by your experimental system, but often you will need to decide, and this will affect how much you can infer from your results.
- a categorical variable : either as binary (yes/no) or as levels of a factor (no phone use, low phone use, high phone use).
- a continuous variable (minutes of phone use measured every night).
How you apply your experimental treatments to your test subjects is crucial for obtaining valid and reliable results.
First, you need to consider the study size : how many individuals will be included in the experiment? In general, the more subjects you include, the greater your experiment’s statistical power , which determines how much confidence you can have in your results.
Then you need to randomly assign your subjects to treatment groups . Each group receives a different level of the treatment (e.g. no phone use, low phone use, high phone use).
You should also include a control group , which receives no treatment. The control group tells us what would have happened to your test subjects without any experimental intervention.
When assigning your subjects to groups, there are two main choices you need to make:
- A completely randomised design vs a randomised block design .
- A between-subjects design vs a within-subjects design .
Randomisation
An experiment can be completely randomised or randomised within blocks (aka strata):
- In a completely randomised design , every subject is assigned to a treatment group at random.
- In a randomised block design (aka stratified random design), subjects are first grouped according to a characteristic they share, and then randomly assigned to treatments within those groups.
Sometimes randomisation isn’t practical or ethical , so researchers create partially-random or even non-random designs. An experimental design where treatments aren’t randomly assigned is called a quasi-experimental design .
Between-subjects vs within-subjects
In a between-subjects design (also known as an independent measures design or classic ANOVA design), individuals receive only one of the possible levels of an experimental treatment.
In medical or social research, you might also use matched pairs within your between-subjects design to make sure that each treatment group contains the same variety of test subjects in the same proportions.
In a within-subjects design (also known as a repeated measures design), every individual receives each of the experimental treatments consecutively, and their responses to each treatment are measured.
Within-subjects or repeated measures can also refer to an experimental design where an effect emerges over time, and individual responses are measured over time in order to measure this effect as it emerges.
Counterbalancing (randomising or reversing the order of treatments among subjects) is often used in within-subjects designs to ensure that the order of treatment application doesn’t influence the results of the experiment.
Finally, you need to decide how you’ll collect data on your dependent variable outcomes. You should aim for reliable and valid measurements that minimise bias or error.
Some variables, like temperature, can be objectively measured with scientific instruments. Others may need to be operationalised to turn them into measurable observations.
- Ask participants to record what time they go to sleep and get up each day.
- Ask participants to wear a sleep tracker.
How precisely you measure your dependent variable also affects the kinds of statistical analysis you can use on your data.
Experiments are always context-dependent, and a good experimental design will take into account all of the unique considerations of your study system to produce information that is both valid and relevant to your research question.
Experimental designs are a set of procedures that you plan in order to examine the relationship between variables that interest you.
To design a successful experiment, first identify:
- A testable hypothesis
- One or more independent variables that you will manipulate
- One or more dependent variables that you will measure
When designing the experiment, first decide:
- How your variable(s) will be manipulated
- How you will control for any potential confounding or lurking variables
- How many subjects you will include
- How you will assign treatments to your subjects
The key difference between observational studies and experiments is that, done correctly, an observational study will never influence the responses or behaviours of participants. Experimental designs will have a treatment condition applied to at least a portion of participants.
A confounding variable , also called a confounder or confounding factor, is a third variable in a study examining a potential cause-and-effect relationship.
A confounding variable is related to both the supposed cause and the supposed effect of the study. It can be difficult to separate the true effect of the independent variable from the effect of the confounding variable.
In your research design , it’s important to identify potential confounding variables and plan how you will reduce their impact.
In a between-subjects design , every participant experiences only one condition, and researchers assess group differences between participants in various conditions.
In a within-subjects design , each participant experiences all conditions, and researchers test the same participants repeatedly for differences between conditions.
The word ‘between’ means that you’re comparing different conditions between groups, while the word ‘within’ means you’re comparing different conditions within the same group.
Cite this Scribbr article
If you want to cite this source, you can copy and paste the citation or click the ‘Cite this Scribbr article’ button to automatically add the citation to our free Reference Generator.
Bevans, R. (2022, December 05). A Quick Guide to Experimental Design | 5 Steps & Examples. Scribbr. Retrieved 14 May 2024, from https://www.scribbr.co.uk/research-methods/guide-to-experimental-design/
Is this article helpful?

Rebecca Bevans
- Experimental Research Designs: Types, Examples & Methods

Experimental research is the most familiar type of research design for individuals in the physical sciences and a host of other fields. This is mainly because experimental research is a classical scientific experiment, similar to those performed in high school science classes.
Imagine taking 2 samples of the same plant and exposing one of them to sunlight, while the other is kept away from sunlight. Let the plant exposed to sunlight be called sample A, while the latter is called sample B.
If after the duration of the research, we find out that sample A grows and sample B dies, even though they are both regularly wetted and given the same treatment. Therefore, we can conclude that sunlight will aid growth in all similar plants.
What is Experimental Research?
Experimental research is a scientific approach to research, where one or more independent variables are manipulated and applied to one or more dependent variables to measure their effect on the latter. The effect of the independent variables on the dependent variables is usually observed and recorded over some time, to aid researchers in drawing a reasonable conclusion regarding the relationship between these 2 variable types.
The experimental research method is widely used in physical and social sciences, psychology, and education. It is based on the comparison between two or more groups with a straightforward logic, which may, however, be difficult to execute.
Mostly related to a laboratory test procedure, experimental research designs involve collecting quantitative data and performing statistical analysis on them during research. Therefore, making it an example of quantitative research method .
What are The Types of Experimental Research Design?
The types of experimental research design are determined by the way the researcher assigns subjects to different conditions and groups. They are of 3 types, namely; pre-experimental, quasi-experimental, and true experimental research.
Pre-experimental Research Design
In pre-experimental research design, either a group or various dependent groups are observed for the effect of the application of an independent variable which is presumed to cause change. It is the simplest form of experimental research design and is treated with no control group.
Although very practical, experimental research is lacking in several areas of the true-experimental criteria. The pre-experimental research design is further divided into three types
- One-shot Case Study Research Design
In this type of experimental study, only one dependent group or variable is considered. The study is carried out after some treatment which was presumed to cause change, making it a posttest study.
- One-group Pretest-posttest Research Design:
This research design combines both posttest and pretest study by carrying out a test on a single group before the treatment is administered and after the treatment is administered. With the former being administered at the beginning of treatment and later at the end.
- Static-group Comparison:
In a static-group comparison study, 2 or more groups are placed under observation, where only one of the groups is subjected to some treatment while the other groups are held static. All the groups are post-tested, and the observed differences between the groups are assumed to be a result of the treatment.
Quasi-experimental Research Design
The word “quasi” means partial, half, or pseudo. Therefore, the quasi-experimental research bearing a resemblance to the true experimental research, but not the same. In quasi-experiments, the participants are not randomly assigned, and as such, they are used in settings where randomization is difficult or impossible.
This is very common in educational research, where administrators are unwilling to allow the random selection of students for experimental samples.
Some examples of quasi-experimental research design include; the time series, no equivalent control group design, and the counterbalanced design.
True Experimental Research Design
The true experimental research design relies on statistical analysis to approve or disprove a hypothesis. It is the most accurate type of experimental design and may be carried out with or without a pretest on at least 2 randomly assigned dependent subjects.
The true experimental research design must contain a control group, a variable that can be manipulated by the researcher, and the distribution must be random. The classification of true experimental design include:
- The posttest-only Control Group Design: In this design, subjects are randomly selected and assigned to the 2 groups (control and experimental), and only the experimental group is treated. After close observation, both groups are post-tested, and a conclusion is drawn from the difference between these groups.
- The pretest-posttest Control Group Design: For this control group design, subjects are randomly assigned to the 2 groups, both are presented, but only the experimental group is treated. After close observation, both groups are post-tested to measure the degree of change in each group.
- Solomon four-group Design: This is the combination of the pretest-only and the pretest-posttest control groups. In this case, the randomly selected subjects are placed into 4 groups.
The first two of these groups are tested using the posttest-only method, while the other two are tested using the pretest-posttest method.
Examples of Experimental Research
Experimental research examples are different, depending on the type of experimental research design that is being considered. The most basic example of experimental research is laboratory experiments, which may differ in nature depending on the subject of research.
Administering Exams After The End of Semester
During the semester, students in a class are lectured on particular courses and an exam is administered at the end of the semester. In this case, the students are the subjects or dependent variables while the lectures are the independent variables treated on the subjects.
Only one group of carefully selected subjects are considered in this research, making it a pre-experimental research design example. We will also notice that tests are only carried out at the end of the semester, and not at the beginning.
Further making it easy for us to conclude that it is a one-shot case study research.
Employee Skill Evaluation
Before employing a job seeker, organizations conduct tests that are used to screen out less qualified candidates from the pool of qualified applicants. This way, organizations can determine an employee’s skill set at the point of employment.
In the course of employment, organizations also carry out employee training to improve employee productivity and generally grow the organization. Further evaluation is carried out at the end of each training to test the impact of the training on employee skills, and test for improvement.
Here, the subject is the employee, while the treatment is the training conducted. This is a pretest-posttest control group experimental research example.
Evaluation of Teaching Method
Let us consider an academic institution that wants to evaluate the teaching method of 2 teachers to determine which is best. Imagine a case whereby the students assigned to each teacher is carefully selected probably due to personal request by parents or due to stubbornness and smartness.
This is a no equivalent group design example because the samples are not equal. By evaluating the effectiveness of each teacher’s teaching method this way, we may conclude after a post-test has been carried out.
However, this may be influenced by factors like the natural sweetness of a student. For example, a very smart student will grab more easily than his or her peers irrespective of the method of teaching.
What are the Characteristics of Experimental Research?
Experimental research contains dependent, independent and extraneous variables. The dependent variables are the variables being treated or manipulated and are sometimes called the subject of the research.
The independent variables are the experimental treatment being exerted on the dependent variables. Extraneous variables, on the other hand, are other factors affecting the experiment that may also contribute to the change.
The setting is where the experiment is carried out. Many experiments are carried out in the laboratory, where control can be exerted on the extraneous variables, thereby eliminating them.
Other experiments are carried out in a less controllable setting. The choice of setting used in research depends on the nature of the experiment being carried out.
- Multivariable
Experimental research may include multiple independent variables, e.g. time, skills, test scores, etc.
Why Use Experimental Research Design?
Experimental research design can be majorly used in physical sciences, social sciences, education, and psychology. It is used to make predictions and draw conclusions on a subject matter.
Some uses of experimental research design are highlighted below.
- Medicine: Experimental research is used to provide the proper treatment for diseases. In most cases, rather than directly using patients as the research subject, researchers take a sample of the bacteria from the patient’s body and are treated with the developed antibacterial
The changes observed during this period are recorded and evaluated to determine its effectiveness. This process can be carried out using different experimental research methods.
- Education: Asides from science subjects like Chemistry and Physics which involves teaching students how to perform experimental research, it can also be used in improving the standard of an academic institution. This includes testing students’ knowledge on different topics, coming up with better teaching methods, and the implementation of other programs that will aid student learning.
- Human Behavior: Social scientists are the ones who mostly use experimental research to test human behaviour. For example, consider 2 people randomly chosen to be the subject of the social interaction research where one person is placed in a room without human interaction for 1 year.
The other person is placed in a room with a few other people, enjoying human interaction. There will be a difference in their behaviour at the end of the experiment.
- UI/UX: During the product development phase, one of the major aims of the product team is to create a great user experience with the product. Therefore, before launching the final product design, potential are brought in to interact with the product.
For example, when finding it difficult to choose how to position a button or feature on the app interface, a random sample of product testers are allowed to test the 2 samples and how the button positioning influences the user interaction is recorded.
What are the Disadvantages of Experimental Research?
- It is highly prone to human error due to its dependency on variable control which may not be properly implemented. These errors could eliminate the validity of the experiment and the research being conducted.
- Exerting control of extraneous variables may create unrealistic situations. Eliminating real-life variables will result in inaccurate conclusions. This may also result in researchers controlling the variables to suit his or her personal preferences.
- It is a time-consuming process. So much time is spent on testing dependent variables and waiting for the effect of the manipulation of dependent variables to manifest.
- It is expensive.
- It is very risky and may have ethical complications that cannot be ignored. This is common in medical research, where failed trials may lead to a patient’s death or a deteriorating health condition.
- Experimental research results are not descriptive.
- Response bias can also be supplied by the subject of the conversation.
- Human responses in experimental research can be difficult to measure.
What are the Data Collection Methods in Experimental Research?
Data collection methods in experimental research are the different ways in which data can be collected for experimental research. They are used in different cases, depending on the type of research being carried out.
1. Observational Study
This type of study is carried out over a long period. It measures and observes the variables of interest without changing existing conditions.
When researching the effect of social interaction on human behavior, the subjects who are placed in 2 different environments are observed throughout the research. No matter the kind of absurd behavior that is exhibited by the subject during this period, its condition will not be changed.
This may be a very risky thing to do in medical cases because it may lead to death or worse medical conditions.
2. Simulations
This procedure uses mathematical, physical, or computer models to replicate a real-life process or situation. It is frequently used when the actual situation is too expensive, dangerous, or impractical to replicate in real life.
This method is commonly used in engineering and operational research for learning purposes and sometimes as a tool to estimate possible outcomes of real research. Some common situation software are Simulink, MATLAB, and Simul8.
Not all kinds of experimental research can be carried out using simulation as a data collection tool . It is very impractical for a lot of laboratory-based research that involves chemical processes.
A survey is a tool used to gather relevant data about the characteristics of a population and is one of the most common data collection tools. A survey consists of a group of questions prepared by the researcher, to be answered by the research subject.
Surveys can be shared with the respondents both physically and electronically. When collecting data through surveys, the kind of data collected depends on the respondent, and researchers have limited control over it.
Formplus is the best tool for collecting experimental data using survey s. It has relevant features that will aid the data collection process and can also be used in other aspects of experimental research.
Differences between Experimental and Non-Experimental Research
1. In experimental research, the researcher can control and manipulate the environment of the research, including the predictor variable which can be changed. On the other hand, non-experimental research cannot be controlled or manipulated by the researcher at will.
This is because it takes place in a real-life setting, where extraneous variables cannot be eliminated. Therefore, it is more difficult to conclude non-experimental studies, even though they are much more flexible and allow for a greater range of study fields.
2. The relationship between cause and effect cannot be established in non-experimental research, while it can be established in experimental research. This may be because many extraneous variables also influence the changes in the research subject, making it difficult to point at a particular variable as the cause of a particular change
3. Independent variables are not introduced, withdrawn, or manipulated in non-experimental designs, but the same may not be said about experimental research.
Conclusion
Experimental research designs are often considered to be the standard in research designs. This is partly due to the common misconception that research is equivalent to scientific experiments—a component of experimental research design.
In this research design, one or more subjects or dependent variables are randomly assigned to different treatments (i.e. independent variables manipulated by the researcher) and the results are observed to conclude. One of the uniqueness of experimental research is in its ability to control the effect of extraneous variables.
Experimental research is suitable for research whose goal is to examine cause-effect relationships, e.g. explanatory research. It can be conducted in the laboratory or field settings, depending on the aim of the research that is being carried out.
Connect to Formplus, Get Started Now - It's Free!
- examples of experimental research
- experimental research methods
- types of experimental research
- busayo.longe
You may also like:
Simpson’s Paradox & How to Avoid it in Experimental Research
In this article, we are going to look at Simpson’s Paradox from its historical point and later, we’ll consider its effect in...
Response vs Explanatory Variables: Definition & Examples
In this article, we’ll be comparing the two types of variables, what they both mean and see some of their real-life applications in research
What is Experimenter Bias? Definition, Types & Mitigation
In this article, we will look into the concept of experimental bias and how it can be identified in your research
Experimental Vs Non-Experimental Research: 15 Key Differences
Differences between experimental and non experimental research on definitions, types, examples, data collection tools, uses, advantages etc.
Formplus - For Seamless Data Collection
Collect data the right way with a versatile data collection tool. try formplus and transform your work productivity today..
Chapter 10 Experimental Research
Experimental research, often considered to be the “gold standard” in research designs, is one of the most rigorous of all research designs. In this design, one or more independent variables are manipulated by the researcher (as treatments), subjects are randomly assigned to different treatment levels (random assignment), and the results of the treatments on outcomes (dependent variables) are observed. The unique strength of experimental research is its internal validity (causality) due to its ability to link cause and effect through treatment manipulation, while controlling for the spurious effect of extraneous variable.
Experimental research is best suited for explanatory research (rather than for descriptive or exploratory research), where the goal of the study is to examine cause-effect relationships. It also works well for research that involves a relatively limited and well-defined set of independent variables that can either be manipulated or controlled. Experimental research can be conducted in laboratory or field settings. Laboratory experiments , conducted in laboratory (artificial) settings, tend to be high in internal validity, but this comes at the cost of low external validity (generalizability), because the artificial (laboratory) setting in which the study is conducted may not reflect the real world. Field experiments , conducted in field settings such as in a real organization, and high in both internal and external validity. But such experiments are relatively rare, because of the difficulties associated with manipulating treatments and controlling for extraneous effects in a field setting.
Experimental research can be grouped into two broad categories: true experimental designs and quasi-experimental designs. Both designs require treatment manipulation, but while true experiments also require random assignment, quasi-experiments do not. Sometimes, we also refer to non-experimental research, which is not really a research design, but an all-inclusive term that includes all types of research that do not employ treatment manipulation or random assignment, such as survey research, observational research, and correlational studies.
Basic Concepts
Treatment and control groups. In experimental research, some subjects are administered one or more experimental stimulus called a treatment (the treatment group ) while other subjects are not given such a stimulus (the control group ). The treatment may be considered successful if subjects in the treatment group rate more favorably on outcome variables than control group subjects. Multiple levels of experimental stimulus may be administered, in which case, there may be more than one treatment group. For example, in order to test the effects of a new drug intended to treat a certain medical condition like dementia, if a sample of dementia patients is randomly divided into three groups, with the first group receiving a high dosage of the drug, the second group receiving a low dosage, and the third group receives a placebo such as a sugar pill (control group), then the first two groups are experimental groups and the third group is a control group. After administering the drug for a period of time, if the condition of the experimental group subjects improved significantly more than the control group subjects, we can say that the drug is effective. We can also compare the conditions of the high and low dosage experimental groups to determine if the high dose is more effective than the low dose.
Treatment manipulation. Treatments are the unique feature of experimental research that sets this design apart from all other research methods. Treatment manipulation helps control for the “cause” in cause-effect relationships. Naturally, the validity of experimental research depends on how well the treatment was manipulated. Treatment manipulation must be checked using pretests and pilot tests prior to the experimental study. Any measurements conducted before the treatment is administered are called pretest measures , while those conducted after the treatment are posttest measures .
Random selection and assignment. Random selection is the process of randomly drawing a sample from a population or a sampling frame. This approach is typically employed in survey research, and assures that each unit in the population has a positive chance of being selected into the sample. Random assignment is however a process of randomly assigning subjects to experimental or control groups. This is a standard practice in true experimental research to ensure that treatment groups are similar (equivalent) to each other and to the control group, prior to treatment administration. Random selection is related to sampling, and is therefore, more closely related to the external validity (generalizability) of findings. However, random assignment is related to design, and is therefore most related to internal validity. It is possible to have both random selection and random assignment in well-designed experimental research, but quasi-experimental research involves neither random selection nor random assignment.
Threats to internal validity. Although experimental designs are considered more rigorous than other research methods in terms of the internal validity of their inferences (by virtue of their ability to control causes through treatment manipulation), they are not immune to internal validity threats. Some of these threats to internal validity are described below, within the context of a study of the impact of a special remedial math tutoring program for improving the math abilities of high school students.
- History threat is the possibility that the observed effects (dependent variables) are caused by extraneous or historical events rather than by the experimental treatment. For instance, students’ post-remedial math score improvement may have been caused by their preparation for a math exam at their school, rather than the remedial math program.
- Maturation threat refers to the possibility that observed effects are caused by natural maturation of subjects (e.g., a general improvement in their intellectual ability to understand complex concepts) rather than the experimental treatment.
- Testing threat is a threat in pre-post designs where subjects’ posttest responses are conditioned by their pretest responses. For instance, if students remember their answers from the pretest evaluation, they may tend to repeat them in the posttest exam. Not conducting a pretest can help avoid this threat.
- Instrumentation threat , which also occurs in pre-post designs, refers to the possibility that the difference between pretest and posttest scores is not due to the remedial math program, but due to changes in the administered test, such as the posttest having a higher or lower degree of difficulty than the pretest.
- Mortality threat refers to the possibility that subjects may be dropping out of the study at differential rates between the treatment and control groups due to a systematic reason, such that the dropouts were mostly students who scored low on the pretest. If the low-performing students drop out, the results of the posttest will be artificially inflated by the preponderance of high-performing students.
- Regression threat , also called a regression to the mean, refers to the statistical tendency of a group’s overall performance on a measure during a posttest to regress toward the mean of that measure rather than in the anticipated direction. For instance, if subjects scored high on a pretest, they will have a tendency to score lower on the posttest (closer to the mean) because their high scores (away from the mean) during the pretest was possibly a statistical aberration. This problem tends to be more prevalent in non-random samples and when the two measures are imperfectly correlated.
Two-Group Experimental Designs
The simplest true experimental designs are two group designs involving one treatment group and one control group, and are ideally suited for testing the effects of a single independent variable that can be manipulated as a treatment. The two basic two-group designs are the pretest-posttest control group design and the posttest-only control group design, while variations may include covariance designs. These designs are often depicted using a standardized design notation, where R represents random assignment of subjects to groups, X represents the treatment administered to the treatment group, and O represents pretest or posttest observations of the dependent variable (with different subscripts to distinguish between pretest and posttest observations of treatment and control groups).
Pretest-posttest control group design . In this design, subjects are randomly assigned to treatment and control groups, subjected to an initial (pretest) measurement of the dependent variables of interest, the treatment group is administered a treatment (representing the independent variable of interest), and the dependent variables measured again (posttest). The notation of this design is shown in Figure 10.1.

Figure 10.1. Pretest-posttest control group design
The effect E of the experimental treatment in the pretest posttest design is measured as the difference in the posttest and pretest scores between the treatment and control groups:
E = (O 2 – O 1 ) – (O 4 – O 3 )
Statistical analysis of this design involves a simple analysis of variance (ANOVA) between the treatment and control groups. The pretest posttest design handles several threats to internal validity, such as maturation, testing, and regression, since these threats can be expected to influence both treatment and control groups in a similar (random) manner. The selection threat is controlled via random assignment. However, additional threats to internal validity may exist. For instance, mortality can be a problem if there are differential dropout rates between the two groups, and the pretest measurement may bias the posttest measurement (especially if the pretest introduces unusual topics or content).
Posttest-only control group design . This design is a simpler version of the pretest-posttest design where pretest measurements are omitted. The design notation is shown in Figure 10.2.

Figure 10.2. Posttest only control group design.
The treatment effect is measured simply as the difference in the posttest scores between the two groups:
E = (O 1 – O 2 )
The appropriate statistical analysis of this design is also a two- group analysis of variance (ANOVA). The simplicity of this design makes it more attractive than the pretest-posttest design in terms of internal validity. This design controls for maturation, testing, regression, selection, and pretest-posttest interaction, though the mortality threat may continue to exist.
Covariance designs . Sometimes, measures of dependent variables may be influenced by extraneous variables called covariates . Covariates are those variables that are not of central interest to an experimental study, but should nevertheless be controlled in an experimental design in order to eliminate their potential effect on the dependent variable and therefore allow for a more accurate detection of the effects of the independent variables of interest. The experimental designs discussed earlier did not control for such covariates. A covariance design (also called a concomitant variable design) is a special type of pretest posttest control group design where the pretest measure is essentially a measurement of the covariates of interest rather than that of the dependent variables. The design notation is shown in Figure 10.3, where C represents the covariates:

Figure 10.3. Covariance design
Because the pretest measure is not a measurement of the dependent variable, but rather a covariate, the treatment effect is measured as the difference in the posttest scores between the treatment and control groups as:

Figure 10.4. 2 x 2 factorial design
Factorial designs can also be depicted using a design notation, such as that shown on the right panel of Figure 10.4. R represents random assignment of subjects to treatment groups, X represents the treatment groups themselves (the subscripts of X represents the level of each factor), and O represent observations of the dependent variable. Notice that the 2 x 2 factorial design will have four treatment groups, corresponding to the four combinations of the two levels of each factor. Correspondingly, the 2 x 3 design will have six treatment groups, and the 2 x 2 x 2 design will have eight treatment groups. As a rule of thumb, each cell in a factorial design should have a minimum sample size of 20 (this estimate is derived from Cohen’s power calculations based on medium effect sizes). So a 2 x 2 x 2 factorial design requires a minimum total sample size of 160 subjects, with at least 20 subjects in each cell. As you can see, the cost of data collection can increase substantially with more levels or factors in your factorial design. Sometimes, due to resource constraints, some cells in such factorial designs may not receive any treatment at all, which are called incomplete factorial designs . Such incomplete designs hurt our ability to draw inferences about the incomplete factors.
In a factorial design, a main effect is said to exist if the dependent variable shows a significant difference between multiple levels of one factor, at all levels of other factors. No change in the dependent variable across factor levels is the null case (baseline), from which main effects are evaluated. In the above example, you may see a main effect of instructional type, instructional time, or both on learning outcomes. An interaction effect exists when the effect of differences in one factor depends upon the level of a second factor. In our example, if the effect of instructional type on learning outcomes is greater for 3 hours/week of instructional time than for 1.5 hours/week, then we can say that there is an interaction effect between instructional type and instructional time on learning outcomes. Note that the presence of interaction effects dominate and make main effects irrelevant, and it is not meaningful to interpret main effects if interaction effects are significant.
Hybrid Experimental Designs
Hybrid designs are those that are formed by combining features of more established designs. Three such hybrid designs are randomized bocks design, Solomon four-group design, and switched replications design.
Randomized block design. This is a variation of the posttest-only or pretest-posttest control group design where the subject population can be grouped into relatively homogeneous subgroups (called blocks ) within which the experiment is replicated. For instance, if you want to replicate the same posttest-only design among university students and full -time working professionals (two homogeneous blocks), subjects in both blocks are randomly split between treatment group (receiving the same treatment) or control group (see Figure 10.5). The purpose of this design is to reduce the “noise” or variance in data that may be attributable to differences between the blocks so that the actual effect of interest can be detected more accurately.

Figure 10.5. Randomized blocks design.
Solomon four-group design . In this design, the sample is divided into two treatment groups and two control groups. One treatment group and one control group receive the pretest, and the other two groups do not. This design represents a combination of posttest-only and pretest-posttest control group design, and is intended to test for the potential biasing effect of pretest measurement on posttest measures that tends to occur in pretest-posttest designs but not in posttest only designs. The design notation is shown in Figure 10.6.

Figure 10.6. Solomon four-group design
Switched replication design . This is a two-group design implemented in two phases with three waves of measurement. The treatment group in the first phase serves as the control group in the second phase, and the control group in the first phase becomes the treatment group in the second phase, as illustrated in Figure 10.7. In other words, the original design is repeated or replicated temporally with treatment/control roles switched between the two groups. By the end of the study, all participants will have received the treatment either during the first or the second phase. This design is most feasible in organizational contexts where organizational programs (e.g., employee training) are implemented in a phased manner or are repeated at regular intervals.

Figure 10.7. Switched replication design.
Quasi-Experimental Designs
Quasi-experimental designs are almost identical to true experimental designs, but lacking one key ingredient: random assignment. For instance, one entire class section or one organization is used as the treatment group, while another section of the same class or a different organization in the same industry is used as the control group. This lack of random assignment potentially results in groups that are non-equivalent, such as one group possessing greater mastery of a certain content than the other group, say by virtue of having a better teacher in a previous semester, which introduces the possibility of selection bias . Quasi-experimental designs are therefore inferior to true experimental designs in interval validity due to the presence of a variety of selection related threats such as selection-maturation threat (the treatment and control groups maturing at different rates), selection-history threat (the treatment and control groups being differentially impact by extraneous or historical events), selection-regression threat (the treatment and control groups regressing toward the mean between pretest and posttest at different rates), selection-instrumentation threat (the treatment and control groups responding differently to the measurement), selection-testing (the treatment and control groups responding differently to the pretest), and selection-mortality (the treatment and control groups demonstrating differential dropout rates). Given these selection threats, it is generally preferable to avoid quasi-experimental designs to the greatest extent possible.
Many true experimental designs can be converted to quasi-experimental designs by omitting random assignment. For instance, the quasi-equivalent version of pretest-posttest control group design is called nonequivalent groups design (NEGD), as shown in Figure 10.8, with random assignment R replaced by non-equivalent (non-random) assignment N . Likewise, the quasi -experimental version of switched replication design is called non-equivalent switched replication design (see Figure 10.9).

Figure 10.8. NEGD design.

Figure 10.9. Non-equivalent switched replication design.
In addition, there are quite a few unique non -equivalent designs without corresponding true experimental design cousins. Some of the more useful of these designs are discussed next.
Regression-discontinuity (RD) design . This is a non-equivalent pretest-posttest design where subjects are assigned to treatment or control group based on a cutoff score on a preprogram measure. For instance, patients who are severely ill may be assigned to a treatment group to test the efficacy of a new drug or treatment protocol and those who are mildly ill are assigned to the control group. In another example, students who are lagging behind on standardized test scores may be selected for a remedial curriculum program intended to improve their performance, while those who score high on such tests are not selected from the remedial program. The design notation can be represented as follows, where C represents the cutoff score:

Figure 10.10. RD design.
Because of the use of a cutoff score, it is possible that the observed results may be a function of the cutoff score rather than the treatment, which introduces a new threat to internal validity. However, using the cutoff score also ensures that limited or costly resources are distributed to people who need them the most rather than randomly across a population, while simultaneously allowing a quasi-experimental treatment. The control group scores in the RD design does not serve as a benchmark for comparing treatment group scores, given the systematic non-equivalence between the two groups. Rather, if there is no discontinuity between pretest and posttest scores in the control group, but such a discontinuity persists in the treatment group, then this discontinuity is viewed as evidence of the treatment effect.
Proxy pretest design . This design, shown in Figure 10.11, looks very similar to the standard NEGD (pretest-posttest) design, with one critical difference: the pretest score is collected after the treatment is administered. A typical application of this design is when a researcher is brought in to test the efficacy of a program (e.g., an educational program) after the program has already started and pretest data is not available. Under such circumstances, the best option for the researcher is often to use a different prerecorded measure, such as students’ grade point average before the start of the program, as a proxy for pretest data. A variation of the proxy pretest design is to use subjects’ posttest recollection of pretest data, which may be subject to recall bias, but nevertheless may provide a measure of perceived gain or change in the dependent variable.

Figure 10.11. Proxy pretest design.
Separate pretest-posttest samples design . This design is useful if it is not possible to collect pretest and posttest data from the same subjects for some reason. As shown in Figure 10.12, there are four groups in this design, but two groups come from a single non-equivalent group, while the other two groups come from a different non-equivalent group. For instance, you want to test customer satisfaction with a new online service that is implemented in one city but not in another. In this case, customers in the first city serve as the treatment group and those in the second city constitute the control group. If it is not possible to obtain pretest and posttest measures from the same customers, you can measure customer satisfaction at one point in time, implement the new service program, and measure customer satisfaction (with a different set of customers) after the program is implemented. Customer satisfaction is also measured in the control group at the same times as in the treatment group, but without the new program implementation. The design is not particularly strong, because you cannot examine the changes in any specific customer’s satisfaction score before and after the implementation, but you can only examine average customer satisfaction scores. Despite the lower internal validity, this design may still be a useful way of collecting quasi-experimental data when pretest and posttest data are not available from the same subjects.

Figure 10.12. Separate pretest-posttest samples design.
Nonequivalent dependent variable (NEDV) design . This is a single-group pre-post quasi-experimental design with two outcome measures, where one measure is theoretically expected to be influenced by the treatment and the other measure is not. For instance, if you are designing a new calculus curriculum for high school students, this curriculum is likely to influence students’ posttest calculus scores but not algebra scores. However, the posttest algebra scores may still vary due to extraneous factors such as history or maturation. Hence, the pre-post algebra scores can be used as a control measure, while that of pre-post calculus can be treated as the treatment measure. The design notation, shown in Figure 10.13, indicates the single group by a single N , followed by pretest O 1 and posttest O 2 for calculus and algebra for the same group of students. This design is weak in internal validity, but its advantage lies in not having to use a separate control group.
An interesting variation of the NEDV design is a pattern matching NEDV design , which employs multiple outcome variables and a theory that explains how much each variable will be affected by the treatment. The researcher can then examine if the theoretical prediction is matched in actual observations. This pattern-matching technique, based on the degree of correspondence between theoretical and observed patterns is a powerful way of alleviating internal validity concerns in the original NEDV design.

Figure 10.13. NEDV design.
Perils of Experimental Research
Experimental research is one of the most difficult of research designs, and should not be taken lightly. This type of research is often best with a multitude of methodological problems. First, though experimental research requires theories for framing hypotheses for testing, much of current experimental research is atheoretical. Without theories, the hypotheses being tested tend to be ad hoc, possibly illogical, and meaningless. Second, many of the measurement instruments used in experimental research are not tested for reliability and validity, and are incomparable across studies. Consequently, results generated using such instruments are also incomparable. Third, many experimental research use inappropriate research designs, such as irrelevant dependent variables, no interaction effects, no experimental controls, and non-equivalent stimulus across treatment groups. Findings from such studies tend to lack internal validity and are highly suspect. Fourth, the treatments (tasks) used in experimental research may be diverse, incomparable, and inconsistent across studies and sometimes inappropriate for the subject population. For instance, undergraduate student subjects are often asked to pretend that they are marketing managers and asked to perform a complex budget allocation task in which they have no experience or expertise. The use of such inappropriate tasks, introduces new threats to internal validity (i.e., subject’s performance may be an artifact of the content or difficulty of the task setting), generates findings that are non-interpretable and meaningless, and makes integration of findings across studies impossible.
The design of proper experimental treatments is a very important task in experimental design, because the treatment is the raison d’etre of the experimental method, and must never be rushed or neglected. To design an adequate and appropriate task, researchers should use prevalidated tasks if available, conduct treatment manipulation checks to check for the adequacy of such tasks (by debriefing subjects after performing the assigned task), conduct pilot tests (repeatedly, if necessary), and if doubt, using tasks that are simpler and familiar for the respondent sample than tasks that are complex or unfamiliar.
In summary, this chapter introduced key concepts in the experimental design research method and introduced a variety of true experimental and quasi-experimental designs. Although these designs vary widely in internal validity, designs with less internal validity should not be overlooked and may sometimes be useful under specific circumstances and empirical contingencies.
- Social Science Research: Principles, Methods, and Practices. Authored by : Anol Bhattacherjee. Provided by : University of South Florida. Located at : http://scholarcommons.usf.edu/oa_textbooks/3/ . License : CC BY-NC-SA: Attribution-NonCommercial-ShareAlike

An official website of the United States government
The .gov means it’s official. Federal government websites often end in .gov or .mil. Before sharing sensitive information, make sure you’re on a federal government site.
The site is secure. The https:// ensures that you are connecting to the official website and that any information you provide is encrypted and transmitted securely.
- Publications
- Account settings
Preview improvements coming to the PMC website in October 2024. Learn More or Try it out now .
- Advanced Search
- Journal List
- J Athl Train
- v.45(1); Jan-Feb 2010
Study/Experimental/Research Design: Much More Than Statistics
Kenneth l. knight.
Brigham Young University, Provo, UT
The purpose of study, experimental, or research design in scientific manuscripts has changed significantly over the years. It has evolved from an explanation of the design of the experiment (ie, data gathering or acquisition) to an explanation of the statistical analysis. This practice makes “Methods” sections hard to read and understand.
To clarify the difference between study design and statistical analysis, to show the advantages of a properly written study design on article comprehension, and to encourage authors to correctly describe study designs.
Description:
The role of study design is explored from the introduction of the concept by Fisher through modern-day scientists and the AMA Manual of Style . At one time, when experiments were simpler, the study design and statistical design were identical or very similar. With the complex research that is common today, which often includes manipulating variables to create new variables and the multiple (and different) analyses of a single data set, data collection is very different than statistical design. Thus, both a study design and a statistical design are necessary.
Advantages:
Scientific manuscripts will be much easier to read and comprehend. A proper experimental design serves as a road map to the study methods, helping readers to understand more clearly how the data were obtained and, therefore, assisting them in properly analyzing the results.
Study, experimental, or research design is the backbone of good research. It directs the experiment by orchestrating data collection, defines the statistical analysis of the resultant data, and guides the interpretation of the results. When properly described in the written report of the experiment, it serves as a road map to readers, 1 helping them negotiate the “Methods” section, and, thus, it improves the clarity of communication between authors and readers.
A growing trend is to equate study design with only the statistical analysis of the data. The design statement typically is placed at the end of the “Methods” section as a subsection called “Experimental Design” or as part of a subsection called “Data Analysis.” This placement, however, equates experimental design and statistical analysis, minimizing the effect of experimental design on the planning and reporting of an experiment. This linkage is inappropriate, because some of the elements of the study design that should be described at the beginning of the “Methods” section are instead placed in the “Statistical Analysis” section or, worse, are absent from the manuscript entirely.
Have you ever interrupted your reading of the “Methods” to sketch out the variables in the margins of the paper as you attempt to understand how they all fit together? Or have you jumped back and forth from the early paragraphs of the “Methods” section to the “Statistics” section to try to understand which variables were collected and when? These efforts would be unnecessary if a road map at the beginning of the “Methods” section outlined how the independent variables were related, which dependent variables were measured, and when they were measured. When they were measured is especially important if the variables used in the statistical analysis were a subset of the measured variables or were computed from measured variables (such as change scores).
The purpose of this Communications article is to clarify the purpose and placement of study design elements in an experimental manuscript. Adopting these ideas may improve your science and surely will enhance the communication of that science. These ideas will make experimental manuscripts easier to read and understand and, therefore, will allow them to become part of readers' clinical decision making.
WHAT IS A STUDY (OR EXPERIMENTAL OR RESEARCH) DESIGN?
The terms study design, experimental design, and research design are often thought to be synonymous and are sometimes used interchangeably in a single paper. Avoid doing so. Use the term that is preferred by the style manual of the journal for which you are writing. Study design is the preferred term in the AMA Manual of Style , 2 so I will use it here.
A study design is the architecture of an experimental study 3 and a description of how the study was conducted, 4 including all elements of how the data were obtained. 5 The study design should be the first subsection of the “Methods” section in an experimental manuscript (see the Table ). “Statistical Design” or, preferably, “Statistical Analysis” or “Data Analysis” should be the last subsection of the “Methods” section.
Table. Elements of a “Methods” Section

The “Study Design” subsection describes how the variables and participants interacted. It begins with a general statement of how the study was conducted (eg, crossover trials, parallel, or observational study). 2 The second element, which usually begins with the second sentence, details the number of independent variables or factors, the levels of each variable, and their names. A shorthand way of doing so is with a statement such as “A 2 × 4 × 8 factorial guided data collection.” This tells us that there were 3 independent variables (factors), with 2 levels of the first factor, 4 levels of the second factor, and 8 levels of the third factor. Following is a sentence that names the levels of each factor: for example, “The independent variables were sex (male or female), training program (eg, walking, running, weight lifting, or plyometrics), and time (2, 4, 6, 8, 10, 15, 20, or 30 weeks).” Such an approach clearly outlines for readers how the various procedures fit into the overall structure and, therefore, enhances their understanding of how the data were collected. Thus, the design statement is a road map of the methods.
The dependent (or measurement or outcome) variables are then named. Details of how they were measured are not given at this point in the manuscript but are explained later in the “Instruments” and “Procedures” subsections.
Next is a paragraph detailing who the participants were and how they were selected, placed into groups, and assigned to a particular treatment order, if the experiment was a repeated-measures design. And although not a part of the design per se, a statement about obtaining written informed consent from participants and institutional review board approval is usually included in this subsection.
The nuts and bolts of the “Methods” section follow, including such things as equipment, materials, protocols, etc. These are beyond the scope of this commentary, however, and so will not be discussed.
The last part of the “Methods” section and last part of the “Study Design” section is the “Data Analysis” subsection. It begins with an explanation of any data manipulation, such as how data were combined or how new variables (eg, ratios or differences between collected variables) were calculated. Next, readers are told of the statistical measures used to analyze the data, such as a mixed 2 × 4 × 8 analysis of variance (ANOVA) with 2 between-groups factors (sex and training program) and 1 within-groups factor (time of measurement). Researchers should state and reference the statistical package and procedure(s) within the package used to compute the statistics. (Various statistical packages perform analyses slightly differently, so it is important to know the package and specific procedure used.) This detail allows readers to judge the appropriateness of the statistical measures and the conclusions drawn from the data.
STATISTICAL DESIGN VERSUS STATISTICAL ANALYSIS
Avoid using the term statistical design . Statistical methods are only part of the overall design. The term gives too much emphasis to the statistics, which are important, but only one of many tools used in interpreting data and only part of the study design:
The most important issues in biostatistics are not expressed with statistical procedures. The issues are inherently scientific, rather than purely statistical, and relate to the architectural design of the research, not the numbers with which the data are cited and interpreted. 6
Stated another way, “The justification for the analysis lies not in the data collected but in the manner in which the data were collected.” 3 “Without the solid foundation of a good design, the edifice of statistical analysis is unsafe.” 7 (pp4–5)
The intertwining of study design and statistical analysis may have been caused (unintentionally) by R.A. Fisher, “… a genius who almost single-handedly created the foundations for modern statistical science.” 8 Most research did not involve statistics until Fisher invented the concepts and procedures of ANOVA (in 1921) 9 , 10 and experimental design (in 1935). 11 His books became standard references for scientists in many disciplines. As a result, many ANOVA books were titled Experimental Design (see, for example, Edwards 12 ), and ANOVA courses taught in psychology and education departments included the words experimental design in their course titles.
Before the widespread use of computers to analyze data, designs were much simpler, and often there was little difference between study design and statistical analysis. So combining the 2 elements did not cause serious problems. This is no longer true, however, for 3 reasons: (1) Research studies are becoming more complex, with multiple independent and dependent variables. The procedures sections of these complex studies can be difficult to understand if your only reference point is the statistical analysis and design. (2) Dependent variables are frequently measured at different times. (3) How the data were collected is often not directly correlated with the statistical design.
For example, assume the goal is to determine the strength gain in novice and experienced athletes as a result of 3 strength training programs. Rate of change in strength is not a measurable variable; rather, it is calculated from strength measurements taken at various time intervals during the training. So the study design would be a 2 × 2 × 3 factorial with independent variables of time (pretest or posttest), experience (novice or advanced), and training (isokinetic, isotonic, or isometric) and a dependent variable of strength. The statistical design , however, would be a 2 × 3 factorial with independent variables of experience (novice or advanced) and training (isokinetic, isotonic, or isometric) and a dependent variable of strength gain. Note that data were collected according to a 3-factor design but were analyzed according to a 2-factor design and that the dependent variables were different. So a single design statement, usually a statistical design statement, would not communicate which data were collected or how. Readers would be left to figure out on their own how the data were collected.
MULTIVARIATE RESEARCH AND THE NEED FOR STUDY DESIGNS
With the advent of electronic data gathering and computerized data handling and analysis, research projects have increased in complexity. Many projects involve multiple dependent variables measured at different times, and, therefore, multiple design statements may be needed for both data collection and statistical analysis. Consider, for example, a study of the effects of heat and cold on neural inhibition. The variables of H max and M max are measured 3 times each: before, immediately after, and 30 minutes after a 20-minute treatment with heat or cold. Muscle temperature might be measured each minute before, during, and after the treatment. Although the minute-by-minute data are important for graphing temperature fluctuations during the procedure, only 3 temperatures (time 0, time 20, and time 50) are used for statistical analysis. A single dependent variable H max :M max ratio is computed to illustrate neural inhibition. Again, a single statistical design statement would tell little about how the data were obtained. And in this example, separate design statements would be needed for temperature measurement and H max :M max measurements.
As stated earlier, drawing conclusions from the data depends more on how the data were measured than on how they were analyzed. 3 , 6 , 7 , 13 So a single study design statement (or multiple such statements) at the beginning of the “Methods” section acts as a road map to the study and, thus, increases scientists' and readers' comprehension of how the experiment was conducted (ie, how the data were collected). Appropriate study design statements also increase the accuracy of conclusions drawn from the study.
CONCLUSIONS
The goal of scientific writing, or any writing, for that matter, is to communicate information. Including 2 design statements or subsections in scientific papers—one to explain how the data were collected and another to explain how they were statistically analyzed—will improve the clarity of communication and bring praise from readers. To summarize:
- Purge from your thoughts and vocabulary the idea that experimental design and statistical design are synonymous.
- Study or experimental design plays a much broader role than simply defining and directing the statistical analysis of an experiment.
- A properly written study design serves as a road map to the “Methods” section of an experiment and, therefore, improves communication with the reader.
- Study design should include a description of the type of design used, each factor (and each level) involved in the experiment, and the time at which each measurement was made.
- Clarify when the variables involved in data collection and data analysis are different, such as when data analysis involves only a subset of a collected variable or a resultant variable from the mathematical manipulation of 2 or more collected variables.
Acknowledgments
Thanks to Thomas A. Cappaert, PhD, ATC, CSCS, CSE, for suggesting the link between R.A. Fisher and the melding of the concepts of research design and statistics.
- Skip to main content
- Skip to primary sidebar
- Skip to footer
- QuestionPro

- Solutions Industries Gaming Automotive Sports and events Education Government Travel & Hospitality Financial Services Healthcare Cannabis Technology Use Case NPS+ Communities Audience Contactless surveys Mobile LivePolls Member Experience GDPR Positive People Science 360 Feedback Surveys
- Resources Blog eBooks Survey Templates Case Studies Training Help center
Home Market Research
Experimental Research: What it is + Types of designs

Any research conducted under scientifically acceptable conditions uses experimental methods. The success of experimental studies hinges on researchers confirming the change of a variable is based solely on the manipulation of the constant variable. The research should establish a notable cause and effect.
What is Experimental Research?
Experimental research is a study conducted with a scientific approach using two sets of variables. The first set acts as a constant, which you use to measure the differences of the second set. Quantitative research methods , for example, are experimental.
If you don’t have enough data to support your decisions, you must first determine the facts. This research gathers the data necessary to help you make better decisions.
You can conduct experimental research in the following situations:
- Time is a vital factor in establishing a relationship between cause and effect.
- Invariable behavior between cause and effect.
- You wish to understand the importance of cause and effect.
Experimental Research Design Types
The classic experimental design definition is: “The methods used to collect data in experimental studies.”
There are three primary types of experimental design:
- Pre-experimental research design
- True experimental research design
- Quasi-experimental research design
The way you classify research subjects based on conditions or groups determines the type of research design you should use.
0 1. Pre-Experimental Design
A group, or various groups, are kept under observation after implementing cause and effect factors. You’ll conduct this research to understand whether further investigation is necessary for these particular groups.
You can break down pre-experimental research further into three types:
- One-shot Case Study Research Design
- One-group Pretest-posttest Research Design
- Static-group Comparison
0 2. True Experimental Design
It relies on statistical analysis to prove or disprove a hypothesis, making it the most accurate form of research. Of the types of experimental design, only true design can establish a cause-effect relationship within a group. In a true experiment, three factors need to be satisfied:
- There is a Control Group, which won’t be subject to changes, and an Experimental Group, which will experience the changed variables.
- A variable that can be manipulated by the researcher
- Random distribution
This experimental research method commonly occurs in the physical sciences.
0 3. Quasi-Experimental Design
The word “Quasi” indicates similarity. A quasi-experimental design is similar to an experimental one, but it is not the same. The difference between the two is the assignment of a control group. In this research, an independent variable is manipulated, but the participants of a group are not randomly assigned. Quasi-research is used in field settings where random assignment is either irrelevant or not required.
Importance of Experimental Design
Experimental research is a powerful tool for understanding cause-and-effect relationships. It allows us to manipulate variables and observe the effects, which is crucial for understanding how different factors influence the outcome of a study.
But the importance of experimental research goes beyond that. It’s a critical method for many scientific and academic studies. It allows us to test theories, develop new products, and make groundbreaking discoveries.
For example, this research is essential for developing new drugs and medical treatments. Researchers can understand how a new drug works by manipulating dosage and administration variables and identifying potential side effects.
Similarly, experimental research is used in the field of psychology to test theories and understand human behavior. By manipulating variables such as stimuli, researchers can gain insights into how the brain works and identify new treatment options for mental health disorders.
It is also widely used in the field of education. It allows educators to test new teaching methods and identify what works best. By manipulating variables such as class size, teaching style, and curriculum, researchers can understand how students learn and identify new ways to improve educational outcomes.
In addition, experimental research is a powerful tool for businesses and organizations. By manipulating variables such as marketing strategies, product design, and customer service, companies can understand what works best and identify new opportunities for growth.
Advantages of Experimental Research
When talking about this research, we can think of human life. Babies do their own rudimentary experiments (such as putting objects in their mouths) to learn about the world around them, while older children and teens do experiments at school to learn more about science.
Ancient scientists used this research to prove that their hypotheses were correct. For example, Galileo Galilei and Antoine Lavoisier conducted various experiments to discover key concepts in physics and chemistry. The same is true of modern experts, who use this scientific method to see if new drugs are effective, discover treatments for diseases, and create new electronic devices (among others).
It’s vital to test new ideas or theories. Why put time, effort, and funding into something that may not work?
This research allows you to test your idea in a controlled environment before marketing. It also provides the best method to test your theory thanks to the following advantages:

- Researchers have a stronger hold over variables to obtain desired results.
- The subject or industry does not impact the effectiveness of experimental research. Any industry can implement it for research purposes.
- The results are specific.
- After analyzing the results, you can apply your findings to similar ideas or situations.
- You can identify the cause and effect of a hypothesis. Researchers can further analyze this relationship to determine more in-depth ideas.
- Experimental research makes an ideal starting point. The data you collect is a foundation for building more ideas and conducting more action research .
Whether you want to know how the public will react to a new product or if a certain food increases the chance of disease, experimental research is the best place to start. Begin your research by finding subjects using QuestionPro Audience and other tools today.
LEARN MORE FREE TRIAL
MORE LIKE THIS

Data Information vs Insight: Essential differences
May 14, 2024

Pricing Analytics Software: Optimize Your Pricing Strategy
May 13, 2024

Relationship Marketing: What It Is, Examples & Top 7 Benefits
May 8, 2024

The Best Email Survey Tool to Boost Your Feedback Game
May 7, 2024
Other categories
- Academic Research
- Artificial Intelligence
- Assessments
- Brand Awareness
- Case Studies
- Communities
- Consumer Insights
- Customer effort score
- Customer Engagement
- Customer Experience
- Customer Loyalty
- Customer Research
- Customer Satisfaction
- Employee Benefits
- Employee Engagement
- Employee Retention
- Friday Five
- General Data Protection Regulation
- Insights Hub
- Life@QuestionPro
- Market Research
- Mobile diaries
- Mobile Surveys
- New Features
- Online Communities
- Question Types
- Questionnaire
- QuestionPro Products
- Release Notes
- Research Tools and Apps
- Revenue at Risk
- Survey Templates
- Training Tips
- Uncategorized
- Video Learning Series
- What’s Coming Up
- Workforce Intelligence
Experimental Method In Psychology
Saul Mcleod, PhD
Editor-in-Chief for Simply Psychology
BSc (Hons) Psychology, MRes, PhD, University of Manchester
Saul Mcleod, PhD., is a qualified psychology teacher with over 18 years of experience in further and higher education. He has been published in peer-reviewed journals, including the Journal of Clinical Psychology.
Learn about our Editorial Process
Olivia Guy-Evans, MSc
Associate Editor for Simply Psychology
BSc (Hons) Psychology, MSc Psychology of Education
Olivia Guy-Evans is a writer and associate editor for Simply Psychology. She has previously worked in healthcare and educational sectors.
On This Page:
The experimental method involves the manipulation of variables to establish cause-and-effect relationships. The key features are controlled methods and the random allocation of participants into controlled and experimental groups .
What is an Experiment?
An experiment is an investigation in which a hypothesis is scientifically tested. An independent variable (the cause) is manipulated in an experiment, and the dependent variable (the effect) is measured; any extraneous variables are controlled.
An advantage is that experiments should be objective. The researcher’s views and opinions should not affect a study’s results. This is good as it makes the data more valid and less biased.
There are three types of experiments you need to know:
1. Lab Experiment
A laboratory experiment in psychology is a research method in which the experimenter manipulates one or more independent variables and measures the effects on the dependent variable under controlled conditions.
A laboratory experiment is conducted under highly controlled conditions (not necessarily a laboratory) where accurate measurements are possible.
The researcher uses a standardized procedure to determine where the experiment will take place, at what time, with which participants, and in what circumstances.
Participants are randomly allocated to each independent variable group.
Examples are Milgram’s experiment on obedience and Loftus and Palmer’s car crash study .
- Strength : It is easier to replicate (i.e., copy) a laboratory experiment. This is because a standardized procedure is used.
- Strength : They allow for precise control of extraneous and independent variables. This allows a cause-and-effect relationship to be established.
- Limitation : The artificiality of the setting may produce unnatural behavior that does not reflect real life, i.e., low ecological validity. This means it would not be possible to generalize the findings to a real-life setting.
- Limitation : Demand characteristics or experimenter effects may bias the results and become confounding variables .
2. Field Experiment
A field experiment is a research method in psychology that takes place in a natural, real-world setting. It is similar to a laboratory experiment in that the experimenter manipulates one or more independent variables and measures the effects on the dependent variable.
However, in a field experiment, the participants are unaware they are being studied, and the experimenter has less control over the extraneous variables .
Field experiments are often used to study social phenomena, such as altruism, obedience, and persuasion. They are also used to test the effectiveness of interventions in real-world settings, such as educational programs and public health campaigns.
An example is Holfing’s hospital study on obedience .
- Strength : behavior in a field experiment is more likely to reflect real life because of its natural setting, i.e., higher ecological validity than a lab experiment.
- Strength : Demand characteristics are less likely to affect the results, as participants may not know they are being studied. This occurs when the study is covert.
- Limitation : There is less control over extraneous variables that might bias the results. This makes it difficult for another researcher to replicate the study in exactly the same way.
3. Natural Experiment
A natural experiment in psychology is a research method in which the experimenter observes the effects of a naturally occurring event or situation on the dependent variable without manipulating any variables.
Natural experiments are conducted in the day (i.e., real life) environment of the participants, but here, the experimenter has no control over the independent variable as it occurs naturally in real life.
Natural experiments are often used to study psychological phenomena that would be difficult or unethical to study in a laboratory setting, such as the effects of natural disasters, policy changes, or social movements.
For example, Hodges and Tizard’s attachment research (1989) compared the long-term development of children who have been adopted, fostered, or returned to their mothers with a control group of children who had spent all their lives in their biological families.
Here is a fictional example of a natural experiment in psychology:
Researchers might compare academic achievement rates among students born before and after a major policy change that increased funding for education.
In this case, the independent variable is the timing of the policy change, and the dependent variable is academic achievement. The researchers would not be able to manipulate the independent variable, but they could observe its effects on the dependent variable.
- Strength : behavior in a natural experiment is more likely to reflect real life because of its natural setting, i.e., very high ecological validity.
- Strength : Demand characteristics are less likely to affect the results, as participants may not know they are being studied.
- Strength : It can be used in situations in which it would be ethically unacceptable to manipulate the independent variable, e.g., researching stress .
- Limitation : They may be more expensive and time-consuming than lab experiments.
- Limitation : There is no control over extraneous variables that might bias the results. This makes it difficult for another researcher to replicate the study in exactly the same way.
Key Terminology
Ecological validity.
The degree to which an investigation represents real-life experiences.
Experimenter effects
These are the ways that the experimenter can accidentally influence the participant through their appearance or behavior.
Demand characteristics
The clues in an experiment lead the participants to think they know what the researcher is looking for (e.g., the experimenter’s body language).
Independent variable (IV)
The variable the experimenter manipulates (i.e., changes) is assumed to have a direct effect on the dependent variable.
Dependent variable (DV)
Variable the experimenter measures. This is the outcome (i.e., the result) of a study.
Extraneous variables (EV)
All variables which are not independent variables but could affect the results (DV) of the experiment. EVs should be controlled where possible.
Confounding variables
Variable(s) that have affected the results (DV), apart from the IV. A confounding variable could be an extraneous variable that has not been controlled.
Random Allocation
Randomly allocating participants to independent variable conditions means that all participants should have an equal chance of participating in each condition.
The principle of random allocation is to avoid bias in how the experiment is carried out and limit the effects of participant variables.
Order effects
Changes in participants’ performance due to their repeating the same or similar test more than once. Examples of order effects include:
(i) practice effect: an improvement in performance on a task due to repetition, for example, because of familiarity with the task;
(ii) fatigue effect: a decrease in performance of a task due to repetition, for example, because of boredom or tiredness.
Related Articles

Research Methodology
What Is a Focus Group?

Cross-Cultural Research Methodology In Psychology

What Is Internal Validity In Research?

Research Methodology , Statistics
What Is Face Validity In Research? Importance & How To Measure

Criterion Validity: Definition & Examples

Convergent Validity: Definition and Examples
- Open access
- Published: 18 May 2020
Using natural experiments to improve public health evidence: a review of context and utility for obesity prevention
- Melanie Crane 1 ,
- Erika Bohn-Goldbaum 1 ,
- Anne Grunseit 1 &
- Adrian Bauman 1
Health Research Policy and Systems volume 18 , Article number: 48 ( 2020 ) Cite this article
15k Accesses
38 Citations
30 Altmetric
Metrics details
Natural experiments are increasingly valued as a way to assess the health impact of health and non-health interventions when planned controlled experimental research designs may be infeasible or inappropriate to implement. This study sought to investigate the value of natural experiments by exploring how they have been used in practice. The study focused on obesity prevention research as one complex programme area for applying natural experiment studies.
A literature search sought obesity prevention research from January 1997 to December 2017 and identified 46 population health studies that self-described as a natural experiment.
The majority of studies identified were published in the last 5 years, illustrating a more recent adoption of such opportunities. The majority of studies were evaluations of the impact of policies ( n = 19), such as assessing changes to food labelling, food advertising or taxation on diet and obesity outcomes, or were built environment interventions ( n = 17), such as the impact of built infrastructure on physical activity or access to healthy food. Research designs included quasi-experimental, pre-experimental and non-experimental methods. Few studies applied rigorous research designs to establish stronger causal inference, such as multiple pre/post measures, time series designs or comparison of change against an unexposed group. In general, researchers employed techniques to enhance the study utility but often were limited in the use of more rigorous study designs by ethical considerations and/or the particular context of the intervention.
Greater recognition of the utility and versatility of natural experiments in generating evidence for complex health issues like obesity prevention is needed. This review suggests that natural experiments may be underutilised as an approach for providing evidence of the effects of interventions, particularly for evaluating health outcomes of interventions when unexpected opportunities to gather evidence arise.
Peer Review reports
Many public health issues are complex, requiring preventive health actions targeted at multiple upstream social and environmental determinates to improve population-level outcomes [ 1 ]. Despite this, the published literature is almost entirely focused on short-term individual-level research outcomes and lacking complex, multi-level, population-level intervention evidence [ 2 ]. Obesity is now recognised as a complex health issue, driven by multiple interrelated factors, including environmental, social and cultural determinants beyond individual-level determinants of behaviour [ 3 , 4 , 5 ]. Today, over 700 million adults and children are obese [ 6 ]. Effective population-wide prevention strategies implemented at-scale are needed to combat obesity; individually targeted strategies, such as health education and behavioural skills, have largely been found to be ineffective and unsustainable [ 2 , 7 ]. Recommended prevention strategies focus on environmental interventions and policies to promote healthy eating and physical activity, such as taxation and restrictions on advertising of unhealthy food, interventions to increase healthy food availability, and environmental changes to the built environment [ 8 ]. However, the effectiveness of these interventions or policies remains limited by a lack of evaluation evidence.
Public Health evidence has been somewhat restricted to individualised prevention and treatment interventions from randomised controlled trial (RCT) studies. The key challenges for assessing complex policy and environmental interventions is that RCT studies are rarely appropriate, or even possible, in most situations [ 9 ]. In these complex interventions, the intervention is unlikely to be investigator initiated and the researcher is unlikely to have direct control over the study environment or wider policy influences [ 10 , 11 ]. Other factors related to the complexity of populations and context make it unrealistic to apply controlled study environments such as the long time over which health behaviours change or outcomes are established [ 12 , 13 ]. These issues have led to calls for natural experiment studies to improve the evidence base for public health interventions [ 11 , 14 ].
The Medical Research Council (MRC) in the United Kingdom describes natural experiments as evaluating health or other outcomes where “ exposure to the event of intention of interest has not been manipulated by the researcher ” [ 15 ]. A number of other definitions exists and contributes to widespread confusion that a natural experiment is a type of study design (synonymous with or distinct from a quasi-experiment) rather than what is usually an unplanned ‘opportunity’ for research [ 15 ]. There is also some debate as to whether a natural experiment should refer only to studies which are ‘experimental’, i.e. where variation in the outcomes are analysed using methods that attempt to make causal inference. This position is held by the MRC and would include quasi-experimental studies but would exclude observational study designs as insufficient for determining causality [ 16 ]. Others contest that even weak study designs may be better than no evidence at all [ 17 , 18 ]. Hence, in evaluating the contribution of natural experiment studies to the evidence base, it is important to consider both the strength of their designs and their potential value to the existing evidence base.
The purpose of this paper is two-fold: firstly, given the increasing advocacy for using natural experiments, we sought to investigate how natural experiments have been defined and used in practice. Specifically, we describe and assess the characteristics of natural experiments conducted in the area of obesity prevention to reveal the strengths, gaps, and weaknesses and help inform future research practice. Secondly, we explore the value of natural experiments in evaluating real-world interventions by considering the extent to which a planned experiment might be possible or whether this knowledge could only have been generated by a natural experiment.
Literature search strategy
A literature review was conducted on published peer-reviewed studies that self-described as natural experiments and focused on obesity prevention through improving nutrition or physical activity. The purpose of the review was to explore the use and utility of natural experiments [ 19 ], not to determine the outcome effects of interventions, which has been reported elsewhere [ 20 , 21 ]. A systematic search in Scopus, Web of Science and CINAHL databases identified potential studies by combining two main topics (natural experiment AND population health) with the areas of interest: physical activity, nutrition or obesity (for full search criteria details, see Additional file S 1 ). The search results were then limited by language (English only), article type (original research published/in-press and full-articles only), and dated from 1 January 1997 to 22 December 2017. Articles involving non-human research or not related to obesity prevention or improving nutrition or physical activity were excluded.
Figure 1 depicts the study selection stages. The initial search results were combined ( n = 117 articles) and duplicate studies ( n = 21 articles) were removed. Titles were scanned and 14 additional articles were removed as non-human studies, resulting in 82 articles. Two authors (MC and EG) read the abstracts to confirm that the articles met the eligibility criteria. A further 37 studies were removed as a commentary or opinion piece ( n = 6), a protocol or methods article ( n = 7), a review or meta-analysis ( n = 8), or unrelated to obesity prevention ( n = 12); an additional 4 four studies were removed as they did not self-identify as natural experiments (Additional file S 2 ). The reference lists of the review articles were also searched for natural experiment studies contained within and 1 additional study was identified. The full text of all 46 articles was evaluated to confirm all inclusion criteria were met.

Study selection
Critical review of studies
To investigate use, identified studies were described according to the nature of the intervention (type/setting, theme and scale) and of the evaluation methodology (study design, the exposure, characteristics of the exposed group and inclusion of a control group, and data collection measures and period). We then conducted a qualitative synthesis on the value of the studies to the field (Box 1). This includes consideration of the purpose of the study, and whether it could be answered from a planned, researcher-driven study, following the typologies developed by Dawson and Sim [ 22 ]. We discuss whether a planned controlled experiment (specifically an RCT or cluster RCT) would be realistic, considering practical issues such as time and population constraints, the potential for ethical conflict, and other limitations of RCTs [ 12 , 13 , 23 ].
MC and EG independently assessed each of the included studies and met to identify and resolve any coding and data extraction discrepancies. Where the authors disagreed, the other authors were consulted and a consensus reached.
The literature search resulted in 46 studies directly related to the topic of diet, physical activity and obesity prevention, and are described in Table 1 . Among the natural experiments conducted in this area over the last 20 years, none were published before 2007, 7 were published prior to 2012 (when the MRC guidance was published) and 4 more were published the same year. The largest annual publication volume occurred in 2017 with 14 published studies, at least double the numbers of any previous year (Additional file S 3 ). The studies were predominantly from North America (22 from the United States of America and 6 from Canada). The remaining studies were from Europe ( n = 7), Australia ( n = 8) and South America ( n = 3).
Intervention context
Setting and scale.
The majority of the natural experiments identified were policy interventions [ 27 , 28 , 31 , 32 , 37 , 39 , 42 , 43 , 48 , 51 , 56 , 58 , 59 , 65 , 66 , 71 , 72 ], followed by environmental interventions [ 30 , 34 , 35 , 36 , 38 , 40 , 41 , 47 , 49 , 53 , 55 , 60 , 61 , 62 , 64 , 68 , 69 ] and community-based interventions [ 29 , 44 , 63 , 67 , 70 ]. Fewer studies were of economic interventions [ 33 , 50 , 54 ], individual behaviour interventions [ 52 ] and anthropological studies [ 45 , 46 ] (Table 2 ). In terms of the scale of implementation, the majority of interventions were conducted at the neighbourhood scale. All but two [ 31 , 42 ] of the 19 policy interventions were implemented at a national or state level.
Intervention theme
The natural experiments related to diet assessed exposure to the introduction of, or changes to, food labelling [ 27 , 42 , 48 , 66 ], or food regulation and taxation [ 28 , 31 , 37 ], and access to, or affordability of, healthy food options such as fruit and vegetables [ 39 , 41 , 43 , 57 , 58 , 61 ]. Natural experiments related to physical activity included exposure to workplace physical activity programmes [ 49 ], schools [ 32 , 65 ], park settings [ 29 , 67 ], community-wide programmes [ 30 , 44 , 63 ], and built environment interventions, including infrastructure for active travel and changes in street design [ 30 , 40 , 53 , 62 ], residential/school development [ 34 , 35 , 47 , 55 , 59 , 60 , 68 ] and green spaces [ 36 , 38 , 69 ]. Other experiments were conducted to assess physical activity outcomes associated with disruption to transport services [ 64 ], daylight saving [ 72 ] and social habitat [ 70 ]. Obesity-related outcomes more broadly were evaluated in relation to exposure to clinical procedures [ 52 , 56 ], migration [ 45 , 46 ], education [ 51 ] or economic events [ 33 , 50 , 54 , 71 ].
Evaluation characteristics
Study design.
A variety of study designs were used, with several quasi-experiments, comparing longitudinal pre/post intervention changes in exposure of a cohort against a control or comparison group [ 28 , 31 , 34 , 36 , 40 , 42 , 47 , 48 , 52 , 61 , 63 , 67 , 69 , 72 ]. The remaining cohort studies were observational (non-experimental), comparing pre/post exposure without a control group [ 35 , 44 , 57 , 64 , 68 , 71 ]. Four studies conducted interrupted time-series on sales data [ 27 , 37 , 43 , 66 ], two without a control comparator (observational only) [ 43 , 66 ]. Observational studies included repeat cross-sectional surveys [ 30 , 33 , 38 , 43 , 49 , 50 , 51 , 56 , 62 ], some of which incorporated mixed methods (qualitative interviews or geospatial mapping) [ 38 , 43 , 48 , 56 ], or used a cross-sectional single time point only [ 29 , 32 , 39 , 41 , 45 , 55 , 58 , 59 , 60 , 65 , 70 ]. One study pooled repeat cross-sectional data as a result of data availability and was therefore unable to assess time-related effects [ 32 ]; another [ 46 ] was a feasibility study anticipating a larger, longitudinal investigation. Two studies were qualitative only [ 53 , 54 ].
Data source
Natural experiment studies used a variety of sources. In total, four studies collected both primary and secondary data [ 43 , 48 , 53 , 64 ] and 27 studies only collected primary data. Fifteen studies used secondary routinely collected surveillance data from national or state censes and health surveys [ 31 , 32 , 33 , 51 , 56 , 71 , 72 ], hospital administrative data [ 50 , 52 ], pre-existing cohort studies [ 39 , 70 ] and food supply [ 28 ] or sales data [ 27 , 37 , 43 , 66 ]. Three studies used simulated data to establish a hypothetical unexposed group [ 27 , 28 , 44 ].
Exposure samples comprised residential populations in a defined neighbourhood or region, consumers of food outlets (e.g. supermarkets or restaurant chain) or physical activity space (e.g. park-setting). A clearly defined unexposed ‘control’ group was used by 15 studies [ 28 , 31 , 34 , 35 , 36 , 40 , 42 , 46 , 47 , 48 , 52 , 61 , 63 , 67 , 69 , 72 ]. More often, exposure was assessed in the one population group or area without a defined unexposed group ( n = 18) [ 27 , 30 , 33 , 38 , 43 , 44 , 47 , 49 , 50 , 51 , 52 , 56 , 57 , 62 , 64 , 68 , 70 , 71 ] or comparisons made between two groups, one of which was exposed, at a single time point ( n = 10) [ 29 , 32 , 39 , 41 , 45 , 55 , 58 , 59 , 60 , 65 ].
Not all studies used a dichotomous definition of exposure. Graded levels of exposure between groups, areas or individuals over time were used in a small number of studies [ 33 , 43 , 51 , 71 ]. These studies had no similar intervention characteristics that might suggest a pattern or typology of where and when graded exposure may be necessary.
Evaluation measures
A variety of evaluation measures were used to evaluate obesity prevention interventions, including subjective and objective measures of physical activity (walking, active travel, metabolic equivalents), diet and body mass index, and health behaviour from surveys, physical and manual counters (i.e. accelerometers), as well as secondary data sources listed above. One study used geospatial information systems to identify exposed and unexposed groups [ 35 ].
Evaluation methods varied across similar interventions. For example, two studies [ 36 , 38 ] evaluated the impact of new outdoor gym equipment on physical activity. Only one compared changes in the exposed group (park users/residents) against users of parks without gym equipment. Three studies used different methods to assess sales data to determine the effectiveness of food labelling policies in supermarkets. One of these compared data across three supermarket chains, with one chain acting as the control [ 55 ], one compared variation in exposure across a variety of supermarket types [ 66 ], and the third study simulated exposure because the labelling policy in question was voluntary and haphazardly implemented [ 27 ]. These differences suggest a variety of evaluation measures are applied to natural experiment opportunities.
Evaluation timeframe
Of the studies that included pre and post data collection, studies conducted over a short (less than 3 year) evaluation period, such as community or environmental interventions, predominantly used original sourced data from surveys or observational measures. Studies with a longer evaluation period relied on secondary data collection as could be expected given the time constraints on primary data collection.
The value of natural experiments for providing real-world population evaluation evidence was appraised in terms of whether the studies could have been conducted as planned researcher-driven experiments. We determined the purpose of the study and found that the majority evaluated the effectiveness of an intervention or impact of a policy (see Additional file 4 Table S2 for full list). In terms of utility, we first found that planned researcher-driven research was not always feasible to answer the research questions raised by the authors and, as such, were opportunities that could only ever be investigated as natural experiments. For example, Jones-Smith et al. [ 50 ] sought to establish whether Native American economic resources (from casino ownership) influenced the likelihood of childhood obesity; Zick et al. [ 72 ] aimed to assess whether daylight saving time is associated with increased time spent in moderate-to-vigorous physical activity. The purpose of these studies was to examine social or environmental determinants or inequalities in the population, which would not be amenable to/appropriate for researcher manipulation. In some instances, we recognised it would be possible for a researcher to have some involvement in the decisions regarding when and where an intervention occurs in order to obtain baseline data; for example, evaluation of the impact of a new policy taxation [ 27 , 37 ]. However, if a policy was enacted quickly, baseline data collection would be restricted. Some of the studies involved relocation, such as those for new housing developments in Australia [ 34 , 35 , 47 , 68 ], where researcher control over the planning, timing or conditions of the relocation, even if working with the authorities, would likely be unrealistic.
We note that studies aimed at assessing inequalities in the population or determining intervention effectiveness would be unethical as a planned experiment where there was risk of potential harm from intentionally restricting access to medical care [ 52 ], economic support [ 50 ], educational opportunity [ 51 ] or randomising individuals/groups to social benefits [ 33 , 57 , 71 ], freedom to migrate [ 45 , 46 ] or health services [ 57 , 65 ].
In other cases, researcher manipulation of study components may have been possible, but the researcher would have been constrained by practical considerations such as time, population sample size or location of exposure [ 61 ]. As obesity takes time to develop and tends to reverse, some evaluation questions necessitate a long lag time between exposure and outcome, which negate short-time planning. In one study, historical data was used to investigate the effect of academic schooling on obesity-related health behaviours in adults [ 51 ]. A planned study of this nature would be unrealistic, involving long follow-up from schooling to adult years to establish causality; it would also be unethical to control exposure to schooling. Bernatchez et al. [ 30 ] evaluates awareness of a new bicycle share programme rather than use; this may be because evaluation occurred too early to measure behaviour change as measured in another similar study [ 40 ]. In other cases, a planned experiment would be unpractical because the nature of the intervention necessitates a whole-of-population approach, such as the effect of tariffs applied to certain energy dense foods on unhealthy food consumption [ 28 ]. The point of time at which a researcher engages may preclude pre-intervention data collection. For example, in one study, researchers could only collect retrospective survey data on commute mode from parents whose children transferred to a new school [ 55 ]; other researchers serendipitously had a public transit strike occur in the midst of measuring spatial behaviour among undergraduate students, allowing a spontaneous pre/post examination on changes to student travel patterns to university [ 64 ]. In some situations, a natural experiment may be the only realistic option available despite the absence of a control group because the intervention is so unique that a suitable control group is not feasible. For example, in the study by Cranney et al. [ 38 ], the park setting in which equipment was installed may have had unique features specific to its local environment, precluding a suitable control. Similarly, in the study by Barradas et al. [ 29 ], some parks were already receiving the intervention programme and intervention settings were pre-determined by another body.
This study has characterised the use and value of natural experiments, particularly focusing on the area of obesity prevention and its complex aetiology. Although the number of studies self-described as natural experiments has increased over the past two decades, the body of research, at least in obesity prevention, remains small.
Obesity prevention is a complex issue. Research evidence about interventions implemented in real-world conditions and the impact of policies represent a key gap in the knowledge. Thus, there is a need for greater generation of evidence about the impact and effectiveness of policy strategies, and natural experiments could be better utilised to provide this evidence. In assessing how natural experiment studies have been used, we found that the majority of the studies reviewed were designed to evaluate the impact of a policy or the effectiveness of an environmental intervention. The policy evaluation studies were almost all at the national or state level. Geographically, the studies in this review were located in English-speaking countries, which may reflect the high prevalence rates of obesity in these countries, and the search methods precluded studies in non-English speaking countries; however, it may also be due to the low use of evaluation approaches across other countries and within research groups within these countries. For this reason, WHO Europe recently held a workshop to support and facilitate public health practitioners from participating European countries in the use of natural experiment methods [ 14 ].
Strengths and weaknesses of natural experiments
The strengths of natural experiments are in their ability to evaluate the process and outcomes of implementation of policies and interventions within the real-world complex social and political conditions they naturally operate in. The response to the obesity epidemic has required a broad range of policy, environmental and individual behaviour change interventions – necessarily complex interventions able to function within a complex socio-political system [ 2 , 23 ]. Evaluation research designs need to be flexible and able to measure the interaction between multiple factors [ 73 ].
Natural experiments offer opportunistic evidence where a researcher-driven study may be impossible for reasons of intervention timing or exposure. Nevertheless, the ability to make causal inferences from natural experiments depends on optimising the research study design [ 74 ]. We identified a variety of designs, including interrupted time-series, cross-sectional and longitudinal cohort designs. Few of these studies were experimental/quasi-experimental, including both pre and post measures for an exposed and a comparator group. However, a surprising number of the studies used a single data collection point to evaluate an intervention and thus could not attribute any observed changes to exposure to the intervention. However, some used mixed methods designs to strengthen study findings. Two studies presented only baseline data (pre-experimental) [ 41 , 60 ] and may have further intentions for collecting follow-up data; these may be premeditated natural experiments. This evidence represents a weakness in study design for evaluating natural experiment studies rather than a weakness of natural experiments in general, and something the MRC has tried to address through detailed guidance on measurement and statistical methodologies [ 26 ].
Another strength of natural experiments is their flexibility. Evaluation periods ranged from a single time point to spanning decades and unsurprisingly the evaluation period determined whether primary or secondary data was used to assess exposure. A variety of outcome measures was used and these sometimes varied across similar interventions. While this flexibility is an advantage of the method, it increases the difficulty for comparisons in evidence reviews [ 21 ]. Most studies adapted the research design to fit the existing intervention context. Harnessing resources before policy interventions is a research planning challenge posed by natural experiments. To overcome this, some studies strengthened their findings by the use of multiple data sources. In such situations, both primary and secondary data contribute to the evidence, and largely depend on the level of control the researcher has on the intervention occurring, the group exposed or the timeframe in which the intervention or event occurs.
A further strength of natural experiments is their delivery of scale, allowing for exploration of a wider range of research questions to be investigated at the population level, to enable generalisation [ 15 ]. Natural experiments operate under circumstances where randomisation is not possible, there are ethical considerations, identifying suitable controls may problematic, and timing (both researcher timing relative to the intervention and the time length of the intervention) may make the collection of ideal data infeasible. These natural experiments fill a void not otherwise met by traditional designs, and may yield insights into exposure–outcome relationships, which are nonetheless informative for obesity prevention.
Natural experiments are often criticised for their inability to eliminate bias. Benton et al. [ 75 ] assessed the risk of bias across a number of natural experiments using an acceptability score based on confounding, participant selection, exposure and outcome measures, and missing data, concluding that evidence on the effects of these interventions was too problematic to be useful. Bias, particularly due to confounding, is a concern for natural experiments [ 18 ]. We observed that few studies in this review had a defined control and exposed group – given that these studies are unplanned evaluations, a clearly defined control group may be challenging to establish. Within the studies reviewed, a clearly defined unexposed group was more likely in environmental interventions where the researcher could establish a study design with original data. In contrast, establishing a clearly defined unexposed group becomes more difficult when evaluating policy interventions, as these are generally implemented acutely, and at the population level. Modelling simulations to create control groups was one approach employed [ 27 , 44 ] to circumnavigate the lack of control group comparator. Others employed a step-wedge design [ 63 ] or time-series data to help overcome some limitations of not having a suitable control comparator condition. Simulations may be especially useful when counterfactuals are difficult to establish or create [ 26 ]. Leatherdale [ 18 ] provides some other suggestions for facilitating greater evaluation evidence of health policies, suggesting the need to improve the ability to evaluate government policy. For this to happen, capacity needs to be built around practitioners either to conduct natural experiments or to work closely with academics so that more robust quasi-experimental methods of evaluation can be employed [ 76 ].
Despite these weaknesses, we caution against devaluing natural experiments based on a simple hierarchy of evidence. Applying the same standards of study design quality to natural experiments ignores the contribution they can make to overall evidence generation [ 17 ], particularly in regard to the complexity of real-world interventions and policy evidence. In response to the complexity of the obesity epidemic, obtaining policy and intervention impact evidence is critical. Indeed, natural experiments may provide innovative research translation evidence that has been lacking on obesity policy interventions [ 77 , 78 ]. Therefore, despite the limitations of natural experiments, they provide valuable information on public health efforts to prevent obesity as, otherwise, any effects might remain unknown.
The limitations of this review include our search criteria for identifying studies. It is possible that the confusion around natural experiments and quasi-experiments limits the number of collected studies to those we have discussed. For example, some protocol papers extracted from the initial search identified as a natural experiment, yet subsequent articles by the authors of these papers did not self-identify their intervention as a natural experiment. This suggests that those studies that want to identify as this type of research are not meeting an agreed definition. The synthesis of the utility of studies was limited to the information provided in each article; political, socio-cultural and practical obstacles that affect natural experiments and limit the potential for planned interventions is thus speculative.
This review examined natural experiments in an effort to improve the public health evidence for obesity prevention where a controlled experimental design would be inappropriate. Research using natural experiments has increased over the last few years; however, it remains overlooked in the context of the wider research evidence despite the importance of these interventions taking place in real-world settings. Our findings highlight the strength of natural experiments in improving our understanding of the effectiveness of complex population interventions and providing informed evidence of the impact of policies and novel approaches to understanding health determinants and inequalities. The studies reviewed also reveal that there is need to strengthen research designs to enhance their utility.
Box 1 Determining the utility of a natural experiment
1. Is there a need to generate population health research evidence about this issue? [ 24 , 25 ]
Does it provide evidence on the impact or effectiveness of a policy or environmental intervention, address health inequalities in the population or how to change behaviour?
2. Is a planned researcher-controlled study possible? [ 22 ]
a. No control – no ability to control where the intervention occurs, whom it affects or when it starts or finishes
b. Partial control – ability to influence exposure timing or location (i.e. able to arrange with the relevant authorities to obtain comparative baseline data)
3. Is a planned researcher-controlled study ethical? [ 22 , 26 ]
a. Creating the conditions for an experiment to determine this issue would be unethical (e.g. where it may create more harm)
b. Random assignment to the intervention would be unethical (e.g. withholding the only known cure for a disease)
4. Is a planned researcher-controlled study practical? [ 12 , 13 , 25 ]
c. Sufficient population available for randomisation: total number of planned exposed/unexposed clusters required would be unrealistic to achieve
d. Time for follow-up: unlikely for a researcher-driven study could accommodate the prolonged periods necessary for outcomes to establish across entire populations
e. Representativeness of the population: threat to applicability of a study if the population sample is too different from the population it was intended to represent
f. Relative costs: sufficient sample and time lag before health impacts evolve would be costly to implement
g. Programme complexity: the intervention is so complex that a controlled study environment would be infeasible
h. Intervention scale-up: an intervention is known to be efficacious/effective but requires demonstration of its effectiveness on a scale unlikely in a researcher-driven context
i. Real-world conditions: purpose is to document contextual factors constituting ‘real-world’ implementation conditions - experimental approach is antithetical to this purpose
Availability of data and materials
Data generated or analysed during this study are included in this published article and its additional files. Please contact the corresponding author for any additional queries.
Abbreviations
Medical Research Council
Randomised controlled trial
Crane M, Bauman A, Lloyd B, McGill B, Rissel C, Grunseit A. Applying pragmatic approaches to complex program evaluation: A case study of implementation of the New South Wales Get Healthy at Work program. Health Prom J Austrl. 2019;30(3):422..
Article Google Scholar
Rutter H, Savona N, Glonti K, Bibby J, Cummins S, Finegood DT, et al. The need for a complex systems model of evidence for public health. Lancet. 2017;390(10112):2602–4.
Article PubMed Google Scholar
Butland BJS, Kopelman P, McPherson K, Thomas S, Mardell J, Parry V. Tackling Obesities: Future Choices. Project Report. 2nd edition: Government Office for Science. London: Department of Innovation, Universities and Skills; 2007.
Roberto CA, Swinburn B, Hawkes C, Huang TTK, Costa SA, Ashe M, et al. Patchy progress on obesity prevention: emerging examples, entrenched barriers, and new thinking. Lancet. 2015;385(9985):2400–9.
Swinburn BA, Sacks G, Hall KD, McPherson K, Finegood DT, Moodie ML, et al. The global obesity pandemic: shaped by global drivers and local environments. Lancet. 2011;378(9793):804–14.
GBD 2015 Obesity Collaborators. Health Effects of Overweight and Obesity in 195 Countries over 25 Years. New Engl J Med. 2017;377(1):13–27.
Huang TT-K, Glass TA. Transforming research strategies for understanding and preventing obesity. JAMA. 2008;300(15):1811–3.
Article CAS PubMed Google Scholar
Gortmaker SL, Swinburn BA, Levy D, Carter R, Mabry PL, Finegood DT, et al. Changing the future of obesity: Science, policy, and action. Lancet. 2011;378(9793):838–47.
Article PubMed PubMed Central Google Scholar
Bauman AE, King L, Nutbeam D. Rethinking the evaluation and measurement of health in all policies. Health Promot Int. 2014;29:i143–i51.
McKinnon RA, Orleans CT, Kumanyika SK, Haire-Joshu D, Krebs-Smith SM, Finkelstein EA, et al. Considerations for an obesity policy research agenda. Am J Prev Med. 2009;36(4):351–7.
Sallis JF, Story M, Lou D. Study designs and analytic strategies for environmental and policy research on obesity, physical activity, and diet. Recommendations from a meeting of experts. Am J Prev Med. 2009;36(2 Suppl):S72–S7.
Sanson-Fisher RW, Bonevski B, Green LW, D’Este C. Limitations of the randomized controlled trial in evaluating population-based health interventions. Am J Prev Med. 2007;33(2):155–61.
Victora CG, Habicht J-P, Bryce J. Evidence-based public health: moving beyond randomized trials. Am J Public Health. 2004;94(3):400–5.
Snell A, Reeves A, Rieger M, Galea G, Mauer-Stender K, Mikkelsen B, et al. WHO Regional Office for Europe's Natural Experiment Studies Project: an introduction to the series. Eur J Pub Health. 2018;28(2):1–3.
Craig P, Cooper C, Gunnell D, Haw S, Lawson K, Macintyre S, et al. Using natural experiments to evaluate population health interventions: new medical research council guidance. J Epidemiol Commun Health. 2012;66(12):1182–6.
Petticrew M, Roberts H. Evidence, hierarchies, and typologies: Horses for courses. J Epidemiol Commun Health. 2003;57(7):527–9.
Article CAS Google Scholar
Humphreys DK, Panter J, Sahlqvist S, Goodman A, Ogilvie D. Changing the environment to improve population health: A framework for considering exposure in natural experimental studies. J Epidemiol Commun Health. 2016;70(9):941–6.
Leatherdale S. Natural experiment methodology for research: a review of how different methods can support real-world research. Int J Soc Res Methodol. 2019;2(22):19–35.
Gough D, Thomas J, Oliver S. Clarifying differences between review designs and methods. Syst Rev. 2012;1:28.
Kärmeniemi M, Lankila T, Ikäheimo T, Koivumaa-Honkanen H, Korpelainen R. The built environment as a determinant of physical activity: a systematic review of longitudinal studies and natural experiments. Ann Behav Med. 2018;52(3):239–51.
Macmillan F, George ES, Feng X, Merom D, Bennie A, Cook A, et al. Do natural experiments of changes in neighborhood built environment impact physical activity and diet? A systematic review. Int J Environ Res Public Health. 2018;15(2):217.
Article PubMed Central Google Scholar
Dawson A, Sim J. The nature and ethics of natural experiments. J Med Ethics. 2015;41(10):848–53.
Ogilvie D, Cummins S, Petticrew M, White M, Jones A, Wheeler K. Assessing the evaluability of complex public health interventions: five questions for researchers, funders, and policymakers. Milbank Q. 2011;89(2):206–25.
Ogilvie D, Adams J, Bauman A, Gregg E, Panter J, Siegel K, et al. Using natural experimental studies to guide public health action: turning the evidence-based medicine paradigm on its head. J Epidemiol Commun Health. 2020;74:203–8.
Petticrew M, Cummins S, Ferrell C, Findlay A, Higgins C, Hoy C, et al. Natural experiments: an underused tool for public health? Public Health. 2005;119(9):751–7.
Craig P, Katikireddi SV, Leyland A, Popham F. Natural experiments: an overview of methods, approaches, and contributions to public health intervention research. Ann Rev Public Health. 2017;38:39–56.
Allais O, Etilé F, Lecocq S. Mandatory labels, taxes and market forces: an empirical evaluation of fat policies. J Health Econ. 2015;43:27–44.
Barlow P, McKee M, Basu S, Stuckler D. Impact of the North American free trade agreement on high-fructose corn syrup supply in Canada: a natural experiment using synthetic control methods. CMAJ. 2017;189(26):E881–E7.
Barradas SC, Finck Barboza C, Sarmiento OL. Differences between leisure-time physical activity, health-related quality of life and life satisfaction: Al Ritmo de las Comunidades, a natural experiment from Colombia. Global Health Promot. 2019;26:5–14.
Bernatchez AC, Gauvin L, Fuller D, Dube AS, Drouin L. Knowing about a public bicycle share program in Montreal, Canada: Are diffusion of innovation and proximity enough for equitable awareness? J Transp Health. 2015;2(3):360–8.
Brandt EJ, Myerson R, Perraillon MC, Polonsky TS. Hospital Admissions for Myocardial Infarction and Stroke Before and After the Trans-Fatty Acid Restrictions in New York. JAMA Cardiol. 2017;2(6):627–34.
Cawley J, Meyerhoefer C, Newhouse D. The impact of state physical education requirements on youth physical activity and overweight. Health Econ. 2007;16(12):1287–301.
Cawley J, Moran J, Simon K. The impact of income on the weight of elderly Americans. Health Econ. 2010;19(8):979–93.
Christian H, Knuiman M, Bull F, Timperio A, Foster S, Divitini M, et al. A new urban planning code's impact on walking: The Residential Environments Project. Am J Public Health. 2013;103(7):1219–28.
Christian H, Knuiman M, Divitini M, Foster S, Hooper P, Boruff B, et al. A longitudinal analysis of the influence of the neighborhood environment on recreational walking within the neighborhood: Results from RESIDE. Environ Health Perspect. 2017;125(7):077009.
Cohen DA, Marsh T, Williamson S, Golinelli D, McKenzie TL, Cohen DA, et al. Impact and cost-effectiveness of family Fitness Zones: a natural experiment in urban public parks. Health Place. 2012;18(1):39–45.
Cornelsen L, Mytton OT, Adams J, Gasparrini A, Iskander D, Knai C, et al. Change in non-alcoholic beverage sales following a 10-pence levy on sugar-sweetened beverages within a national chain of restaurants in the UK: interrupted time series analysis of a natural experiment. J Epidemiol Commun Health. 2017;71(11):1107–12.
Google Scholar
Cranney L, Phongsavan P, Kariuki M, Stride V, Scott A, Hua M, et al. Impact of an outdoor gym on park users' physical activity: A natural experiment. Health Place. 2016;37:26–34.
Datar A, Nicosia N. The effect of state competitive food and beverage regulations on childhood overweight and obesity. J Adolesc Health. 2017;60(5):520–7.
Dill J, McNeil N, Broach J, Ma L. Bicycle boulevards and changes in physical activity and active transportation: findings from a natural experiment. Prev Med. 2014;69:S74–8.
Dubowitz T, Ncube C, Leuschner K, Tharp-Gilliam S. A natural experiment opportunity in two low-income urban food desert communities: research design, community engagement methods, and baseline results. Health Educ Behav. 2015;42:87–96.
Elbel B, Gyamfi J, Kersh R. Child and adolescent fast-food choice and the influence of calorie labeling: a natural experiment. Int J Obes. 2011;35(4):493–500.
Ferguson M, O'Dea K, Holden S, Miles E, Brimblecombe J. Food and beverage price discounts to improve health in remote Aboriginal communities: mixed method evaluation of a natural experiment. Aust N Z J Public Health. 2017;41(1):32–7.
Frew EJ, Bhatti M, Win K, Sitch A, Lyon A, Pallan M, et al. Cost-effectiveness of a community-based physical activity programme for adults (Be Active) in the UK: an economic analysis within a natural experiment. Br J Sports Med. 2014;48(3):207–12.
Fu H, VanLandingham M. Disentangling the effects of migration, selection and acculturation on weight and body fat distribution: results from a natural experiment involving vietnamese americans, returnees, and never-leavers. J Immigr Minority Health. 2012;14(5):786–96.
Gee GC, de Castro AB, Wang MC, Crespi CM, Morey BN, Kaori F. Feasibility of conducting a longitudinal, transnational study of Filipino migrants to the United States: a dual-cohort design. J Health Care Poor Underserved. 2015;26(2):488–504.
Giles-Corti B, Bull F, Knuiman M, McCormack G, Van Niel K, Timperio A, et al. The influence of urban design on neighbourhood walking following residential relocation: longitudinal results from the RESIDE study. Soc Sci Med. 2013;77:20–30.
Hobin E, Bollinger B, Sacco J, Liebman E, Vanderlee L, Zuo F, et al. Consumers' response to an on-shelf nutrition labelling system in supermarkets: evidence to inform policy and practice. Milbank Q. 2017;95(3):494–534.
Jancey JM, McGann S, Creagh R, Blackford KD, Howat P, Tye M. Workplace building design and office-based workers' activity: a study of a natural experiment. Austr N Z J Public Health. 2016;40(1):78–82.
Jones-Smith JC, Dow WH, Oddo VM. Association between Native American-owned casinos and the prevalence of large-for-gestational- age births. Int J Epidemiol. 2017;46(4):1202–10.
Jürges H, Reinhold S, Salm M. Does schooling affect health behavior? Evidence from the educational expansion in Western Germany. Econ Educ Rev. 2011;30(5):862–72.
Kapinos KA, Yakusheva O, Weiss M. Cesarean deliveries and maternal weight retention. BMC Pregnancy Childbirth. 2017;17:343.
Kesten JM, Cohn S, Ogilvie D, et al. BMC Public Health. 2014;14:482.
Kodish SR, Gittelsohn J, Oddo VM, Jones-Smith JC. Impacts of casinos on key pathways to health: qualitative findings from American Indian gaming communities in California. BMC Public Health. 2016;16:621.
Lee C, Yoon J, Zhu X. From sedentary to active school commute: multi-level factors associated with travel mode shifts. Prev Med. 2017;95:S28–36.
Madsen KA. School-based body mass index screening and parent notification: a statewide natural experiment. Arch Pediatr Adolesc Med. 2011;165(11):987–92.
Odoms-Young AM, Kong A, Schiffer LA, Porter SJ, Blumstein L, Bess S, et al. Evaluating the initial impact of the revised Special Supplemental Nutrition Program for Women, Infants, and Children (WIC) food packages on dietary intake and home food availability in African-American and Hispanic families. Public Health Nutr. 2014;17(1):83–93.
Ovrum A, Bere E, Øvrum A. Evaluating free school fruit: results from a natural experiment in Norway with representative data. Public Health Nutr. 2014;17(6):1224–31.
Pollack CE, Green HD Jr, Kennedy DP, Griffin BA, Kennedy-Hendricks A, Burkhauser S, et al. The Impact of public housing on social networks: a natural experiment. Am J Public Health. 2014;104(9):1642–9.
Ram B, Nightingale CM, Hudda MT, Kapetanakis VV, Ellaway A, Cooper AR, et al. Cohort profile: Examining Neighbourhood Activities in Built Living Environments in London: the ENABLE London – Olympic Park cohort. BMJ Open. 2016;6(10):e012643.
Sadler RC, Gillil JA, Arku G. A food retail-based intervention on food security and consumption. Int J Environ Res Public Health. 2013;10(8):3325–46.
Schultz CL, Wilhelm Stanis SA, Sayers SP, Thombs LA, Thomas IM. A longitudinal examination of improved access on park use and physical activity in a low-income and majority African American neighborhood park. Prev Med. 2017;95:S95–S100.
Simões EJ, Hallal PC, Siqueira FV, Schmaltz C, Menor D, Malta DC, et al. Effectiveness of a scaled up physical activity intervention in Brazil: a natural experiment. Prev Med. 2017;103:S66–72.
Stanley K, Bell S, Kreuger LK, Bhowmik P, Shojaati N, Elliott A, et al. Opportunistic natural experiments using digital telemetry: a transit disruption case study. Int J Geogr Inf Sci. 2016;30(9):1853–72.
Stone MR, Faulkner GE, Zeglen-Hunt L, Bonne JC. The Daily Physical Activity (DPA) policy in Ontario: is it working? an examination using accelerometry-measured physical activity data. Can J Public Health. 2012;103(3):170–4.
Sutherland LA, Kaley LA, Fischer L. Guiding Stars: the effect of a nutrition navigation program on consumer purchases at the supermarket. Am J Clin Nutr. 2010;91(4):1090S–4S.
Torres A, Díaz MP, Hayat MJ, Lyn R, Pratt M, Salvo D, et al. Assessing the effect of physical activity classes in public spaces on leisure-time physical activity: “Al Ritmo de las Comunidades” A natural experiment in Bogota, Colombia. Prev Med. 2017;103:S51–S8.
Tudor-Locke C, Giles-Corti B, Knuiman M, McCormack G. Tracking of pedometer-determined physical activity in adults who relocate: results from RESIDE. Int J Behav Nutr Phys Act. 2008;5:39.
Veitch J, Ball K, Crawford D, Abbott GR, Salmon J. Park improvements and park activity: a natural experiment. Am J Prev Med. 2012;42(6):616–9.
Wagner B, Jiang L, Hexuan L, Guang G. Gene–environment correlation: difficulties and a natural experiment-based strategy. Am J Public Health. 2013;103(S1):S167–73.
Watson B, Osberg L, Phipps S. Economic insecurity and the weight gain of Canadian adults: a natural experiment approach. Can Public Policy. 2016;42(2):115–31.
Zick CD. Does daylight savings time encourage physical activity? J Phys Act Health. 2014;11(5):1057–60.
Moore GF, Evans RE, Hawkins J, Littlecott H, Melendez-Torres GJ, Bonell C, et al. From complex social interventions to interventions in complex social systems: Future directions and unresolved questions for intervention development and evaluation. Evaluation. 2019;25(1):23–45.
Medical Research Council (MRC). Using Natural Experiments to Evaluate Population Health Interventions: Guidance for Producers and Users of Evidence. London: Medical Research Council; 2011.
Benton J, Anderson J, Hunter R, French D. The effect of changing the built envoionment on physical activity: a quantitative review of the risk of bias in natural experiments. Int J Behav Nutr Phys Act. 2016;13(1):107.
Green J, Roberts H, Petticrew M, Steinbach R, Goodman A, Jones A, et al. Integrating quasi-experimental and inductive designs in evaluation: a case study of the impact of free bus travel on public health. Evaluation. 2015;21(4):391–406.
Oliver K, Lorenc T, Innvær S. New directions in evidence-based policy research: a critical analysis of the literature. Health Res Policy Syst. 2014;12:34.
Brownson RC, Chriqui JF, Stamatakis KA. Understanding evidence-based public health policy. Am J Public Health. 2009;99(9):1576–83.
Download references
Acknowledgments
Not applicable.
The work was funded by the National Health and Medical Research Council of Australia (NHMRC) through its Partnership Centre grant scheme [grant number GNT9100001]. NSW Health, ACT Health, the Australian Government Department of Health, the Hospitals Contribution Fund of Australia and the HCF Research Foundation have contributed funds to support this work as part of the NHMRC Partnership Centre grant scheme. The contents of this paper are solely the responsibility of the individual authors and do not reflect the views of the NHMRC or funding partners.
Author information
Authors and affiliations.
The Australian Prevention Partnership Centre, Sydney School of Public Health, Charles Perkins Centre, The University of Sydney, Camperdown, NSW, Australia
Melanie Crane, Erika Bohn-Goldbaum, Anne Grunseit & Adrian Bauman
You can also search for this author in PubMed Google Scholar
Contributions
AB and MC conceived the study. MC led the design, analysis and manuscript writing. EG conducted the literature search and contributed to analysis and manuscript writing. AG contributed to the design and manuscript writing and provided critical feedback. AB contributed to the design and provided critical feedback on the manuscript. All authors read and approved the final manuscript.
Corresponding author
Correspondence to Melanie Crane .
Ethics declarations
Ethics approval and consent to participate, consent for publication, competing interests.
The authors declare they have no competing interests.
Additional information
Publisher’s note.
Springer Nature remains neutral with regard to jurisdictional claims in published maps and institutional affiliations.
Supplementary information
Additional file 1: table s1..
Search strategy.
Additional file 2: Table S2.
Describes studies excluded through abstract review.
Additional file 3: Figure S1.
Showing the use of natural experiment studies surrounding nutrition and physical activity interventions on obesity.
Additional file 4: Table S3.
Describes the research aims of included studies.
Rights and permissions
Open Access This article is licensed under a Creative Commons Attribution 4.0 International License, which permits use, sharing, adaptation, distribution and reproduction in any medium or format, as long as you give appropriate credit to the original author(s) and the source, provide a link to the Creative Commons licence, and indicate if changes were made. The images or other third party material in this article are included in the article's Creative Commons licence, unless indicated otherwise in a credit line to the material. If material is not included in the article's Creative Commons licence and your intended use is not permitted by statutory regulation or exceeds the permitted use, you will need to obtain permission directly from the copyright holder. To view a copy of this licence, visit http://creativecommons.org/licenses/by/4.0/ . The Creative Commons Public Domain Dedication waiver ( http://creativecommons.org/publicdomain/zero/1.0/ ) applies to the data made available in this article, unless otherwise stated in a credit line to the data.
Reprints and permissions
About this article
Cite this article.
Crane, M., Bohn-Goldbaum, E., Grunseit, A. et al. Using natural experiments to improve public health evidence: a review of context and utility for obesity prevention. Health Res Policy Sys 18 , 48 (2020). https://doi.org/10.1186/s12961-020-00564-2
Download citation
Received : 18 September 2019
Accepted : 13 April 2020
Published : 18 May 2020
DOI : https://doi.org/10.1186/s12961-020-00564-2
Share this article
Anyone you share the following link with will be able to read this content:
Sorry, a shareable link is not currently available for this article.
Provided by the Springer Nature SharedIt content-sharing initiative
- Natural experiments
- obesity prevention
- evaluation methods
- study design
- physical activity
- population health interventions
- narrative review
Health Research Policy and Systems
ISSN: 1478-4505
- Submission enquiries: Access here and click Contact Us
- General enquiries: [email protected]
Experimental Research: Definition, Types, Design, Examples
Appinio Research · 14.05.2024 · 30min read

Experimental research is a cornerstone of scientific inquiry, providing a systematic approach to understanding cause-and-effect relationships and advancing knowledge in various fields. At its core, experimental research involves manipulating variables, observing outcomes, and drawing conclusions based on empirical evidence. By controlling factors that could influence the outcome, researchers can isolate the effects of specific variables and make reliable inferences about their impact. This guide offers a step-by-step exploration of experimental research, covering key elements such as research design, data collection, analysis, and ethical considerations. Whether you're a novice researcher seeking to understand the basics or an experienced scientist looking to refine your experimental techniques, this guide will equip you with the knowledge and tools needed to conduct rigorous and insightful research.
What is Experimental Research?
Experimental research is a systematic approach to scientific inquiry that aims to investigate cause-and-effect relationships by manipulating independent variables and observing their effects on dependent variables. Experimental research primarily aims to test hypotheses, make predictions, and draw conclusions based on empirical evidence.
By controlling extraneous variables and randomizing participant assignment, researchers can isolate the effects of specific variables and establish causal relationships. Experimental research is characterized by its rigorous methodology, emphasis on objectivity, and reliance on empirical data to support conclusions.
Importance of Experimental Research
- Establishing Cause-and-Effect Relationships : Experimental research allows researchers to establish causal relationships between variables by systematically manipulating independent variables and observing their effects on dependent variables. This provides valuable insights into the underlying mechanisms driving phenomena and informs theory development.
- Testing Hypotheses and Making Predictions : Experimental research provides a structured framework for testing hypotheses and predicting the relationship between variables. By systematically manipulating variables and controlling for confounding factors, researchers can empirically test the validity of their hypotheses and refine theoretical models.
- Informing Evidence-Based Practice : Experimental research generates empirical evidence that informs evidence-based practice in various fields, including healthcare, education, and business. Experimental research contributes to improving outcomes and informing decision-making in real-world settings by identifying effective interventions, treatments, and strategies.
- Driving Innovation and Advancement : Experimental research drives innovation and advancement by uncovering new insights, challenging existing assumptions, and pushing the boundaries of knowledge. Through rigorous experimentation and empirical validation, researchers can develop novel solutions to complex problems and contribute to the advancement of science and technology.
- Enhancing Research Rigor and Validity : Experimental research upholds high research rigor and validity standards by employing systematic methods, controlling for confounding variables, and ensuring replicability of findings. By adhering to rigorous methodology and ethical principles, experimental research produces reliable and credible evidence that withstands scrutiny and contributes to the cumulative body of knowledge.
Experimental research plays a pivotal role in advancing scientific understanding, informing evidence-based practice, and driving innovation across various disciplines. By systematically testing hypotheses, establishing causal relationships, and generating empirical evidence, experimental research contributes to the collective pursuit of knowledge and the improvement of society.
Understanding Experimental Design
Experimental design serves as the blueprint for your study, outlining how you'll manipulate variables and control factors to draw valid conclusions.
Experimental Design Components
Experimental design comprises several essential elements:
- Independent Variable (IV) : This is the variable manipulated by the researcher. It's what you change to observe its effect on the dependent variable. For example, in a study testing the impact of different study techniques on exam scores, the independent variable might be the study method (e.g., flashcards, reading, or practice quizzes).
- Dependent Variable (DV) : The dependent variable is what you measure to assess the effect of the independent variable. It's the outcome variable affected by the manipulation of the independent variable. In our study example, the dependent variable would be the exam scores.
- Control Variables : These factors could influence the outcome but are kept constant or controlled to isolate the effect of the independent variable. Controlling variables helps ensure that any observed changes in the dependent variable can be attributed to manipulating the independent variable rather than other factors.
- Experimental Group : This group receives the treatment or intervention being tested. It's exposed to the manipulated independent variable. In contrast, the control group does not receive the treatment and serves as a baseline for comparison.
Types of Experimental Designs
Experimental designs can vary based on the research question, the nature of the variables, and the desired level of control. Here are some common types:
- Between-Subjects Design : In this design, different groups of participants are exposed to varying levels of the independent variable. Each group represents a different experimental condition, and participants are only exposed to one condition. For instance, in a study comparing the effectiveness of two teaching methods, one group of students would use Method A, while another would use Method B.
- Within-Subjects Design : Also known as repeated measures design, this approach involves exposing the same group of participants to all levels of the independent variable. Participants serve as their own controls, and the order of conditions is typically counterbalanced to control for order effects. For example, participants might be tested on their reaction times under different lighting conditions, with the order of conditions randomized to eliminate any research bias .
- Mixed Designs : Mixed designs combine elements of both between-subjects and within-subjects designs. This allows researchers to examine both between-group differences and within-group changes over time. Mixed designs help study complex phenomena that involve multiple variables and temporal dynamics.
Factors Influencing Experimental Design Choices
Several factors influence the selection of an appropriate experimental design:
- Research Question : The nature of your research question will guide your choice of experimental design. Some questions may be better suited to between-subjects designs, while others may require a within-subjects approach.
- Variables : Consider the number and type of variables involved in your study. A factorial design might be appropriate if you're interested in exploring multiple factors simultaneously. Conversely, if you're focused on investigating the effects of a single variable, a simpler design may suffice.
- Practical Considerations : Practical constraints such as time, resources, and access to participants can impact your choice of experimental design. Depending on your study's specific requirements, some designs may be more feasible or cost-effective than others .
- Ethical Considerations : Ethical concerns, such as the potential risks to participants or the need to minimize harm, should also inform your experimental design choices. Ensure that your design adheres to ethical guidelines and safeguards the rights and well-being of participants.
By carefully considering these factors and selecting an appropriate experimental design, you can ensure that your study is well-designed and capable of yielding meaningful insights.
Experimental Research Elements
When conducting experimental research, understanding the key elements is crucial for designing and executing a robust study. Let's explore each of these elements in detail to ensure your experiment is well-planned and executed effectively.
Independent and Dependent Variables
In experimental research, the independent variable (IV) is the factor that the researcher manipulates or controls, while the dependent variable (DV) is the measured outcome or response. The independent variable is what you change in the experiment to observe its effect on the dependent variable.
For example, in a study investigating the effect of different fertilizers on plant growth, the type of fertilizer used would be the independent variable, while the plant growth (height, number of leaves, etc.) would be the dependent variable.
Control Groups and Experimental Groups
Control groups and experimental groups are essential components of experimental design. The control group serves as a baseline for comparison and does not receive the treatment or intervention being studied. Its purpose is to provide a reference point to assess the effects of the independent variable.
In contrast, the experimental group receives the treatment or intervention and is used to measure the impact of the independent variable. For example, in a drug trial, the control group would receive a placebo, while the experimental group would receive the actual medication.
Randomization and Random Sampling
Randomization is the process of randomly assigning participants to different experimental conditions to minimize biases and ensure that each participant has an equal chance of being assigned to any condition. Randomization helps control for extraneous variables and increases the study's internal validity .
Random sampling, on the other hand, involves selecting a representative sample from the population of interest to generalize the findings to the broader population. Random sampling ensures that each member of the population has an equal chance of being included in the sample, reducing the risk of sampling bias .
Replication and Reliability
Replication involves repeating the experiment to confirm the results and assess the reliability of the findings. It is essential for ensuring the validity of scientific findings and building confidence in the robustness of the results. A study that can be replicated consistently across different settings and by various researchers is considered more reliable. Researchers should strive to design experiments that are easily replicable and transparently report their methods to facilitate replication by others.
Validity: Internal, External, Construct, and Statistical Conclusion Validity
Validity refers to the degree to which an experiment measures what it intends to measure and the extent to which the results can be generalized to other populations or contexts. There are several types of validity that researchers should consider:
- Internal Validity : Internal validity refers to the extent to which the study accurately assesses the causal relationship between variables. Internal validity is threatened by factors such as confounding variables, selection bias, and experimenter effects. Researchers can enhance internal validity through careful experimental design and control procedures.
- External Validity : External validity refers to the extent to which the study's findings can be generalized to other populations or settings. External validity is influenced by factors such as the representativeness of the sample and the ecological validity of the experimental conditions. Researchers should consider the relevance and applicability of their findings to real-world situations.
- Construct Validity : Construct validity refers to the degree to which the study accurately measures the theoretical constructs of interest. Construct validity is concerned with whether the operational definitions of the variables align with the underlying theoretical concepts. Researchers can establish construct validity through careful measurement selection and validation procedures.
- Statistical Conclusion Validity : Statistical conclusion validity refers to the accuracy of the statistical analyses and conclusions drawn from the data. It ensures that the statistical tests used are appropriate for the data and that the conclusions drawn are warranted. Researchers should use robust statistical methods and report effect sizes and confidence intervals to enhance statistical conclusion validity.
By addressing these elements of experimental research and ensuring the validity and reliability of your study, you can conduct research that contributes meaningfully to the advancement of knowledge in your field.
How to Conduct Experimental Research?
Embarking on an experimental research journey involves a series of well-defined phases, each crucial for the success of your study. Let's explore the pre-experimental, experimental, and post-experimental phases to ensure you're equipped to conduct rigorous and insightful research.
Pre-Experimental Phase
The pre-experimental phase lays the foundation for your study, setting the stage for what's to come. Here's what you need to do:
- Formulating Research Questions and Hypotheses : Start by clearly defining your research questions and formulating testable hypotheses. Your research questions should be specific, relevant, and aligned with your research objectives. Hypotheses provide a framework for testing the relationships between variables and making predictions about the outcomes of your study.
- Reviewing Literature and Establishing Theoretical Framework : Dive into existing literature relevant to your research topic and establish a solid theoretical framework. Literature review helps you understand the current state of knowledge, identify research gaps, and build upon existing theories. A well-defined theoretical framework provides a conceptual basis for your study and guides your research design and analysis.
Experimental Phase
The experimental phase is where the magic happens – it's time to put your hypotheses to the test and gather data. Here's what you need to consider:
- Participant Recruitment and Sampling Techniques : Carefully recruit participants for your study using appropriate sampling techniques. The sample should be representative of the population you're studying to ensure the generalizability of your findings. Consider factors such as sample size, demographics, and inclusion criteria when recruiting participants.
- Implementing Experimental Procedures : Once you've recruited participants, it's time to implement your experimental procedures. Clearly outline the experimental protocol, including instructions for participants, procedures for administering treatments or interventions, and measures for controlling extraneous variables. Standardize your procedures to ensure consistency across participants and minimize sources of bias.
- Data Collection and Measurement : Collect data using reliable and valid measurement instruments. Depending on your research questions and variables of interest, data collection methods may include surveys, observations, physiological measurements, or experimental tasks. Ensure that your data collection procedures are ethical, respectful of participants' rights, and designed to minimize errors and biases.
Post-Experimental Phase
In the post-experimental phase, you make sense of your data, draw conclusions, and communicate your findings to the world . Here's what you need to do:
- Data Analysis Techniques : Analyze your data using appropriate statistical techniques. Choose methods that are aligned with your research design and hypotheses. Standard statistical analyses include descriptive statistics, inferential statistics (e.g., t-tests, ANOVA), regression analysis , and correlation analysis. Interpret your findings in the context of your research questions and theoretical framework.
- Interpreting Results and Drawing Conclusions : Once you've analyzed your data, interpret the results and draw conclusions. Discuss the implications of your findings, including any theoretical, practical, or real-world implications. Consider alternative explanations and limitations of your study and propose avenues for future research. Be transparent about the strengths and weaknesses of your study to enhance the credibility of your conclusions.
- Reporting Findings : Finally, communicate your findings through research reports, academic papers, or presentations. Follow standard formatting guidelines and adhere to ethical standards for research reporting. Clearly articulate your research objectives, methods, results, and conclusions. Consider your target audience and choose appropriate channels for disseminating your findings to maximize impact and reach.
By meticulously planning and executing each experimental research phase, you can generate valuable insights, advance knowledge in your field, and contribute to scientific progress.
A s you navigate the intricate phases of experimental research, leveraging Appinio can streamline your journey toward actionable insights. With our intuitive platform, you can swiftly gather real-time consumer data, empowering you to make informed decisions with confidence. Say goodbye to the complexities of traditional market research and hello to a seamless, efficient process that puts you in the driver's seat of your research endeavors.
Ready to revolutionize your approach to data-driven decision-making? Book a demo today and discover the power of Appinio in transforming your research experience!
Book a Demo
Experimental Research Examples
Understanding how experimental research is applied in various contexts can provide valuable insights into its practical significance and effectiveness. Here are some examples illustrating the application of experimental research in different domains:
Market Research
Experimental studies are crucial in market research in testing hypotheses, evaluating marketing strategies, and understanding consumer behavior. For example, a company may conduct an experiment to determine the most effective advertising message for a new product. Participants could be exposed to different versions of an advertisement, each emphasizing different product features or appeals.
By measuring variables such as brand recall, purchase intent, and brand perception, researchers can assess the impact of each advertising message and identify the most persuasive approach.
Software as a Service (SaaS)
In the SaaS industry, experimental research is often used to optimize user interfaces, features, and pricing models to enhance user experience and drive engagement. For instance, a SaaS company may conduct A/B tests to compare two versions of its software interface, each with a different layout or navigation structure.
Researchers can identify design elements that lead to higher user satisfaction and retention by tracking user interactions, conversion rates, and customer feedback. Experimental research also enables SaaS companies to test new product features or pricing strategies before full-scale implementation, minimizing risks and maximizing return on investment.
Business Management
Experimental research is increasingly utilized in business management to inform decision-making, improve organizational processes, and drive innovation. For example, a business may conduct an experiment to evaluate the effectiveness of a new training program on employee productivity. Participants could be randomly assigned to either receive the training or serve as a control group.
By measuring performance metrics such as sales revenue, customer satisfaction, and employee turnover, researchers can assess the training program's impact and determine its return on investment. Experimental research in business management provides empirical evidence to support strategic initiatives and optimize resource allocation.
In healthcare, experimental research is instrumental in testing new treatments, interventions, and healthcare delivery models to improve patient outcomes and quality of care. For instance, a clinical trial may be conducted to evaluate the efficacy of a new drug in treating a specific medical condition. Participants are randomly assigned to either receive the experimental drug or a placebo, and their health outcomes are monitored over time.
By comparing the effectiveness of the treatment and placebo groups, researchers can determine the drug's efficacy, safety profile, and potential side effects. Experimental research in healthcare informs evidence-based practice and drives advancements in medical science and patient care.
These examples illustrate the versatility and applicability of experimental research across diverse domains, demonstrating its value in generating actionable insights, informing decision-making, and driving innovation. Whether in market research or healthcare, experimental research provides a rigorous and systematic approach to testing hypotheses, evaluating interventions, and advancing knowledge.
Experimental Research Challenges
Even with careful planning and execution, experimental research can present various challenges. Understanding these challenges and implementing effective solutions is crucial for ensuring the validity and reliability of your study. Here are some common challenges and strategies for addressing them.
Sample Size and Statistical Power
Challenge : Inadequate sample size can limit your study's generalizability and statistical power, making it difficult to detect meaningful effects. Small sample sizes increase the risk of Type II errors (false negatives) and reduce the reliability of your findings.
Solution : Increase your sample size to improve statistical power and enhance the robustness of your results. Conduct a power analysis before starting your study to determine the minimum sample size required to detect the effects of interest with sufficient power. Consider factors such as effect size, alpha level, and desired power when calculating sample size requirements. Additionally, consider using techniques such as bootstrapping or resampling to augment small sample sizes and improve the stability of your estimates.
To enhance the reliability of your experimental research findings, you can leverage our Sample Size Calculator . By determining the optimal sample size based on your desired margin of error, confidence level, and standard deviation, you can ensure the representativeness of your survey results. Don't let inadequate sample sizes hinder the validity of your study and unlock the power of precise research planning!
Confounding Variables and Bias
Challenge : Confounding variables are extraneous factors that co-vary with the independent variable and can distort the relationship between the independent and dependent variables. Confounding variables threaten the internal validity of your study and can lead to erroneous conclusions.
Solution : Implement control measures to minimize the influence of confounding variables on your results. Random assignment of participants to experimental conditions helps distribute confounding variables evenly across groups, reducing their impact on the dependent variable. Additionally, consider using matching or blocking techniques to ensure that groups are comparable on relevant variables. Conduct sensitivity analyses to assess the robustness of your findings to potential confounders and explore alternative explanations for your results.
Researcher Effects and Experimenter Bias
Challenge : Researcher effects and experimenter bias occur when the experimenter's expectations or actions inadvertently influence the study's outcomes. This bias can manifest through subtle cues, unintentional behaviors, or unconscious biases, leading to invalid conclusions.
Solution : Implement double-blind procedures whenever possible to mitigate researcher effects and experimenter bias. Double-blind designs conceal information about the experimental conditions from both the participants and the experimenters, minimizing the potential for bias. Standardize experimental procedures and instructions to ensure consistency across conditions and minimize experimenter variability. Additionally, consider using objective outcome measures or automated data collection procedures to reduce the influence of experimenter bias on subjective assessments.
External Validity and Generalizability
Challenge : External validity refers to the extent to which your study's findings can be generalized to other populations, settings, or conditions. Limited external validity restricts the applicability of your results and may hinder their relevance to real-world contexts.
Solution : Enhance external validity by designing studies closely resembling real-world conditions and populations of interest. Consider using diverse samples that represent the target population's demographic, cultural, and ecological variability. Conduct replication studies in different contexts or with different populations to assess the robustness and generalizability of your findings. Additionally, consider conducting meta-analyses or systematic reviews to synthesize evidence from multiple studies and enhance the external validity of your conclusions.
By proactively addressing these challenges and implementing effective solutions, you can strengthen the validity, reliability, and impact of your experimental research. Remember to remain vigilant for potential pitfalls throughout the research process and adapt your strategies as needed to ensure the integrity of your findings.
Advanced Topics in Experimental Research
As you delve deeper into experimental research, you'll encounter advanced topics and methodologies that offer greater complexity and nuance.
Quasi-Experimental Designs
Quasi-experimental designs resemble true experiments but lack random assignment to experimental conditions. They are often used when random assignment is impractical, unethical, or impossible. Quasi-experimental designs allow researchers to investigate cause-and-effect relationships in real-world settings where strict experimental control is challenging. Common examples include:
- Non-Equivalent Groups Design : This design compares two or more groups that were not created through random assignment. While similar to between-subjects designs, non-equivalent group designs lack the random assignment of participants, increasing the risk of confounding variables.
- Interrupted Time Series Design : In this design, multiple measurements are taken over time before and after an intervention is introduced. Changes in the dependent variable are assessed over time, allowing researchers to infer the impact of the intervention.
- Regression Discontinuity Design : This design involves assigning participants to different groups based on a cutoff score on a continuous variable. Participants just above and below the cutoff are treated as if they were randomly assigned to different conditions, allowing researchers to estimate causal effects.
Quasi-experimental designs offer valuable insights into real-world phenomena but require careful consideration of potential confounding variables and limitations inherent to non-random assignment.
Factorial Designs
Factorial designs involve manipulating two or more independent variables simultaneously to examine their main effects and interactions. By systematically varying multiple factors, factorial designs allow researchers to explore complex relationships between variables and identify how they interact to influence outcomes. Common types of factorial designs include:
- 2x2 Factorial Design : This design manipulates two independent variables, each with two levels. It allows researchers to examine the main effects of each variable as well as any interaction between them.
- Mixed Factorial Design : In this design, one independent variable is manipulated between subjects, while another is manipulated within subjects. Mixed factorial designs enable researchers to investigate both between-subjects and within-subjects effects simultaneously.
Factorial designs provide a comprehensive understanding of how multiple factors contribute to outcomes and offer greater statistical efficiency compared to studying variables in isolation.
Longitudinal and Cross-Sectional Studies
Longitudinal studies involve collecting data from the same participants over an extended period, allowing researchers to observe changes and trajectories over time. Cross-sectional studies , on the other hand, involve collecting data from different participants at a single point in time, providing a snapshot of the population at that moment. Both longitudinal and cross-sectional studies offer unique advantages and challenges:
- Longitudinal Studies : Longitudinal designs allow researchers to examine developmental processes, track changes over time, and identify causal relationships. However, longitudinal studies require long-term commitment, are susceptible to attrition and dropout, and may be subject to practice effects and cohort effects.
- Cross-Sectional Studies : Cross-sectional designs are relatively quick and cost-effective, provide a snapshot of population characteristics, and allow for comparisons across different groups. However, cross-sectional studies cannot assess changes over time or establish causal relationships between variables.
Researchers should carefully consider the research question, objectives, and constraints when choosing between longitudinal and cross-sectional designs.
Meta-Analysis and Systematic Reviews
Meta-analysis and systematic reviews are quantitative methods used to synthesize findings from multiple studies and draw robust conclusions. These methods offer several advantages:
- Meta-Analysis : Meta-analysis combines the results of multiple studies using statistical techniques to estimate overall effect sizes and assess the consistency of findings across studies. Meta-analysis increases statistical power, enhances generalizability, and provides more precise estimates of effect sizes.
- Systematic Reviews : Systematic reviews involve systematically searching, appraising, and synthesizing existing literature on a specific topic. Systematic reviews provide a comprehensive summary of the evidence, identify gaps and inconsistencies in the literature, and inform future research directions.
Meta-analysis and systematic reviews are valuable tools for evidence-based practice, guiding policy decisions, and advancing scientific knowledge by aggregating and synthesizing empirical evidence from diverse sources.
By exploring these advanced topics in experimental research, you can expand your methodological toolkit, tackle more complex research questions, and contribute to deeper insights and understanding in your field.
Experimental Research Ethical Considerations
When conducting experimental research, it's imperative to uphold ethical standards and prioritize the well-being and rights of participants. Here are some key ethical considerations to keep in mind throughout the research process:
- Informed Consent : Obtain informed consent from participants before they participate in your study. Ensure that participants understand the purpose of the study, the procedures involved, any potential risks or benefits, and their right to withdraw from the study at any time without penalty.
- Protection of Participants' Rights : Respect participants' autonomy, privacy, and confidentiality throughout the research process. Safeguard sensitive information and ensure that participants' identities are protected. Be transparent about how their data will be used and stored.
- Minimizing Harm and Risks : Take steps to mitigate any potential physical or psychological harm to participants. Conduct a risk assessment before starting your study and implement appropriate measures to reduce risks. Provide support services and resources for participants who may experience distress or adverse effects as a result of their participation.
- Confidentiality and Data Security : Protect participants' privacy and ensure the security of their data. Use encryption and secure storage methods to prevent unauthorized access to sensitive information. Anonymize data whenever possible to minimize the risk of data breaches or privacy violations.
- Avoiding Deception : Minimize the use of deception in your research and ensure that any deception is justified by the scientific objectives of the study. If deception is necessary, debrief participants fully at the end of the study and provide them with an opportunity to withdraw their data if they wish.
- Respecting Diversity and Cultural Sensitivity : Be mindful of participants' diverse backgrounds, cultural norms, and values. Avoid imposing your own cultural biases on participants and ensure that your research is conducted in a culturally sensitive manner. Seek input from diverse stakeholders to ensure your research is inclusive and respectful.
- Compliance with Ethical Guidelines : Familiarize yourself with relevant ethical guidelines and regulations governing research with human participants, such as those outlined by institutional review boards (IRBs) or ethics committees. Ensure that your research adheres to these guidelines and that any potential ethical concerns are addressed appropriately.
- Transparency and Openness : Be transparent about your research methods, procedures, and findings. Clearly communicate the purpose of your study, any potential risks or limitations, and how participants' data will be used. Share your research findings openly and responsibly, contributing to the collective body of knowledge in your field.
By prioritizing ethical considerations in your experimental research, you demonstrate integrity, respect, and responsibility as a researcher, fostering trust and credibility in the scientific community.
Experimental research is a powerful tool for uncovering causal relationships and expanding our understanding of the world around us. By carefully designing experiments, collecting data, and analyzing results, researchers can make meaningful contributions to their fields and address pressing questions. However, conducting experimental research comes with responsibilities. Ethical considerations are paramount to ensure the well-being and rights of participants, as well as the integrity of the research process. Researchers can build trust and credibility in their work by upholding ethical standards and prioritizing participant safety and autonomy. Furthermore, as you continue to explore and innovate in experimental research, you must remain open to new ideas and methodologies. Embracing diversity in perspectives and approaches fosters creativity and innovation, leading to breakthrough discoveries and scientific advancements. By promoting collaboration and sharing findings openly, we can collectively push the boundaries of knowledge and tackle some of society's most pressing challenges.
How to Conduct Research in Minutes?
Discover the power of Appinio , the real-time market research platform revolutionizing experimental research. With Appinio, you can access real-time consumer insights to make better data-driven decisions in minutes. Join the thousands of companies worldwide who trust Appinio to deliver fast, reliable consumer insights.
Here's why you should consider using Appinio for your research needs:
- From questions to insights in minutes: With Appinio, you can conduct your own market research and get actionable insights in record time, allowing you to make fast, informed decisions for your business.
- Intuitive platform for anyone: You don't need a PhD in research to use Appinio. Our platform is designed to be user-friendly and intuitive so that anyone can easily create and launch surveys.
- Extensive reach and targeting options: Define your target audience from over 1200 characteristics and survey them in over 90 countries. Our platform ensures you reach the right people for your research needs, no matter where they are.

Get free access to the platform!
Join the loop 💌
Be the first to hear about new updates, product news, and data insights. We'll send it all straight to your inbox.
Get the latest market research news straight to your inbox! 💌
Wait, there's more
14.05.2024 | 30min read

07.05.2024 | 29min read
Interval Scale: Definition, Characteristics, Examples

03.05.2024 | 29min read
What is Qualitative Observation? Definition, Types, Examples
Click through the PLOS taxonomy to find articles in your field.
For more information about PLOS Subject Areas, click here .
Loading metrics
Open Access
Peer-reviewed
Research Article
Managerial (dis)preferences towards employees working from home: Post-pandemic experimental evidence
Roles Conceptualization, Formal analysis, Funding acquisition, Investigation, Methodology, Visualization, Writing – original draft
* E-mail: [email protected]
Affiliation Faculty of Economic Sciences, University of Warsaw, Warsaw, Poland
Roles Conceptualization, Formal analysis, Funding acquisition, Investigation, Methodology, Supervision, Writing – review & editing
- Agnieszka Kasperska,
- Anna Matysiak,
- Ewa Cukrowska-Torzewska
- Published: May 15, 2024
- https://doi.org/10.1371/journal.pone.0303307
- Reader Comments
Work from home (WFH) has been a part of the professional landscape for over two decades, yet it was the COVID-19 pandemic that has substantially increased its prevalence. The impact of WFH on careers is rather ambiguous, and a question remains open about how this effect is manifested in the current times considering the recent extensive and widespread use of WFH during the pandemic. To answer these questions, this article investigates whether managerial preferences for promotion, salary increase and training allowance depend on employee engagement in WFH. We take into account the employee’s gender, parental status as well as the frequency of WFH. Furthermore, we examine whether managers’ experience with WFH and its prevalence in the team moderate the effect of WFH on careers. An online survey experiment was run on a sample of over 1,000 managers from the United Kingdom. The experiment was conducted between July and December 2022. The findings indicate that employees who WFH are less likely to be considered for promotion, salary increase and training than on-site workers. The pay and promotion penalties for WFH are particularly true for men (both fathers and non-fathers) and childless women, but not mothers. We also find that employees operating in teams with a higher prevalence of WFH do not experience negative career effects when working from home. Additionally, the more WFH experience the manager has, the lesser the career penalty for engaging in this mode of working. Our study not only provides evidence on WFH and career outcomes in the post-pandemic context but also furthers previous understanding of how WFH impacts careers by showing its effect across different groups of employees, highlighting the importance of familiarisation and social acceptance of flexible working arrangements in their impact on career outcomes.
Citation: Kasperska A, Matysiak A, Cukrowska-Torzewska E (2024) Managerial (dis)preferences towards employees working from home: Post-pandemic experimental evidence. PLoS ONE 19(5): e0303307. https://doi.org/10.1371/journal.pone.0303307
Editor: Brij Bhooshan Gupta, Asia University, TAIWAN
Received: July 18, 2023; Accepted: April 23, 2024; Published: May 15, 2024
Copyright: © 2024 Kasperska et al. This is an open access article distributed under the terms of the Creative Commons Attribution License , which permits unrestricted use, distribution, and reproduction in any medium, provided the original author and source are credited.
Data Availability: All relevant data are within the manuscript and its Supporting Information files.
Funding: This research was possible thanks to the funding from the NAWA Polish Returns Programme 2019 and IDUB 'Excellence Initiative – Research University (2020-2026)' at the University of Warsaw, grant number BOB-IDUB-622-63/2021. The funders had no role in study design, data collection and analysis, the decision to publish, or preparation of the manuscript.
Competing interests: The authors have declared that no competing interests exist.
Introduction
The incidence of work from home (WFH), broadly defined as conducting work from one’s home rather than the employer’s premises, has been steadily increasing over the last two decades thanks to the development of information communication technologies (ICTs) [ 1 ]. The need for social isolation during the COVID-19 pandemic meant that WFH became a central element of professional life for many employees, and its prevalence has sharply increased. In 2019, just before the pandemic, the share of employees who WFH (‘usually’ or ‘sometimes’) in Europe was 11% [ 2 ]. This number doubled when the pandemic started and approximately one in four European workers worked from home during that time. In the UK, where this study is situated, WFH was even more widespread and its prevalence exceeded 40% at the peak of the pandemic in 2021 [ 3 ]. There is a prevailing argument that WFH will persist and become a standard practice in the professional realm as a considerable number of employees expresses an interest in continuing to WFH despite a decline in health risks associated with COVID-19 infections [ 4 – 6 ]. This is particularly pronounced among parents who perceive WFH as an opportunity to effectively combine paid employment with caregiving responsibilities [ 7 ]. Indeed, the data from the Office for National Statistics (ONS) shows that from January 2022 until February 2023, on average, 35% of employees in the UK indicated working from home at some point in the past seven days [ 8 ]. Considering the increasing importance of WFH in the workplace, it is imperative to explore the potential ramifications that this mode of work may entail for workers’ careers.
In this study, we explore whether managerial preferences for promotion, salary increase, and training allowance differ depending on the employees’ engagement in WFH in the post-pandemic context of the UK. In particular, we examine whether WFH carries different career effects for women and men, taking into account their parenthood status and the prevalence of WFH in the team. Despite a sizeable volume of research exploring the link between WFH and career development, for example [ 9 – 16 ], the impact of WFH on careers is still rather ambiguous.
On the one hand, WFH has the potential to boost workers’ careers by increasing their productivity levels. This outcome arises due to several factors: reduction of workplace distractions and interruptions which are common in collocated office environments [ 17 – 19 ], the opportunity to allocate more time towards work instead of commuting [ 9 ], and the consequential improvements in job satisfaction, job autonomy, and work-life balance [ 20 – 25 ]. Home-based workers were also found to work more intensely [ 20 , 25 , 26 ], which is possibly driven by their desire to reciprocate for the opportunity to work remotely [ 27 ] or increased employer expectations [ 28 ]. However, WFH can also lead to unfavourable career consequences as it significantly impairs social interactions and communication. Those who WFH therefore experience less knowledge exchange with their co-workers and managers, fewer mentoring and networking opportunities, and are more likely to feel left out [ 29 – 32 ]. They may also be at risk of worse job visibility due to the lack of their physical presence in the workplace [ 33 , 34 ]. The home environment may also not be free from distractions, as for example, other family members can interrupt the work of home-based workers, lowering their productivity levels [ 35 ]. Additionally, employers may perceive workers who WFH as less or more productive than office-based workers due to the beliefs and attributions that they make regarding employees’ motives for engaging in WFH, ultimately impacting the career opportunities of those who WFH [ 12 , 14 , 36 ].
Several factors can moderate the impact of WFH on workers’ careers, and one of them is the frequency of WFH. The experiences of individuals who engage in WFH more frequently are likely to be different than of those who WFH only sporadically. Indeed, a meta-analysis conducted by Gajendran and Harrison [ 21 ] revealed that frequent WFH was associated with lower levels of job satisfaction and autonomy, and poorer co-worker relationship quality. Martinez and Gomez [ 37 ] showed also that the more employees were engaging in remote work, the fewer opportunities for training and development they were receiving. A more recent study by Golden and Eddleston [ 11 ] indicated that the slower salary growth experienced by American remote workers was particularly visible among frequent users of WFH. Higher levels of WFH during the COVID-19 lockdown were also associated with more social isolation and less organisational identification [ 38 ]. Social isolation appeared to be particularly important during the pandemic as evidence suggests that it significantly elevated stress levels, and consequently contributed to a decline in productivity for those working from home [ 39 ].
Furthermore, the influence of WFH on careers can vary depending on the worker’s gender or parental status. It has been hypothesised that there are varying reasons why men and women engage in this mode of working, with men doing so to increase productivity and women to better combine paid work with caregiving [ 40 – 42 ]. Consequently, employers may consider women, and mothers in particular, to be less promotion-worthy because their engagement in WFH is driven by self-serving motives (e.g. work-family reconciliation) rather than organisation-serving motives (more intense work or longer working hours) [ 14 ]. Women who WFH can also be less productive as previous research showed that their work is often interrupted by children and implies a lot of multitasking while teleworking men are better at separating the work and family spheres [ 43 ]. On the other hand, women may be rewarded for continuing to work for pay despite increased demand in the personal domain and be able to work longer hours when working from home due to the time saved on commuting [ 9 ]. Men who WFH may also face challenges due to high societal expectations of devoting themselves to work, making deviations from such norms particularly difficult for them and leading to adverse career consequences [ 44 – 48 ]. As a result, gender and parenthood likely play a moderating role in the relationship between WFH and career outcomes, although the specific direction of this influence remains uncertain.
Finally, the impact of WFH on managerial decisions regarding promotion, salary and training may also depend on how common this arrangement is in the work environment and the direct supervisor’s familiarity with this mode of working. This is because the prevalence of WFH and its use by the manager signals the degree of social acceptance and naturalisation of this work arrangement. A higher level of WFH in the immediate professional network of the employee can also imply a greater understanding of effective remote workforce management. Previous research suggests that organisational settings, such as high-performance work culture and the financial implications related to the use of flexible work policies, exert a negative influence on the intentions of employees to participate in flexible work [ 49 ]. Similarly, men’s use of parental policies at work has been shown to heavily depend on the behaviour of other colleagues, particularly men [ 50 ]. Therefore, a higher prevalence of WFH within a group of close workers and its use by the direct supervisor, indicative of higher social acceptance and familiarity with WFH, have the potential to mitigate the adverse career implications typically associated with this work arrangement.
Previous research examining the relationship between WFH and workers’ career outcomes has produced inconsistent findings, with some indicating negative effects [ 11 ] and others suggesting positive effects [ 9 , 15 , 16 ] of WFH on workers’ opportunities for promotion or salary increases. However, these studies may be subject to sample selection issues as they rely on survey data. For example, if only the most productive and high-performing workers are granted greater flexibility, the positive influence of WFH on career outcomes may be overestimated [ 18 , 22 , 26 , 51 ]. Conversely, the negative effects of WFH may also be overestimated if individuals who request this working arrangement are less career-oriented. A few studies have employed experimental designs to mitigate selection bias and they predominantly found detrimental effects of WFH on workers’ career outcomes [ 12 , 13 , 32 , 52 ]. These negative effects were stronger for parents than childless workers, but interestingly, they were attenuated for fathers who pursued WFH for childcare-related reasons [ 12 ]. However, it is important to note that these studies were conducted before the COVID-19 pandemic when WFH was much less prevalent and socially accepted.
There are several ways in which this article contributes to the literature. First, to the best of our knowledge, our study is the first post-pandemic study that provides evidence of the effects of WFH on managerial preferences and attitudes towards those engaging in this mode of working. The study, therefore, sheds light on how the impact of WFH on careers is manifested in the current times after the extensive and widespread use of WFH during the pandemic. The results of a survey conducted during the pandemic among home-based workers in the UK showed that 84% of them would like to continue working from home once the pandemic ends [ 4 ]. This inclination among employees to continue remote work aligns with the recent data concerning the prevalence of home-based work in the UK during the late/post-pandemic period, which indicates that approximately 35% of employees reported engaging in working from home at least once within the past seven days between January 2022 and February 2023 [ 8 ]. It can be stated then that WFH has attained a broader scope of adoption within the UK in comparison to the pre-pandemic period, and the circumstances captured in our survey (in the second half of 2022) closely resemble the post-Covid reality in the country. Besides providing evidence on the impact of WFH on workers’ careers in the post-pandemic context, the study also contributes to the literature by providing causal evidence of the effects of WFH on workers’ careers across different populations (i.e. based on worker’s gender and parenthood status) and organisational settings (i.e. the prevalence of WFH in the team). Although a sizeable body of literature has explored the link between WFH and careers, many of the previous studies rely on survey data, which may suffer from sample selection problems, and the few experimental studies conducted on this topic rarely incorporate such a wide range of moderators (individual and group-level) of the impact of WFH on careers. Our approach thus allows us to not only account for the unobserved factors which may confound the relationship between WFH and careers but also to accurately distinguish how various groups of employees are perceived and judged differently when engaging in WFH. Finally, our findings highlight the importance of organisational settings that either foster or hinder social acceptance and familiarisation of flexible working arrangements and ultimately impact the careers of those who engage in them.
Materials and methods
We investigate the effects of WFH on workers’ career outcomes in the UK by using data from the survey experiment which was pre-registered on the Open Science Framework. All deviations from the pre-registered plan and the study questionnaire are listed in the S1 Appendix . The study protocol was approved by the Ethics Committee of the University of Warsaw. The experiment was run online in the UK between July and December 2022 by an external research company. The participants were paid for participation in surveys in accordance with the rates indicated by the research company.
Study design
The study design involved a survey experiment, namely, a paired conjoint with a forced answer. Participants were presented with three sets of worker profiles, with two profiles displayed side by side on each of the three pages (i.e. one page after another without the possibility of going back to the previous page). Each profile consisted of seven attributes (working mode, sex, number of children, age, work experience, skills ranking, and performance rating) that were randomly assigned to the profiles. The levels of the attributes are presented in Table 1 . For half of the profile pairs, a randomisation process was employed to show the performance ratings, whereas, for the other pairs, the performance rating was intentionally withheld and marked as ’not provided’. After familiarising themselves with the pair of workers’ profiles, participants were asked five questions, namely which employee they would choose for (1) promotion, (2) salary increase (3) training, and which employee they consider to be (4) more competent and (5) more committed to work. The study instructions and examples of workers’ profiles presented to participants are shared in the S1 Appendix . Once the participants compared three pairs of workers’ profiles, they were asked several questions about themselves and their workplace, including questions on the prevalence of WFH in the company and its use by the direct supervisor.
- PPT PowerPoint slide
- PNG larger image
- TIFF original image
https://doi.org/10.1371/journal.pone.0303307.t001
The study participants were recruited from an existing online opt-in panel and comprised of managers (i.e. individuals with supervisory responsibilities) based in the UK. The managers at the time of the survey were employed in occupations, in which the share of jobs that can be done at home is at least 50%, as per a study by Dingel and Neiman [ 53 ]. This sample restriction was used to avoid a situation in which a manager does not choose a person who WFH for promotion as working from home is not possible in this occupation. The managers worked in companies that employed at least 10 individuals and supervised at least 5 employees. The data is representative in terms of the size and geographical location of the company, as well as the managers’ gender.
The overall number of participants for which the data has been collected amounted to 1,206. From the initial sample, we chose only individuals who met the selection criteria in terms of the time they allocated to complete the experiment module of the survey. We established a cut-off threshold of 29 seconds, with sub-threshold time limits of less than 15 seconds for the first pair of profiles, less than 9 seconds for the second pair, and less than 5 seconds for the third pair. As a result of implementing this restriction, we excluded 269 respondents, resulting in a final sample size of 937 participants and a total of 5,622 data records (937 individuals * 3 * 2 profiles compared).
Our analysis primarily focuses on the subset of records in which the performance rank (profile attribute) was designated as ’not provided’. We contend that such a focus allows us to capture circumstances observed in the ‘real world’, where employers do not have information about the work performance of remote workers and office-based workers and have to make assumptions about it based on past experience or their own presumptions. This restriction does not alter the number of respondents, which remains at 937, but it does impact the number of records by approximately half (as the performance rating was randomly set to ’not provided’ for half of the pairs of profiles). Consequently, our analysis encompasses 937 respondents evaluating 2,804 fictitious worker profiles (records).
The final sample comprises mostly individuals aged 35 and above, holding managerial positions and possessing higher educational qualifications. Additionally, they have at most two children. Within our sample, 38.5% are women, a proportion consistent with the observed percentage of female managers in 2019 LFS data (which is the latest available) for the United Kingdom [ 2 ]. The sample is predominantly composed of IT specialists, accountants, and engineers, constituting 54% of all participants. The managers employed in the IT sector account for 23% of the sample, followed by the accounting and finance departments, which constitute 18.4% of the respondents. The participants assume decision-making responsibilities pertaining to employee promotions (69.7%), training (54.5%), evaluation (90.4%), and employment conditions such as remuneration and contract terms (55%). A significant majority of respondents (78%) indicated that they engage in remote work, at least sporadically. Furthermore, among those who work remotely, the majority (52%) do so in a hybrid manner, alternating between office attendance and working from home several times per week. The demographic characteristics of the respondents included in the analysis are shown in Table 2 , while Table 3 presents features of the team and company they work in.
https://doi.org/10.1371/journal.pone.0303307.t002
https://doi.org/10.1371/journal.pone.0303307.t003
The participants predominantly work in companies engaged in financial and insurance activities, as well as the information and communications sector. This likely contributes to the significant proportion of employees within the respondents’ teams who engage in remote work. Specifically, in approximately half of our sample (50.5%), over 80% of team members work from home at least occasionally. Conversely, in 16.2% of teams, no team member engages in remote work. Furthermore, around 23.8% of the companies represented in the survey are situated in London. Interestingly, despite the majority of companies being large organisations with over 1,000 employees (40.6%), the managers included in our sample primarily oversee relatively small teams of 5–9 individuals (45.8% on average).
Key variables
In this study, we explore the effect of WFH on career outcomes. We thus focus on three outcome variables, namely being chosen for (yes or no): (1) promotion, (2) salary increase and (3) training. Our main explanatory variable is the working mode (full-time; 5 days a week), which assumes one of the three categories: working fully on-site (working from the office five days a week), working in a hybrid mode (working two days from home, three days from the office) and fully from home (working from home 5 days a week). Further variables of interest include worker’s sex (coded as women, or men) and parenthood status—number of children in the household (coded as parents, or non-parents). Another moderator variable included in the study is the prevalence of WFH in the team measured by the question ‘How many of the workers under your supervision work from home at least one day a week on a regular basis?’ with three categories: 0–39% (Low), 40–79% (Moderate) and 80+% (High). The final moderator, the manager’s frequency of WFH, is recoded from two measures asking about whether the managers work from home and, if so, how often they do so. The variable assumes three levels: Never, Sporadically (several times a month or less often) and Often (several times a week or daily). Remaining profile attributes, such as workers’ age, work experience and skills are considered to be control variables in the models.
Data analysis
In our analysis, we employ a logistic regression with a separate model constructed for each of the three outcome variables. The estimated coefficients of the models are used to derive the predicted probabilities (i.e. estimated marginal means) of choosing an employee for promotion, salary raise and training. We use 83% confidence intervals (CIs) as it was demonstrated that nonoverlapping 83% CIs are sufficient to display statistically significant differences (at 0.05 level) between two probabilities in logistic regression [ 54 ].
First, we investigate the impact of WFH and its frequency (hybrid vs full-time home-based work) on workers’ opportunities for promotion, salary increase, and training. Subsequently, we examine the potential moderating role of gender and parenthood status by interacting the working mode variable with these factors. Furthermore, we extend our analysis to explore the group-level factors that can influence the effect of WFH on career outcomes. To achieve this, we introduce an additional interaction term involving the prevalence of WFH in the team. This enables us to assess how the career effects of WFH may be contingent upon the level of WFH adoption, and subsequent familiarisation and social acceptance of this mode of working.
The data analysis results are presented graphically as predicted probabilities, with full regression tables shared in the Tables 1–4 of S1 Appendix .
Managerial promotion preferences and WFH
First, we explore whether managerial preferences for promotion, salary increase, and training depend on employee engagement in WFH ( Fig 1 ). We find that employees who work in the hybrid and fully home-based mode are less likely to be chosen for promotion and salary increase than those who work from the office. Those, who fully WFH, are also less likely to be chosen for training than office-based workers. Specific results show that those who work in the hybrid mode (2 days at home, 3 days at the office) are 7.7% less likely to be chosen for promotion and 7.1% less likely to be chosen for a salary increase than office-based workers. Those who entirely work from home (5 days at the office) are 10.7% less likely to be chosen for promotion, 9.4% less likely to be chosen for a salary and 6.6% less likely to be chosen for training than those who work on-site. Importantly, there is no statistically significant difference in the chances of being chosen for promotion and salary increase between full-time and hybrid home-based workers though full-time homeworkers are significantly less likely to receive training than hybrid workers. Overall, our findings demonstrate that engaging in WFH carries negative career implications related to diminished chances for promotion, salary increase, and training.
Full estimation output is presented in the Table 1 of S1 Appendix . Confidence intervals represent 83%.
https://doi.org/10.1371/journal.pone.0303307.g001
Moderating effect of the prevalence of WFH in the team
Furthermore, we explore the moderating role of the prevalence of WFH in the team on the impact of WFH on career outcomes ( Fig 2 ). We find that individuals who WFH are less likely to be chosen for promotion and salary increase than those working from the office but only when the prevalence of WFH in their team is lower, namely less than 80% (for promotion) or 40% (for salary increase) of the team members work from home at least one day a week. Clearly, in teams where WFH is common (>80% of workers make use of it), there are no differences in the chances for a promotion or salary increase with respect to the mode of work. Different findings are observed when it comes to training opportunities: here we observe that lower training opportunities are given to full-time home-based workers both when the prevalence of WFH in the team is low (less than 40% of workers use it) and high (more than 80% of workers use it).
Full estimation output is presented in the Table 2 of S1 Appendix . Confidence intervals represent 83%. WFH prevalence is measured by the question ‘How many of the workers under your supervision work from home at least one day a week on a regular basis?’, with Low WFH referring to 0–39%, Moderate WFH referring to 40–79%, and High WFH referring to more than 80%.
https://doi.org/10.1371/journal.pone.0303307.g002
Moderating effect of the manager’s WFH frequency
In the next step, we include the manager’s frequency of WFH as a moderator in the effect of WFH on careers ( Fig 3 ). We find that supervisors who use WFH often (several times a week or daily) are equally inclined to offer promotions and salary raises to employees working from the office as well as those who WFH (both frequencies). However, managers who use WFH sporadically (several times a month or less often) or never are less likely to grant promotions to home-based workers (both frequencies) and salary increases to workers who exclusively WFH. The salary raise penalty is evident among hybrid workers only when the manager never works from home. In general, these findings are largely in line with those on the moderating effects of WFH prevalence in the team, providing robust evidence that more widespread use of WFH in the organisation reduces the promotion and salary penalties for WFH. Regarding training, we find that those who fully WFH are less likely to be granted it when the manager both never works from home and does so often. The results for the sporadic use of WFH by the manager are not statistically significant.
Full estimation output is presented in the Table 3 of S1 Appendix . Confidence intervals represent 83%. Manager’s frequency of WFH is measured by the questions ‘Do you currently work from home at least from time to time?’ and ‘How often do you currently work from home?’, with Never, Sporadically referring to several times a month or less often, and Often referring to several times a week or daily.
https://doi.org/10.1371/journal.pone.0303307.g003
Moderating effects of gender and parenthood
Finally, we run interaction models of WFH, gender and parenthood status to explore the moderating role of these variables in the effect of WFH on career progression ( Fig 4 ). Our findings reveal that negative effects of WFH on careers exist for men, both fathers and non-fathers and childless women. Fathers and childless men are less preferred for promotion and salary raises when working from home regardless of their frequency of WFH as both hybrid and fully home-based workers experience similar career consequences (with the exception of childless men who do not get penalised in regards to pay when working fully from home). Whereas, childless women are less likely to be chosen for promotion (but not salary raise) than on-site workers only when they work fully from home. For mothers, we observe no negative consequences of WFH for their promotion or pay, even if they work solely from home. When looking only at the group of fully home-based workers, mothers have higher chances of being preferred for promotion and salary raise than men, both childless men and fathers. Interestingly, in contrast to the first two outcome variables, we find that childless women and mothers who work fully from home are less likely to be chosen for training than on-site workers but we do not find such effects for men. However, it is worth pointing out that the difference in being preferred for training between childless women working from home and those working on-site is marginally statistically significant. In sum, these findings suggest that men and childless women who WFH are less likely to be promoted and receive a pay raise than those working on-site, whereas, mothers working from home are less likely to receive training than on-site working mothers.
Full estimation output is presented in the Table 4 of S1 Appendix . Confidence intervals represent 83%.
https://doi.org/10.1371/journal.pone.0303307.g004
In addition, we run the above model in interaction with the prevalence of WFH in the team and we find that negative WFH effects for promotion and pay exist only in teams where the prevalence of WFH is low (i.e. less than 40% of workers WFH at least one day a week). This applies to all workers regardless of their gender or parenthood status (see the Figs 1–3 and Table 5 in S1 Appendix ). Consistent findings are obtained when considering the moderator manager’s WFH frequency, with promotion and pay penalties experienced by all workers, yet, only when the manager has little exposure to WFH (never or sporadically categories). The results for these models are also presented in Figs 4–6 and Table 6 of S1 Appendix .
The phenomenon of WFH has witnessed a remarkable surge in popularity, emerging as a prevalent practice in numerous professional contexts [ 5 , 6 , 8 , 55 ]. This widespread adoption of WFH can be attributed to its perceived advantages, encompassing various beneficial aspects for both employees and employers. Employees stand to gain from the potential enhancement of work-life balance [ 10 , 20 , 21 , 39 , 56 , 57 ], increased flexibility [ 58 ], greater autonomy over their tasks [ 59 ], and time saved on commuting [ 60 ]. Employers, in turn, can reap advantages such as reduced expenses on physical office space and the potential for a more engaged and productive workforce [ 24 , 26 , 51 , 60 – 62 ]. Research conducted before the COVID-19 pandemic has yielded inconclusive findings regarding the impact of WFH on career outcomes. It is vital to note, however, that previous studies frequently relied on survey data, which may be susceptible to endogeneity issues and sample selection bias, with subsequent overestimation or underestimation of the impact of WFH on careers [ 9 , 14 , 51 , 61 ]. Additionally, some of these studies focused on results obtained from a single organisation, rather than including the entire working population [ 11 , 37 , 63 ]. Yet, prior research underscored that employer beliefs about why employees WFH and their levels of productivity while doing so are important for the impact of WFH on careers [ 14 ].
In this study, we contribute to the existing literature by providing empirical evidence that establishes a causal link between WFH and career consequences, specifically in terms of promotional prospects, salary raises, and training opportunities. Our findings align with earlier experimental investigations conducted before the pandemic showing the detrimental impact of WFH on careers [ 12 , 13 , 52 ]. Thus, this means that the extensive experience with WFH during the COVID-19 pandemic, and the subsequent normalisation of this mode of working in the public sphere, has not (yet) altered the negative effects of WFH. This is consistent with findings of studies conducted during the COVID-19 pandemic, showing a negative link between WFH and various work-related dimensions, for example, social isolation and interruptions, attachment to the company and knowledge exchange [ 30 – 32 , 38 ]. However, contrary to previous research based on survey data [ 11 , 34 ], we find that the detrimental consequences of WFH on career outcomes are not contingent upon the frequency of remote work, with few exceptions mentioned in the Results sections. Both individuals engaged in hybrid work arrangements (i.e. work 2 days at home and 3 days a week at the office) and those exclusively working from home (i.e. work from home 5 days a week) encounter comparable and diminished prospects for promotion and salary increases. The tendency of managers to exhibit a diminished preference for promoting workers who WFH can be attributed to several factors. One such factor pertains to the challenge faced by managers in accurately evaluating the productivity of employees who WFH, as they rely on assessing the output of their work rather than ‘face time’ which is easier to determine [ 35 , 59 ]. As a result, managers may exhibit a perceptual bias toward employees who engage in WFH [ 64 ]. Moreover, the complexity and ambiguity inherent in coordinating, monitoring, and controlling processes within teleworking teams contribute to decreased operational efficiency, thereby diminishing managers’ preference for promoting remote workers to higher-rank roles [ 32 , 65 , 66 ]. Future research should aim at identifying and investigating the mechanisms behind the reduced propensity among managers to grant home-based or hybrid workers promotions, salary raises and training.
This study also explored whether a manager’s experience with WFH and its prevalence in the team moderate the negative effect of WFH on careers. The findings reveal that managers with limited exposure to WFH are less inclined to endorse promotions and salary raises for employees engaging in this mode of working. Conversely, managers who frequently WFH themselves refrain from penalising home-based workers. A plausible explanation lies in the fact that, when managers personally adopt WFH, they exhibit less bias towards it and they are more aware of both the challenges and advantages associated with remote work. Consequently, this familiarity with WFH can also position them to be able to more effectively manage a workforce engaged in this mode of working. To the best of our knowledge, this is the first experimental study illustrating how managers’ use of WFH moderates their assessments of career opportunities for employees working remotely. As direct supervisors are often seen as the guards to career advancement—they perform performance appraisals and make suggestions for promotions [ 67 ]—this finding holds substantial significance for both the literature and practice. We also find that the higher the prevalence of WFH in the team, the less prominent the negative career consequences of WFH. Ultimately, in teams where the share of employees who WFH at least occasionally on a regular basis is 80% or more, there are no differences in chances for promotion, pay and training with respect to the mode of working. This could be because a higher prevalence of WFH in the team may indicate a wider social acceptance and familiarisation with this mode of working. Our results are consistent with previous research in the area [ 47 , 49 , 68 , 69 ], indicating the importance of workplace settings in shaping the experience of employees who use flexible working arrangements. However, past research on this topic was often restricted to the level of the whole organisation rather than the co-workers. Therefore, our research further contributes to the literature by demonstrating the influence of the immediate social group at work (i.e. the employee team) on the career outcomes of individuals who WFH.
Furthermore, we provide evidence that managerial (dis)preferences towards employees working from home are gendered and depend on workers’ parental status. Interestingly, we find no negative promotion or pay implications for mothers who WFH, which is true for those who work in both the hybrid mode and solely from home. Employees who experience lower promotion and salary raise prospects when working from home are men (both childless and parents) and childless women. One possible explanation for this finding is that employees engaging in WFH deviate from the stringent norm of an ideal worker who is fully devoted to work, often able to work long hours and puts work above other responsibilities and personal life [ 70 , 71 ]. Breaking such norms can lead to the stigmatisation of employees and a negative perception of their work, job commitment or productivity [ 70 ]. Considering that flexible working arrangements are commonly used by working parents as a means to effectively integrate their professional and personal lives, it can be argued that gender norms and beliefs play a role in shaping the occurrence and targets of flexibility stigma [ 64 ]. In the case of this study, when mothers choose to WFH, they deviate from the expectations of the ideal worker, yet align with the prescriptive societal gender norms that women should prioritise family responsibilities over professional pursuits [ 72 ]. Whereas, men who engage in WFH deviate from both workplace and societal gender norms, which can lead to unfavourable career outcomes [ 49 ]. Indeed, previous studies have consistently demonstrated that men who assume caregiving responsibilities at the expense of work, such as taking parental leave or reducing their working hours, face more severe professional repercussions than women [ 44 – 48 ].
Another important explanation for the finding that childless women and men are more likely to experience negative career consequences for WFH than mothers may be that they are perceived as groups of workers that do not have an important reason to WFH, as compared to mothers who need to combine the increased demand in their personal life with paid work [ 10 , 42 , 43 ]. Consequently, employers may create negative presumptions about their productivity and commitment to work [ 12 , 14 , 36 ]. Within the context of the UK, combining paid work with childrearing is largely a woman’s job as public support for working parents is limited and mothers are seen as primary caregivers [ 73 ]. In this country there is also a strong and expanding right to request flexible working and such arrangements are most prevalent among working mothers [ 1 , 74 , 75 ]. This could indicate that, within the UK context, the use of flexible working arrangements may be perceived by managers as more acceptable (and justified) among mothers, as opposed to non-parents and fathers. The strong presence of ideal worker norms in the UK may further disadvantage men and childless women who deviate from them by engaging in flexible work, potentially signalling to their employers a lower commitment to work or productivity [ 64 ]. Indeed, the fear of negative career consequences was stated as one of the most important reasons why workers do not take up flexible working arrangements in the UK [ 64 ]. Considering that promotion and salary raises are seen as investments in employees [ 76 ], men and childless women who decide to WFH may, therefore, be perceived in a negative light as less advancement-worthy employees.
Moreover, it may be reasonable for managers to anticipate that working mothers who engage in WFH will display increased commitment and exert greater effort as a means of reciprocating for the flexibility afforded to them [ 27 , 77 ]. The use of WFH by employees is often motivated by the desire (or need) to better integrate personal and professional spheres, particularly for individuals with childcare responsibilities [ 40 – 42 , 74 ]. For working mothers, the option to WFH may be perceived by managers as an important employee-related benefit allowing them to better reconcile work and family lives. Consequently, managers may hold the belief that mothers who WFH will exhibit an increased commitment to work and productivity to reciprocate for this benefit. Previous research confirms that employees granted the opportunity to work flexibly are often willing to make sacrifices, such as altering the number of hours worked, even at the expense of their personal time or compensation [ 78 ]. Additionally, Kelliher and Anderson (2010) find that employees engaged in remote work demonstrate increased effort and heightened commitment. Notably, as evidenced in the mentioned study, trading flexibility for increased effort was not openly discussed or negotiated with the employer, but it was rather entirely assumed by remote workers, which indicates a significant inner desire to reciprocate for this benefit. Prior research also suggests that some managers deliberately exercise their discretion in granting remote work to encourage longer working hours and foster greater commitment [ 79 ]. In sum, managers may presume that mothers who engage in WFH feel obliged to reciprocate for the “privilege” to WFH and anticipate that they will fulfil this obligation by delivering additional effort that benefits the employer. As a result, mothers who WFH are not penalised for their participation in this working arrangement.
What is more, in alignment with previous research [ 37 ], our findings demonstrate that individuals who WFH receive comparatively less training allowance than on-site workers. However, when considering gender and parenthood, our results substantially diverge from the findings concerning promotion and pay outcome variables presented in this study. We observe that mothers who WFH are less preferred for training opportunities compared to on-site working mothers. Interestingly, these negative effects are not observed for men (results for childless women are marginally statistically significant), which stands in opposition to the findings obtained for promotion and pay raises. We interpret these findings by considering that although training can be seen as a discretionary resource [ 76 , 80 ], managers from our study may have viewed it primarily as a means of employee ‘improvement’ rather than as a reward. Consequently, those who WFH and are already equally worthy of promotion and pay raise as office-based workers (i.e. mothers) do not need the additional training and development opportunities. In addition, managers may perceive mothers who WFH to be more committed to their work and work harder to reciprocate for being allowed to work flexibly [ 27 , 77 ]. Therefore, from the managers’ perspective, mothers working from home may be seen as more productive and committed than on-site working mothers, which means that they do not experience negative WFH effects in relation to promotion and pay increases, and are less likely to be granted training as they do not require further improvement to their performance.
In summary, our findings indicate that WFH has detrimental effects on career outcomes in the post-pandemic era. However, it is plausible that these adverse consequences may attenuate over time as WFH becomes even more prevalent and socially acceptable, and employers develop effective mechanisms for managing and evaluating remote workers. Our research results have implications beyond the specific context of this study, as we demonstrate that the adverse effects of WFH on career outcomes are mitigated in settings where this mode of working is more prevalent and when the direct supervisor has more experience with WFH. Given the substantial adoption of WFH in the UK compared to other countries, it is reasonable to anticipate similar career penalties in countries with a lower prevalence of remote work.
Supporting information
S1 appendix. appendix–the supplementary information..
https://doi.org/10.1371/journal.pone.0303307.s001
S1 Data. Dataset.
https://doi.org/10.1371/journal.pone.0303307.s002
Acknowledgments
The authors would like to acknowledge the very useful comments received at various national and international conferences where this study was presented, for example, the Gender Gaps Conference 2022, Australian Gender Economic Association Workshop (AGEW) 2023, Population Association of America (PAA) Annual Meeting 2023, and the Economic Science Association (ESA) Meeting 2023. The gratitude extends to colleagues from the Interdisciplinary Centre for Labour Market and Family Dynamics (LabFam) at the University of Warsaw for extensive feedback on the study design and concept plan.
- 1. Eurofound. The rise in telework: Impact on working conditions and regulations. Luxembourg: Publications Office of the European Union; 2022.
- 2. Eurostat. The European Union Labour Force Survey (EU-LFS); 2019 [cited 2023 June]. Eurostat [Internet]. Available from: https://ec.europa.eu/eurostat/web/microdata/european-union-labour-force-survey
- 3. Eurostat. The European Union Labour Force Survey (EU-LFS); 2023 [cited 2023 June]. Eurostat [Internet]. Available from: https://ec.europa.eu/eurostat/data/database?node_code=lfsa_ehomp
- View Article
- Google Scholar
- PubMed/NCBI
- 35. Demerouti E, Derks D, Ten Brummlhuis LL, Bakker AB. New ways of working, impact on working conditions, work-family balance, and well-being. In: Korunka C, Hoonakker P, eds. The impact of ICT on quality of working life. Dordrecht: Springer; 2014. p. 123–141.
- 59. Kossek EE, Thompson RJ. Workplace flexibility: Integrating employer and employee perspectives to close the research–practice implementation gap. In: Pitt-Catsouphes M, Kossek EE, Sweet S, editors. The Oxford Handbook of Work and Family. Oxford: Oxford University Press; 2016. p. 215–239.
- 67. Greenhaus JH, Callanan GA, Godshalk VM. Career management for life. Routledge; 2018.
- 72. Blair-Loy M. Competing devotions: Career and family among women executives. Cambridge, US: Harvard University Press; 2003.
- 75. Wanrooy B, Bewley H, Bryson A. Employment relations in the shadow of recession: Findings from the 2011 workplace employment relations study. Bloomsbury Publishing; 2013.
- 80. Shore LM, Shore TH. Perceived organizational support and organizational justice. In: Cropanzano RS, Kacmar KM, editors. Organizational Politics, Justice, and Support: Managing the Social Climate of the Workplace. Westport, CT: Quorum; 1995. p. 149–164.
Electric field-induced changes in photoluminescence and Raman spectra of MoS 2 on PVA-coated conductive substrate with nematic liquid crystals: a combined numerical and experimental study
- Published: 13 May 2024
- Volume 35 , article number 954 , ( 2024 )
Cite this article

- Muhammad Kashif 1 &
- Altamash Shabbir ORCID: orcid.org/0009-0003-7202-8491 2
Explore all metrics
Transition metal dichalcogenides, particularly Molybdenum Disulphide (MoS 2 ), have garnered significant attention in scientific research due to their remarkable optoelectrical characteristics. In this study, the characteristics of MoS 2 flakes deposited on indium tin oxide (ITO) glass slides coated with polyvinyl alcohol (PVA) were investigated. The influence of a strain stimulus provided by a nematic liquid crystal (NLC) called 5CB on the MoS 2 structure was studied using Raman polar plots, revealing its potential as an electrically controlled light controller. The analysis of Raman Shift showed that the application of tensile strain-induced defects in the MoS 2 structure resulted in a lowered bandgap energy level. Photoluminescence (PL) spectroscopy demonstrated that the combination of 5CB and an electric field enhanced the exciton lifetime and decreased the bandgap energy levels. The study employed theoretical and computational modeling of PL/Raman techniques for qualitative and quantitative analysis of the PVA-coated ITO-MoS 2 sample. The utilization of Mathematica v 9.0 contributed to the accuracy and reliability of the results, ensuring robust analysis and interpretation of the experimental data. These findings contribute to the understanding of strain-induced effects on MoS 2 and highlight the potential of using NLCs for optoelectronic control in MoS 2 -based devices.
This is a preview of subscription content, log in via an institution to check access.
Access this article
Price includes VAT (Russian Federation)
Instant access to the full article PDF.
Rent this article via DeepDyve
Institutional subscriptions
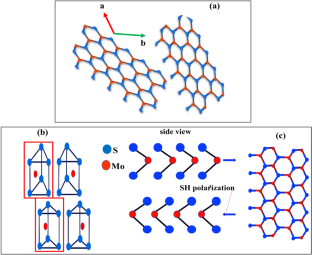
Data availability
The data used in this research will be made available upon request.
Abbreviations
Transition metal dichalcogenides
Two dimensional
Niobium sulphide
Tantalum sulphide
Electron volt
Indium doped tin oxide
Molybdenum sulphide
Polyvinyl alcohol
Liquid crystals
Nematic liquid crystals
Polydimethylsiloxane
Electric field
Photoluminescence
Z. Wang, B. Mi, Environmental applications of 2D molybdenum disulfide (MoS 2 ) nanosheets. Environ. Sci. Technol. 51 , 8229–8244 (2017)
Article CAS PubMed Google Scholar
N. Thomas, S. Mathew, K.M. Nair, K. O’Dowd, P. Forouzandeh, A. Goswami, G. McGranaghan, S.C. Pillai, 2D MoS 2 : structure, mechanisms, and photocatalytic applications. Mater. Today Sustain. 13 , 100073 (2021)
Article Google Scholar
Z. Ye, C. Tan, X. Huang, Y. Ouyang, L. Yang, Z. Wang, M. Dong, Emerging MoS 2 wafer-scale technique for integrated circuits. Nano-Micro Lett. 15 , 38 (2023)
Article CAS Google Scholar
Z. Wang, X. Xiong, J. Li, M. Dong, Screening fermi-level pinning effect through van der waals contacts to monolayer MoS 2 . Mater. Today Phys. 16 , 100290 (2021)
M. Mohan, N.P. Shetti, T.M. Aminabhavi, Phase dependent performance of MoS 2 for supercapacitor applications. J. Energy Storage 58 , 106321 (2023)
A. Altibelli, C. Joachim, P. Sautet, Interpretation of STM images: the MoS 2 surface. Surf. Sci. 367 , 209–220 (1996)
S. Parmar, S. Panchal, S. Datar, S. Ogale, Semiconductor-semimetal 2D/3D MoS 2 /SrRuO 3 (111) TMD/TMO heterojunction-based ReRAM devices. ACS Appl. Electron. Mater. 5 , 5588–5597 (2023)
S. Parmar, A. Biswas, B. Ray, S. Gosavi, S. Datar, S. Ogale, Stabilizing metastable polymorphs of van der Waals solid MoS 2 on single crystal oxide substrates: exploring the possible role of surface chemistry and structure. J. Phys. Chem. C 125 , 11216–11224 (2021)
I.M. Datye, A. Daus, R.W. Grady, K. Brenner, S. Vaziri, E. Pop, Strain-enhanced mobility of monolayer MoS 2 . Nano Lett. 22 , 8052–8059 (2022)
D.R. Kripalani, P.-P. Sun, P. Lin, M. Xue, K. Zhou, Strain-driven superplasticity of ultrathin tin (II) oxide films and the modulation of their electronic properties: a first-principles study. Phys. Rev. B 100 , 214112 (2019)
B.H. Kim, M. Park, M. Lee, S.J. Baek, H.Y. Jeong, M. Choi, S.J. Chang, W.G. Hong, T.K. Kim, H.R. Moon, Effect of sulphur vacancy on geometric and electronic structure of MoS 2 induced by molecular hydrogen treatment at room temperature. RSC Adv. 3 , 18424–18429 (2013)
M. López-Suárez, I. Neri, R. Rurali, Band gap engineering of MoS 2 upon compression. J. Appl. Phys. (2016). https://doi.org/10.1063/1.4948376
X. Li, H. Zhu, Two-dimensional MoS 2 : properties, preparation, and applications. J. Materiomics 1 , 33–44 (2015)
K.M. Herbert, H.E. Fowler, J.M. McCracken, K.R. Schlafmann, J.A. Koch, T.J. White, Synthesis and alignment of liquid crystalline elastomers. Nat. Rev. Mater. 7 , 23–38 (2022)
H. Ayeb, M. Derbali, A. Mouhli, T. Soltani, F. Jomni, J. Fresnais, E. Lacaze, Viscoelastic and dielectric properties of 5CB nematic liquid crystal doped by magnetic and nonmagnetic nanoparticles. Phys. Rev. E 102 , 052703 (2020)
N.Y. Canli, D. Özükanar, D. Vardar, P. Kavak, A.A. Bozkurt, H. Ocak, B.B. Eran, Determination of dielectric properties of 5CB nematic liquid crystal doped with new chiral calamitic compounds. J. Mater. Sci.: Mater. Electron. 34 , 1304 (2023)
CAS Google Scholar
D.V. Shmeliova, S.V. Pasechnik, S.S. Kharlamov, A.V. Zakharov, E.P. Pozhidaev, V.A. Barbashov, T.P. Tkachenko, Capillary flows of nematic liquid crystal. Crystals 10 , 1029 (2020)
X. Zhan, D. Luo, K.-L. Yang, Multifunctional sensors based on liquid crystals scaffolded in nematic polymer networks. RSC Adv. 11 , 38694–38702 (2021)
Article CAS PubMed PubMed Central Google Scholar
E. Blundo, C. Di Giorgio, G. Pettinari, T. Yildirim, M. Felici, Y. Lu, F. Bobba, A. Polimeni, Engineered creation of periodic giant, nonuniform strains in MoS 2 monolayers. Adv. Mater. Interfaces 7 , 2000621 (2020)
G. Pathak, G. Shukla, A. Srivastava, O. Strzezysz, R. Manohar, Dispersion of nanoparticles into the low birefringent nematic liquid crystal: study of optical and electro-optical parameters and its applicability towards liquid crystal displays. J. Theor. Appl. Phys. 14 , 51–59 (2020)
P. Tripathi, D. Singh, T. Yadav, V. Singh, A. Srivastava, Y. Negi, Enhancement of birefringence for liquid crystal with the doping of ferric oxide nanoparticles. Opt. Mater. 135 , 113298 (2023)
L.-L. Ma, C.-Y. Li, J.-T. Pan, Y.-E. Ji, C. Jiang, R. Zheng, Z.-Y. Wang, Y. Wang, B.-X. Li, Y.-Q. Lu, Self-assembled liquid crystal architectures for soft matter photonics. Light Sci. Appl. 11 , 270 (2022)
J.-S. Yu, J.-J. Hwang, D.-H. Kim, J.-H. Kim, Anchoring strength of a nematic liquid crystal on 2D materials. Liq. Cryst. 50 , 674–680 (2023)
A. Shabbir, Z. Khan, A. Ali, W. Qasim, N. Ahmad, Z. Hussain, H. Pervaiz, Diamond-like carbon film deposited via electrochemical route for antireflection applications in photovoltaic. Key Eng. Mater. 928 , 163–175 (2022)
J. Wang, Z. Ji, G. Yang, X. Chuai, F. Liu, Z. Zhou, C. Lu, W. Wei, X. Shi, J. Niu, Charge transfer within the F4TCNQ-MoS 2 van der Waals Interface: toward electrical properties tuning and gas sensing application. Adv. Func. Mater. 28 , 1806244 (2018)
A.R. Dogra, V. Sharma, P. Malik, P. Kumar, Fabrication and characterization of multilayer self assembled silica nanoparticles in a confined empty ito cell with in-situ homeotropic alignment of dye doped liquid crystal for display devices, Available at SSRN 4583154
A. Shabbir, Z. Hussain, Z.S. Khan, W. Qasim, Morphology matters: investigating the influence of granules and nanofibers on the physicochemical properties of TiO 2 for optoelectronic applications. Opt. Mater. 146 , 114525 (2023)
V.J. Cicily Rigi, M.K. Jayaraj, K.J. Saji, Effect of substrate and substrate temperature on the deposition of MoS 2 by radio frequency magnetron sputtering. J. Vacuum Sci. Technol A (2022). https://doi.org/10.1116/6.0001685
V.Y. Reshetnyak, and Taras Shevchenko National University of Kyiv Kyiv Ukraine. Theoretical modeling of liquid crystal based tunable metamaterials. 0024 (2019)
J. Gao, Y.D. Kim, L. Liang, J.C. Idrobo, P. Chow, J. Tan, B. Li, L. Li, B.G. Sumpter, T.-M. Lu, Transition-metal substitution doping in synthetic atomically thin semiconductors. Adv. Mater. 28 , 9735 (2016)
C. Vidya, C. Manjunatha, A. Pranjal, I. Faraaz, K. Prashantha, A multifunctional nanostructured molybdenum disulphide (MoS 2 ): an overview on synthesis, structural features, and potential applications. Mater. Res. Innov. 27 , 177–193 (2023)
Y.V. Zhumagulov, A. Vagov, D.R. Gulevich, P.E. Faria Junior, V. Perebeinos, Trion induced photoluminescence of a doped MoS 2 monolayer. J. Chem. Phys. (2020). https://doi.org/10.1063/5.0012971
Article PubMed Google Scholar
S. Golovynskyi, I. Irfan, M. Bosi, L. Seravalli, O.I. Datsenko, I. Golovynska, B. Li, D. Lin, J. Qu, Exciton and trion in few-layer MoS 2 : thickness-and temperature-dependent photoluminescence. Appl. Surf. Sci. 515 , 146033 (2020)
D. Mastrippolito, S. Palleschi, G. D’Olimpio, A. Politano, M. Nardone, P. Benassi, L. Ottaviano, Exciton–phonon coupling and power dependent room temperature photoluminescence of sulphur vacancy doped MoS 2 via controlled thermal annealing. Nanoscale 12 , 18899–18907 (2020)
T. Verhagen, V.L. Guerra, G. Haider, M. Kalbac, J. Vejpravova, Towards the evaluation of defects in MoS 2 using cryogenic photoluminescence spectroscopy. Nanoscale 12 , 3019–3028 (2020)
J.-S. Yu, J.-J. Hwang, J.-Y. Lee, D.H. Ha, J.-H. Kim, Tuning photoluminescence spectra of MoS 2 with liquid crystals. Nanoscale 13 , 16641–16648 (2021)
H.C. Foley, Introduction to chemical engineering analysis using mathematica: for chemists biotechnologists and materials scientists (Academic Press, 2021)
Google Scholar
M. Sayraç, Computation of refractive index values of inert gases at near infrared and XUV region based on mathematica software. Adıyaman Univ. J. Sci. 11 , 48–58 (2021)
P. Taank, R. Karmakar, R. Sharma, R.K. Yadav, M. Shrivastava, N.C. Maurya, T.K. Maji, D. Karmakar, K.V. Adarsh, An insightful picture of multi-particle recombination in few-layer MoS 2 nanosheets. J. Phys. Chem. C 126 , 416–422 (2022)
M.D. Haque, M.H. Ali, M.F. Rahman, A.Z.M.T. Islam, Numerical analysis for the efficiency enhancement of MoS 2 solar cell: a simulation approach by SCAPS-1D. Opt. Mater. 131 , 112678 (2022)
Y.R. Farah, Accessing molecular structure and dynamics of photoelectrochemical systems with nonlinear optical spectroscopy, Colorado State University, (2022)
A. Zarnescu, Mathematical problems of nematic liquid crystals: between dynamical and stationary problems. Phil. Trans. R. Soc. A 379 (2201), 20200432 (2021)
S. Pandey, Effect of temperature, concentration of precursors and distance between precursors on the synthesis of molybdenum disulfide (MoS 2 ) using chemical vapor deposition (CVD) technique-CVD grown monolayer MoS 2 based RRAM, Delhi Technological University, (2021)
Download references
The authors have not disclosed any funding.
Author information
Authors and affiliations.
Department of Physics, Lahore University of Management and Science (LUMS), Lahore, 54792, Pakistan
Muhammad Kashif
Department of U.S. Pakistan Center for Advance Studies in Energy, National University of Science and Technology, Islamabad, 44000, Pakistan
Altamash Shabbir
You can also search for this author in PubMed Google Scholar
Contributions
M. Kashif contributed to the manuscript writing, and literature review, and conducted experimental and modeling for the research. Altamash Shabbir contributed to the manuscript writing, literature review, and Modeling Design and critically reviewed and revised the work. Both authors actively participated in the research process and contributed to the development and completion of the study.
Corresponding author
Correspondence to Altamash Shabbir .
Ethics declarations
Competing interest.
The authors declare that they have no personal or financial interests that may have influenced the research conducted in this study.
Additional information
Publisher's note.
Springer Nature remains neutral with regard to jurisdictional claims in published maps and institutional affiliations.
Rights and permissions
Springer Nature or its licensor (e.g. a society or other partner) holds exclusive rights to this article under a publishing agreement with the author(s) or other rightsholder(s); author self-archiving of the accepted manuscript version of this article is solely governed by the terms of such publishing agreement and applicable law.
Reprints and permissions
About this article
Kashif, M., Shabbir, A. Electric field-induced changes in photoluminescence and Raman spectra of MoS 2 on PVA-coated conductive substrate with nematic liquid crystals: a combined numerical and experimental study. J Mater Sci: Mater Electron 35 , 954 (2024). https://doi.org/10.1007/s10854-024-12714-1
Download citation
Received : 28 September 2023
Accepted : 05 May 2024
Published : 13 May 2024
DOI : https://doi.org/10.1007/s10854-024-12714-1
Share this article
Anyone you share the following link with will be able to read this content:
Sorry, a shareable link is not currently available for this article.
Provided by the Springer Nature SharedIt content-sharing initiative
- Find a journal
- Publish with us
- Track your research
Want to create or adapt books like this? Learn more about how Pressbooks supports open publishing practices.
10 Experimental research
Experimental research—often considered to be the ‘gold standard’ in research designs—is one of the most rigorous of all research designs. In this design, one or more independent variables are manipulated by the researcher (as treatments), subjects are randomly assigned to different treatment levels (random assignment), and the results of the treatments on outcomes (dependent variables) are observed. The unique strength of experimental research is its internal validity (causality) due to its ability to link cause and effect through treatment manipulation, while controlling for the spurious effect of extraneous variable.
Experimental research is best suited for explanatory research—rather than for descriptive or exploratory research—where the goal of the study is to examine cause-effect relationships. It also works well for research that involves a relatively limited and well-defined set of independent variables that can either be manipulated or controlled. Experimental research can be conducted in laboratory or field settings. Laboratory experiments , conducted in laboratory (artificial) settings, tend to be high in internal validity, but this comes at the cost of low external validity (generalisability), because the artificial (laboratory) setting in which the study is conducted may not reflect the real world. Field experiments are conducted in field settings such as in a real organisation, and are high in both internal and external validity. But such experiments are relatively rare, because of the difficulties associated with manipulating treatments and controlling for extraneous effects in a field setting.
Experimental research can be grouped into two broad categories: true experimental designs and quasi-experimental designs. Both designs require treatment manipulation, but while true experiments also require random assignment, quasi-experiments do not. Sometimes, we also refer to non-experimental research, which is not really a research design, but an all-inclusive term that includes all types of research that do not employ treatment manipulation or random assignment, such as survey research, observational research, and correlational studies.
Basic concepts
Treatment and control groups. In experimental research, some subjects are administered one or more experimental stimulus called a treatment (the treatment group ) while other subjects are not given such a stimulus (the control group ). The treatment may be considered successful if subjects in the treatment group rate more favourably on outcome variables than control group subjects. Multiple levels of experimental stimulus may be administered, in which case, there may be more than one treatment group. For example, in order to test the effects of a new drug intended to treat a certain medical condition like dementia, if a sample of dementia patients is randomly divided into three groups, with the first group receiving a high dosage of the drug, the second group receiving a low dosage, and the third group receiving a placebo such as a sugar pill (control group), then the first two groups are experimental groups and the third group is a control group. After administering the drug for a period of time, if the condition of the experimental group subjects improved significantly more than the control group subjects, we can say that the drug is effective. We can also compare the conditions of the high and low dosage experimental groups to determine if the high dose is more effective than the low dose.
Treatment manipulation. Treatments are the unique feature of experimental research that sets this design apart from all other research methods. Treatment manipulation helps control for the ‘cause’ in cause-effect relationships. Naturally, the validity of experimental research depends on how well the treatment was manipulated. Treatment manipulation must be checked using pretests and pilot tests prior to the experimental study. Any measurements conducted before the treatment is administered are called pretest measures , while those conducted after the treatment are posttest measures .
Random selection and assignment. Random selection is the process of randomly drawing a sample from a population or a sampling frame. This approach is typically employed in survey research, and ensures that each unit in the population has a positive chance of being selected into the sample. Random assignment, however, is a process of randomly assigning subjects to experimental or control groups. This is a standard practice in true experimental research to ensure that treatment groups are similar (equivalent) to each other and to the control group prior to treatment administration. Random selection is related to sampling, and is therefore more closely related to the external validity (generalisability) of findings. However, random assignment is related to design, and is therefore most related to internal validity. It is possible to have both random selection and random assignment in well-designed experimental research, but quasi-experimental research involves neither random selection nor random assignment.
Threats to internal validity. Although experimental designs are considered more rigorous than other research methods in terms of the internal validity of their inferences (by virtue of their ability to control causes through treatment manipulation), they are not immune to internal validity threats. Some of these threats to internal validity are described below, within the context of a study of the impact of a special remedial math tutoring program for improving the math abilities of high school students.
History threat is the possibility that the observed effects (dependent variables) are caused by extraneous or historical events rather than by the experimental treatment. For instance, students’ post-remedial math score improvement may have been caused by their preparation for a math exam at their school, rather than the remedial math program.
Maturation threat refers to the possibility that observed effects are caused by natural maturation of subjects (e.g., a general improvement in their intellectual ability to understand complex concepts) rather than the experimental treatment.
Testing threat is a threat in pre-post designs where subjects’ posttest responses are conditioned by their pretest responses. For instance, if students remember their answers from the pretest evaluation, they may tend to repeat them in the posttest exam.
Not conducting a pretest can help avoid this threat.
Instrumentation threat , which also occurs in pre-post designs, refers to the possibility that the difference between pretest and posttest scores is not due to the remedial math program, but due to changes in the administered test, such as the posttest having a higher or lower degree of difficulty than the pretest.
Mortality threat refers to the possibility that subjects may be dropping out of the study at differential rates between the treatment and control groups due to a systematic reason, such that the dropouts were mostly students who scored low on the pretest. If the low-performing students drop out, the results of the posttest will be artificially inflated by the preponderance of high-performing students.
Regression threat —also called a regression to the mean—refers to the statistical tendency of a group’s overall performance to regress toward the mean during a posttest rather than in the anticipated direction. For instance, if subjects scored high on a pretest, they will have a tendency to score lower on the posttest (closer to the mean) because their high scores (away from the mean) during the pretest were possibly a statistical aberration. This problem tends to be more prevalent in non-random samples and when the two measures are imperfectly correlated.
Two-group experimental designs

Pretest-posttest control group design . In this design, subjects are randomly assigned to treatment and control groups, subjected to an initial (pretest) measurement of the dependent variables of interest, the treatment group is administered a treatment (representing the independent variable of interest), and the dependent variables measured again (posttest). The notation of this design is shown in Figure 10.1.

Statistical analysis of this design involves a simple analysis of variance (ANOVA) between the treatment and control groups. The pretest-posttest design handles several threats to internal validity, such as maturation, testing, and regression, since these threats can be expected to influence both treatment and control groups in a similar (random) manner. The selection threat is controlled via random assignment. However, additional threats to internal validity may exist. For instance, mortality can be a problem if there are differential dropout rates between the two groups, and the pretest measurement may bias the posttest measurement—especially if the pretest introduces unusual topics or content.
Posttest -only control group design . This design is a simpler version of the pretest-posttest design where pretest measurements are omitted. The design notation is shown in Figure 10.2.

The treatment effect is measured simply as the difference in the posttest scores between the two groups:
![\[E = (O_{1} - O_{2})\,.\]](https://usq.pressbooks.pub/app/uploads/quicklatex/quicklatex.com-90f2ce47275e7b35def5c5b52b7d7d45_l3.png "Rendered by QuickLaTeX.com")
The appropriate statistical analysis of this design is also a two-group analysis of variance (ANOVA). The simplicity of this design makes it more attractive than the pretest-posttest design in terms of internal validity. This design controls for maturation, testing, regression, selection, and pretest-posttest interaction, though the mortality threat may continue to exist.

Because the pretest measure is not a measurement of the dependent variable, but rather a covariate, the treatment effect is measured as the difference in the posttest scores between the treatment and control groups as:
Due to the presence of covariates, the right statistical analysis of this design is a two-group analysis of covariance (ANCOVA). This design has all the advantages of posttest-only design, but with internal validity due to the controlling of covariates. Covariance designs can also be extended to pretest-posttest control group design.
Factorial designs
Two-group designs are inadequate if your research requires manipulation of two or more independent variables (treatments). In such cases, you would need four or higher-group designs. Such designs, quite popular in experimental research, are commonly called factorial designs. Each independent variable in this design is called a factor , and each subdivision of a factor is called a level . Factorial designs enable the researcher to examine not only the individual effect of each treatment on the dependent variables (called main effects), but also their joint effect (called interaction effects).

In a factorial design, a main effect is said to exist if the dependent variable shows a significant difference between multiple levels of one factor, at all levels of other factors. No change in the dependent variable across factor levels is the null case (baseline), from which main effects are evaluated. In the above example, you may see a main effect of instructional type, instructional time, or both on learning outcomes. An interaction effect exists when the effect of differences in one factor depends upon the level of a second factor. In our example, if the effect of instructional type on learning outcomes is greater for three hours/week of instructional time than for one and a half hours/week, then we can say that there is an interaction effect between instructional type and instructional time on learning outcomes. Note that the presence of interaction effects dominate and make main effects irrelevant, and it is not meaningful to interpret main effects if interaction effects are significant.
Hybrid experimental designs
Hybrid designs are those that are formed by combining features of more established designs. Three such hybrid designs are randomised bocks design, Solomon four-group design, and switched replications design.
Randomised block design. This is a variation of the posttest-only or pretest-posttest control group design where the subject population can be grouped into relatively homogeneous subgroups (called blocks ) within which the experiment is replicated. For instance, if you want to replicate the same posttest-only design among university students and full-time working professionals (two homogeneous blocks), subjects in both blocks are randomly split between the treatment group (receiving the same treatment) and the control group (see Figure 10.5). The purpose of this design is to reduce the ‘noise’ or variance in data that may be attributable to differences between the blocks so that the actual effect of interest can be detected more accurately.

Solomon four-group design . In this design, the sample is divided into two treatment groups and two control groups. One treatment group and one control group receive the pretest, and the other two groups do not. This design represents a combination of posttest-only and pretest-posttest control group design, and is intended to test for the potential biasing effect of pretest measurement on posttest measures that tends to occur in pretest-posttest designs, but not in posttest-only designs. The design notation is shown in Figure 10.6.

Switched replication design . This is a two-group design implemented in two phases with three waves of measurement. The treatment group in the first phase serves as the control group in the second phase, and the control group in the first phase becomes the treatment group in the second phase, as illustrated in Figure 10.7. In other words, the original design is repeated or replicated temporally with treatment/control roles switched between the two groups. By the end of the study, all participants will have received the treatment either during the first or the second phase. This design is most feasible in organisational contexts where organisational programs (e.g., employee training) are implemented in a phased manner or are repeated at regular intervals.

Quasi-experimental designs
Quasi-experimental designs are almost identical to true experimental designs, but lacking one key ingredient: random assignment. For instance, one entire class section or one organisation is used as the treatment group, while another section of the same class or a different organisation in the same industry is used as the control group. This lack of random assignment potentially results in groups that are non-equivalent, such as one group possessing greater mastery of certain content than the other group, say by virtue of having a better teacher in a previous semester, which introduces the possibility of selection bias . Quasi-experimental designs are therefore inferior to true experimental designs in interval validity due to the presence of a variety of selection related threats such as selection-maturation threat (the treatment and control groups maturing at different rates), selection-history threat (the treatment and control groups being differentially impacted by extraneous or historical events), selection-regression threat (the treatment and control groups regressing toward the mean between pretest and posttest at different rates), selection-instrumentation threat (the treatment and control groups responding differently to the measurement), selection-testing (the treatment and control groups responding differently to the pretest), and selection-mortality (the treatment and control groups demonstrating differential dropout rates). Given these selection threats, it is generally preferable to avoid quasi-experimental designs to the greatest extent possible.

In addition, there are quite a few unique non-equivalent designs without corresponding true experimental design cousins. Some of the more useful of these designs are discussed next.
Regression discontinuity (RD) design . This is a non-equivalent pretest-posttest design where subjects are assigned to the treatment or control group based on a cut-off score on a preprogram measure. For instance, patients who are severely ill may be assigned to a treatment group to test the efficacy of a new drug or treatment protocol and those who are mildly ill are assigned to the control group. In another example, students who are lagging behind on standardised test scores may be selected for a remedial curriculum program intended to improve their performance, while those who score high on such tests are not selected from the remedial program.

Because of the use of a cut-off score, it is possible that the observed results may be a function of the cut-off score rather than the treatment, which introduces a new threat to internal validity. However, using the cut-off score also ensures that limited or costly resources are distributed to people who need them the most, rather than randomly across a population, while simultaneously allowing a quasi-experimental treatment. The control group scores in the RD design do not serve as a benchmark for comparing treatment group scores, given the systematic non-equivalence between the two groups. Rather, if there is no discontinuity between pretest and posttest scores in the control group, but such a discontinuity persists in the treatment group, then this discontinuity is viewed as evidence of the treatment effect.
Proxy pretest design . This design, shown in Figure 10.11, looks very similar to the standard NEGD (pretest-posttest) design, with one critical difference: the pretest score is collected after the treatment is administered. A typical application of this design is when a researcher is brought in to test the efficacy of a program (e.g., an educational program) after the program has already started and pretest data is not available. Under such circumstances, the best option for the researcher is often to use a different prerecorded measure, such as students’ grade point average before the start of the program, as a proxy for pretest data. A variation of the proxy pretest design is to use subjects’ posttest recollection of pretest data, which may be subject to recall bias, but nevertheless may provide a measure of perceived gain or change in the dependent variable.

Separate pretest-posttest samples design . This design is useful if it is not possible to collect pretest and posttest data from the same subjects for some reason. As shown in Figure 10.12, there are four groups in this design, but two groups come from a single non-equivalent group, while the other two groups come from a different non-equivalent group. For instance, say you want to test customer satisfaction with a new online service that is implemented in one city but not in another. In this case, customers in the first city serve as the treatment group and those in the second city constitute the control group. If it is not possible to obtain pretest and posttest measures from the same customers, you can measure customer satisfaction at one point in time, implement the new service program, and measure customer satisfaction (with a different set of customers) after the program is implemented. Customer satisfaction is also measured in the control group at the same times as in the treatment group, but without the new program implementation. The design is not particularly strong, because you cannot examine the changes in any specific customer’s satisfaction score before and after the implementation, but you can only examine average customer satisfaction scores. Despite the lower internal validity, this design may still be a useful way of collecting quasi-experimental data when pretest and posttest data is not available from the same subjects.

An interesting variation of the NEDV design is a pattern-matching NEDV design , which employs multiple outcome variables and a theory that explains how much each variable will be affected by the treatment. The researcher can then examine if the theoretical prediction is matched in actual observations. This pattern-matching technique—based on the degree of correspondence between theoretical and observed patterns—is a powerful way of alleviating internal validity concerns in the original NEDV design.

Perils of experimental research
Experimental research is one of the most difficult of research designs, and should not be taken lightly. This type of research is often best with a multitude of methodological problems. First, though experimental research requires theories for framing hypotheses for testing, much of current experimental research is atheoretical. Without theories, the hypotheses being tested tend to be ad hoc, possibly illogical, and meaningless. Second, many of the measurement instruments used in experimental research are not tested for reliability and validity, and are incomparable across studies. Consequently, results generated using such instruments are also incomparable. Third, often experimental research uses inappropriate research designs, such as irrelevant dependent variables, no interaction effects, no experimental controls, and non-equivalent stimulus across treatment groups. Findings from such studies tend to lack internal validity and are highly suspect. Fourth, the treatments (tasks) used in experimental research may be diverse, incomparable, and inconsistent across studies, and sometimes inappropriate for the subject population. For instance, undergraduate student subjects are often asked to pretend that they are marketing managers and asked to perform a complex budget allocation task in which they have no experience or expertise. The use of such inappropriate tasks, introduces new threats to internal validity (i.e., subject’s performance may be an artefact of the content or difficulty of the task setting), generates findings that are non-interpretable and meaningless, and makes integration of findings across studies impossible.
The design of proper experimental treatments is a very important task in experimental design, because the treatment is the raison d’etre of the experimental method, and must never be rushed or neglected. To design an adequate and appropriate task, researchers should use prevalidated tasks if available, conduct treatment manipulation checks to check for the adequacy of such tasks (by debriefing subjects after performing the assigned task), conduct pilot tests (repeatedly, if necessary), and if in doubt, use tasks that are simple and familiar for the respondent sample rather than tasks that are complex or unfamiliar.
In summary, this chapter introduced key concepts in the experimental design research method and introduced a variety of true experimental and quasi-experimental designs. Although these designs vary widely in internal validity, designs with less internal validity should not be overlooked and may sometimes be useful under specific circumstances and empirical contingencies.
Social Science Research: Principles, Methods and Practices (Revised edition) Copyright © 2019 by Anol Bhattacherjee is licensed under a Creative Commons Attribution-NonCommercial-ShareAlike 4.0 International License , except where otherwise noted.
Share This Book
- Open access
- Published: 09 May 2024
Effect of counseling model on diabetic women regarding sexual dysfunction: a quasi-experimental study
- Nermen Awad Atia Abdelkhaliek 1 ,
- Soad Abdelsalam Ramadan 2 ,
- Seham Shehata Ibrahim 3 ,
- Maha Ramadan Ali Mohamed 4 &
- Nour Elhoda Muhammad Elshabory 4
BMC Public Health volume 24 , Article number: 1161 ( 2024 ) Cite this article
219 Accesses
4 Altmetric
Metrics details
Complications of diabetes in women have adverse effects on their self-image, quality of life, health, and other social relationships, thereby leading to sexual dysfunction. maternity nurse care can play a critical role in assessing the knowledge about needs for sexual health.
The present study aims to evaluate the effect of the counseling model on female patients with diabetes regarding sexual dysfunction.
A quasi-experimental research design was used to conduct the study at the diabetic and obstetric outpatient clinic in 2 hospitals (Al Salam Port Said General Hospital, Elzohor General Hospital), and in five centers in Port Said City (El-Kuwait Center, Othman Ibnafan Center, El-arab 1 center, El-manakh center, El-arab2 center). A purposive sample of 178 female diabetic patients was included in the study. Two tools were used for collecting data consisted of; (1 interview questionnaire sheet) including personal characteristics, medical history, and present sexual problem of the studied female patients, (and 2 female sexual function index (FSFI).
the current study revealed that there was a high statistical difference between female sexual function in post with mean ± SD (23.3 ± 4.1) compared to pre-educational intervention with mean ± SD (19.5 ± 3.7), while there was a high statistically significant difference among pre- & post-program application regarding female sexual function index ( p > 0.001).
the counseling model had a positive effect in improving the sexual function among female patients with diabetes.
Trial Registration Number (TRN)
The study protocol was approved by the Research Ethics Committee of the Faculty of Nursing, Port Said University (code number: NUR 12/9/2021-6).
Peer Review reports
Sexual dysfunction is a common gynecological complaint among diabetic women due to its complicated effect on sexual function. Complications of diabetes in women have adverse effects on their self-image, quality of life, health, and other social relationships, thereby affecting their sexual performance [ 1 ]. Sexual dysfunction is a heterogeneous combination of disorders including abnormalities in women’s orgasm, arousal, pain, and unknown sexual dysfunction, although various studies have reported a high prevalence of sexual dysfunction in women with diabetes compared with non-diabetic women [ 2 ].
The prevalence of diabetes has risen significantly by 62% over the last ten years [ 3 ]. The International Diabetes Federation (IDF) listed Egypt among the world’s top 10 countries in the number of patients with diabetes [ 4 ] In Egypt, the prevalence of diabetes is around 15.56% among adults between 20 and 79 years of age, with an annual death of 86,478 related to diabetes [ 5 ].
Diabetes mellitus is a chronic metabolic disease characterized by insulin deficiency and resistance. The International Diabetes Federation (IDF) estimated that 7.5 million individuals have diabetes and around 2.2 million have prediabetes in Egypt. Furthermore, reports indicate that 43% of patients with diabetes and most patients with prediabetes in Egypt are likely undiagnosed. Consequently, the complications associated with the disease are also expected to increase. These include microvascular complications such as neuropathy, nephropathy, and retinopathy, and macrovascular complications such as peripheral artery disease, stroke, and cardiovascular diseases [ 6 ].
Diabetes is seen to be a risk factor for female sexual dysfunction because the normal female sexual response needs the integrity of the sensory and autonomic nervous system to respond to erotic stimuli, as well as of the vascular integrity which supplies the external genitalia and vagina which affected by hyperglycemia [ 7 ]. The main cause of sexual dysfunction in women with DM is multifactorial including biological, psychological, social, and interpersonal factors [ 8 ].
The PLISSIT model, which was described by Annon in 1974 for the first time consists of four main parts: (I) Permission (P), (II) Limited Information (LI), (III) Specific Suggestions (SS), (IV) Intensive Therapy (IT). By using the first three phases of the PLISSIT model, 80–90% of the patient’s sexual problems are solvable [ 9 ]. Education and counseling are effective in improving women’s sexual function through the provision of knowledge and problem-solving skills. Healthy lifestyles including nutrition, exercise, and sleep by controlling blood sugar levels protect a person from free radicals and indirectly affect their sexual function by regulating the body’s blood flow [ 10 ].
Maternity nurse care can play a critical role as a sex educator and sex counselor in this context. Also, she has an important role in assessing the knowledge about the needs for sexual health. Numerous frameworks are available for sexual advice that can help nurses implement appropriate and effective support strategies for intervention in the cases of sexual concerns and problems such as (ALARM, BETTER, PLEASURE, and PLISSIT). These models all take a somewhat different approach to sexual counseling [ 11 ].
Recently, evidence indicates that diabetic women are at higher risk for developing sexual dysfunction compared to those without diabetes [ 4 ]. There are several cultural and traditional hurdles to having open discussions about sexual life, especially with female health care practitioners, in Egypt, which makes it inappropriate to discuss female sexuality. Furthermore, female sexual dysfunction in diabetic patients is under-researched. It is frequently overlooked in research, with only a few studies addressing women’s sexual functioning and dysfunction in an Egyptian study [ 12 ]. Hence, this study has been conducted to improve the knowledge of female patients with diabetes regarding sexual dysfunction and be more able to solve the sexual dysfunction problem.
This study aims to evaluate the effect of the counseling model on female patients with diabetes regarding sexual dysfunction.
Research hypothesis
Null hypothesis (h0).
there is no significant difference in the ability to resolve sexual dysfunction among diabetic women who receive counseling sessions compared to those who do not.
Alternative hypothesis (H1)
: diabetic women who receive counseling sessions demonstrate a greater ability to resolve sexual dysfunction compared to those who do not.
Research design
A Quasi-experimental research design (pre and post-test) was utilized to meet the aim of this study.
Study setting
The current study was conducted at the diabetic and obstetric outpatient clinic in 2 hospitals (Al-Salam General Hospital, and El-zohor Central Hospital) and five centers affiliated the Health Insurance in Port Said City. These centers were selected randomly from twenty primary health care centers representing the five districts of Port Said according to the capacity of centers and registered cases namely (El-kwait Center, Othman Center, El-arab 1 Center, El-manakh Center, and El-arab2 Center).
Study subjects
A purposive sample with total no. 178 women were included in the study according to the following criteria. A sample size of women was calculated according to the equation of Daniel (1999). Biostatistics: A foundation for Analysis in the Health Sciences. 7th edition. New York: John Wiley & Sons.
Where, N = total population (400); Z, Class standard corresponding to the level of significance equal to 0.95 and 1.96; D = error percentage (= 0.05); P = Ratio provides a neutral property = 0.50. Therefore,
The estimated sample size is 162, after adding the (10%) to avoid dropping out and/or incomplete responses or withdrawal, the final number for the sample size will be = 162 + 16 = 178.
Inclusion criteria
Married women who were diagnosed with diabetes with sexual dysfunction.
Age 18–45 years.
No pregnancy.
No medical or obstetric disease except diabetes.
Tools for data collection
Two data collection instruments were used:
A structured interviewing questionnaire
The questionnaire was developed by the researcher in Arabic language. This tool includes three parts:
Part (I): sociodemographic characteristics of the female patients : It includes data related to (age, educational level, occupation, family size, duration of marriage, residence, and body mass index).
Part (II): medical history : It includes data related to (the duration of diabetes, type of diabetic treatment, and diabetic complications).
Part (III): Present sexual problem : It includes data related to present sexual problems, its duration, circumcision, frequency of sexual intercourse, if getting help for sexual problems, and reason for not getting help.
Female sexual function index (FSFI)
This tool was developed by [ 12 ] to assess female sexual function. This scale consists of 19 items that are divided into 6 domains: [ 1 ] Desire 2 items [ 2 ], arousal 4 items [ 3 ], lubrication 4 items [ 4 ], orgasm 3 items [ 5 ], satisfaction 3 items and [ 6 ] pain 3 items. each domain was rated on a scale of 0 or 1–5 score, 0 indicates that the subject reports (having no sexual activity), 1 indicates (almost having no sexual activity), 2 indicates (a few times having sexual activity), 3 indicates (sometimes having sexual activity), 4 indicate (almost times having sexual activity) score 5 (suggestive of normal sexual activity).
Tool validity
The face and content validity of the study tools were checked by a panel of seven experts consisting of (2 professors, 1 assistant professor, and 2 lectures from the maternity, Gynecology, and Obstetrics Nursing specialties). Professors reviewed the FSFI scale for Arabic language translation, clarity, relevance, comprehensiveness, and understanding applicability. The average proportion of Content Validity Index (CVI) for items judged relevant across the seven experts = 0.86. Comments and suggestions of the jury were considered and necessary modifications, corrections, and clarifying of the items were done accordingly.
Tool reliability
The reliability of tools used in this study by the Cronbach’s alpha coefficient test to assess the internal consistency of the study tools. The internal consistency of the female sexual index was 0.91.
Pilot study
A pilot study was conducted before starting the actual data collection. The pilot study was carried out on 10% (18 women) of the total sample of diabetic female patients. These were excluded from the main study sample. The purpose of the pilot study was to test the clarity, feasibility, and applicability of the study tools and estimate the time needed to complete the tools. It also helped to find out any obstacles and problems that might interfere with the data collection process. Needed modifications were done based on the findings of the pilot study.
Ethical considerations
Approval was taken from the Research Ethics Committee of the Faculty of Nursing, Port Said University (code no. NUR 12/9/2021- 6). The purpose of the study was explained to the participants before obtaining the written consent to share in the study. A brief explanation of the study was given to assure the participants that all information obtained would be kept strictly confidential and used only for the study. Participants were informed that; they have the right to participate or withdraw from the study at any time. Code numbers instead of names of the participants were used for identification purposes. This measure ensured the participants would not be identified in the public reports.
The field of the study was conducted for eight months from the beginning of February 2022 to the end of December 2022. Data was collected 2 days a week, at the diabetic and obstetric outpatient clinic in 2 hospitals (Al Salam Port Said General Hospital, Elzohor General Hospital), and in five centers in Port Said City (El-Kuwait Center, Othman Ibnafan Center, El-arab 1 Center, El-manakh center, El-arab2 center), Average number of patients per week (6 patients). The study was carried out through the following phases:
Phase I (Assessment Phase)
in this stage, the researcher obtained official permission to carry out the study, the researcher visited the study settings and arranged with the nursing director for the actual implementation of the study. Then, the process of recruitment of the diabetic female patients according to the number of visits to the study settings. The researcher clarified the sheets of the two tools to each diabetic female patient and asked them to complete it in the waiting area. Each tool was filled in about 15 min to 30 min.
Phase II (Planning)
The counseling session for the participants was designed based on the baseline data collection. The session was conducted individually for each participant. The session aims to improve diabetic female patients’ sexual function of female patients with diabetes. The program was implemented in waiting areas in outpatient clinics by a researcher who had a master’s degree in obstetrics and gynecology and worked at a technical health institute and applied the session according to teaching strategies The counseling session was designed to cover information that contributes to success in managing diabetic illness and improving sexual function. The handout includes theoretical content and procedures for sexual dysfunction. Also, it was supplemented by photos and colors for more illustration and to help facilitate remembering knowledge. and covers the following content: introduction about diabetes, definition, risk factors, etiology, signs and symptoms, types of diabetes, the difference between hypoglycemia and hyperglycemia, complication, the effect of diabetes on sexual health, causes of relationship between diabetes and sexual health, healthy habits that increase women sexual health and uses of some herbs to enhance sexual health.
Phase III (The counseling session Implementation
In this phase counseling sessions based on the PLISSIT model were given on an individual basis, which include Permission (P), Limited Information (LI), Specific Suggestions (SS), and Intensive Therapy (IT). In the beginning, the researcher met with each diabetic female patient individually, explained the aim and procedures of the study, and invited them to participate. The patients who gave their informed consent to participate should also agree to provide their telephone numbers through which they could be contacted for follow-up. A copy of the handout was given to each patient to facilitate remembering the knowledge and practices during the explanation of the theoretical part.
The program was presented individually in clear and concise form using different teaching methods while discussing with them the rationale and the precaution for each step as small discussions, lectures, demonstrations, and re-demonstrations and appropriate teaching media as audiovisual material and real objects. At the end of the researcher’s demonstration patients were asked about any unclear steps which needed repetitions or explanation before demonstration. The researcher emphasized that this session was done for teaching purposes not for evaluation, so mistakes and forgetting were allowed and were corrected immediately by the researcher.
Phase IV (Evaluation phase)
The counseling session outcome was evaluated by using the second tool after the implementation phase for follow-up evaluation after three months. The researcher contacted patients through telephone numbers and WhatsApp applications.
Statistical design
After completion of data collection, data was organized, tabulated, and computerized in Microsoft Excel 2021, and statically analyzed. The Statistical Package for Social Science (SPSS) version 28 was used to analyze the data on a PC. Data were presented using descriptive statistics in the form of frequencies and percentages for qualitative variables and means, and standard deviations for quantitative variables. Cronbach alpha coefficient was calculated to assess the reliability of the satisfaction scale through its internal consistency. Qualitative categorical variables were compared using the chi-square test. The obtained outcomes were considered significant at p-value ≤ 0.05 and highly significant at p-value ≤ 0.001 while p-value > 0.05 was considered non-significant.
General characteristics of the studied female patients with diabetes
Table 1 shows, that 49.4% of the studied women were in the age group 29–38 years old, 47.8% of them had secondary or intermediate education, 87.6% of them had not worked and 77.3% of them were self–employed.
General characteristics of the husband
Table 2 shows that 51.1% of the studied women’s husbands were in the age group 29–38 years old, and 41.0% of them had basic education, while 60.7% of husbands had self–employed and 82.6% of husb2-dMvGHxZWaza3:and had responsibility for income. Regarding the age of marriage, 52.2% of them were married at 20–30 years old, and 70.7% of the studied women had one marriage, 46.1% of them had duration of marital life between 11 and 15 years. Also, the table revealed that 65.7% of the studied women had from 3 to 4 children, while 64.6% of them mentioned number of residents in their house was 5–6 members, and 94.4% of them had 2–3 rooms in their house.
Distribution of the studied female patients with diabetes according to their medical history
Table 3 shows that 48.3% of the studied women started their diabetes illness from one year to 5 years, 74.2% of them made regular examinations of diabetes, and 92.7% of them had type I Diabetes, 62% of them had regular diabetes. Also, 64.6% of them used insulin in treatment, and 78.7% of them have complications from diabetes and 76.4% of them suffer from chronic diseases, 55.6% of them take other medication.
Distribution of the studied female patients with diabetes according to their pregnancy history
Table 4 illustrates that, 70.8% of the studied women were pregnant 2–3 times, 68.5% of them had a range 2–3 number of births, 56.2% of them had from 1 to 3 living children and 71.9% of them were delivered by cesarian section.
Distribution of the studied female patients with diabetes according to their sexual history
Table 5 presents that, 86.0% of the studied women had no problems in sexual relations, while 36.0% of women who mentioned they had problems clarified that the problem started since than one year. Also, 60.7% of the studied women suffer from sexually transmitted diseases, and 54.5% of them have performed circumcision. The current table also illustrates that 50.6% of women had irregular intercourse time, 63.5% of them didn’t take drugs that help with sexual intercourse and 57.9% of them turn to their family when they have sexual problems.
Relation between the female sexual function index at pre and post-counseling sessions
Table 6 there was a high statistical difference between female sexual function in post with mean ± SD (23.3 ± 4.1) compared to pre-educational intervention with mean ± SD 19.5 ± 3.7.
The female sexual function index at pre and post-counseling sessions
Figure ( 1 ) presents that there were high statistically significant difference notices among pre & post-program applications regarding the female sexual function index ( p > 0.001**).

Relation between the female medical history at pre and post-counseling sessions
Table 7 there was no statistical relation between female sexual function in pre and post-program with their medical history.
A normal sex life is an important part of life and relationships. Diabetes mellitus (DM) is an important cause of sexual dysfunction both in men and women. This problem is more difficult to diagnose and treat in women than in men because of the intricacy of the female sexual response. Also, the literature is limited in addressing female sexual dysfunction (FSD) in DM, and this aspect of female health is often ignored in clinical practice in women with DM. Early screening, diagnosis, and appropriate counseling are the cornerstone for managing FSD in women with DM [ 13 ]. So, it was very necessary to shed light on this sensitive problem through the present research using the PLISSIT model to facilitate data collection & counseling to overcome the negative consequences of that problem [ 14 ]. The present study aimed to evaluate the effect of the sexual counseling model on the sexual dysfunction of women with diabetes & their sexual quality of life.
Regarding the medical history of the studied female patients, the present study shows that more than two-fifths of women with diabetes started from one year to five years, and more than two-thirds of them make regular examinations for diabetes. Regarding the type of diabetes, the majority of the women had type I Diabetes, and more than half of them had regular diabetes. Concerning the treatment of diabetes more than half of them used insulin in treatment, most of them have complications from diabetes and most of them suffered from chronic diseases. These results were supported by [ 15 ] who studied the effect of the counseling model on sexual dysfunction among women with diabetes and their sexual quality of life in Minia, and mentioned that more than one-third of the studied sample had diabetes for less than 10 years & slightly three-quarters of diabetic women had type 1 diabetes mellitus who treated by insulin only. In Egypt [ 16 ] concluded that the prevalence of sexual dysfunction is higher in type one diabetic women, compared to type two diabetes type one is more common to appear before the age of 40 years.
Regarding to pregnancy history of the studied female patients, the findings showed that most of the women had two to three times of pregnancies and more than two-thirds of them had two to three births number. Moreover, regarding the number of living children more than half of them have one to three children and most of them are cesarian. These results agreed with Gerges et al. [ 10 ] who studied sexual dysfunction in women with diabetes in Banha and revealed that more than two-thirds of the studied women had from one to three children, in contrast to the result of the current study more than two-thirds of them were delivered with Vaginal delivery mode.
Regarding the sexual history of the studied female patients, the present findings presented that the majority of the sample hadn’t problems in sexual relationships, concerning those who have sexual problems more than one-third of them mentioned the problem started since than one year ago. Regarding circumcision, more than half performed circumcision, and more than half had irregular intercourse time. This was disagreed with Ayalew [ 17 ]; Kirici, and Emel et al. [ 18 ] who revealed that sexual relation problems were correlated significantly with diabetes among the studied women. Concerning circumcision the present result agreed with Abd-elatief, Mohasib, and Mohamed [ 15 ]; and Arafa et al. [ 16 ] who reported that the majority of the sample were circumcised.
Concerning female sexual function index (FSFI) domains; the present findings confirmed that diabetic women had a significant improvement in all domains post-educational intervention compared to pre-educational intervention. This result was the same line with Abd-elatief, Mohasib & Mohamed [ 15 ] who reported that after 6 months of an educational program diabetic women had the highest mean score related to their female sexual function index domains & total mean scores of female sexual functions had a significant improvement from 23.8 pre-education to 29.9 after six months of education with P– ≤ 0.000. In the researcher point view it might be related to the lack of knowledge among women about sexual function and also regarding the fact that in Egypt the culture of the society it was shy and non-ethical to that woman for discussing this kind of knowledge. Another study by Mehrabi, Lotfi, Rahimzadeh, & Khoei [ 19 ], on 100 married women aged 35–55 years old with type 2 diabetes, reported that PLISSIT model-based sexual counseling increased all domains of sexual function, except for sexual excitement and pain.
Based on the findings of the present study, it can be concluded that
Counseling by using the PLASSIT model has affected positively female sexual function outcomes which manifested by improving the score of the female sexual function index after the implementation of the counseling model.
Implications
This can be done by Increasing women’s awareness about factors affecting sexual health and teaching them how to manage and encourage them to seek help & discuss their sexual concerns with healthcare providers. make educational programs based on the PLISSIT model for diabetic women in all available diabetic clinics or centers to improve women’s sexual function. Adopting sexual counseling based on the PLISSIT model in addressing sexual dysfunction for diabetic women with the Preparation of a secure environment in the hospital outpatient units to discuss sexual problems with women freely. Also, can Integrate the concept of sexual counseling based on the PLISSIT model in addressing sexual dysfunctions among diabetic women into undergraduate curricula of faculties of nursing and in-service educational programs for caregivers on how to deal and manage various sexual dysfunctions for diabetic women by using PLISSIT counseling model. Sexual problems should be included in the Ministry of Health and Population plan to care for diabetic women with sexual dysfunctions using the PLISSIT counseling model.
Limitation of the study
It was difficult and took more time to meet patients who met the inclusion criteria and more time to collect data and give them the counseling session individually. It was also difficult to collect information about sexual dysfunction because the patients felt embarrassed to talk about this sensitive subject.
Data availability
The datasets used and/or analysed during the current study available from the corresponding author on reasonable request.
Sulastri R, Permana I. A qualitative study of the experience of female diabetes mellitus type II with sexual diffusion. Jurnal Aisyah: Jurnal Ilmu Kesehatan. 2023;8(2):469–76.
Google Scholar
Rahmanian E, Salari N, Mohammadi M, Jalali R. Evaluation of sexual dysfunction and female sexual dysfunction indicators in women with type 2 diabetes: a systematic review and meta-analysis. Diabetol Metab Syndr. 2019;11:1–17.
Article Google Scholar
Adeyemi TM, Olatunji TL, Adetunji AE, Rehal S. Knowledge, practice, and attitude towards foot ulcers and foot care among adults living with diabetes in Tobago: a qualitative study. Int J Environ Res Public Health. 2021;18(15):8021.
Article PubMed PubMed Central Google Scholar
Gerges T, Mohamed R, Ramadan S, Afify H. Sexual dysfunction in women with diabetes: counseling intervention. J Nurs Sci Benha Univ. 2020;1(2):115–33.
Mohammed KAA. Encapsulation of cinnamon oil in whey protein counteracts the disturbances in biochemical parameters, gene expression, and histological picture of the liver and pancreas of diabetic rats. Environ Sci Pollut Res. 2020;27:2829–43.
Article CAS Google Scholar
Tuncer M, Oskay ÜY. Sexual counseling with the PLISSIT model: a systematic review. J Sex Marital Ther. 2022;48(3):309–18.
Article PubMed Google Scholar
Maiorino MI, Bellastella G, Esposito K. Diabetes and sexual disorders. Diabetes Complications, Comorbidities and Related Disorders; 2020. pp. 473–94.
Karimi-Valoujaei S, Kashi Z, Yousefi SS, Nia HS, Khani S. Non-pharmacological interventions to promote sexual function in women with type 2 diabetes. J Nurs Midwifery Sci. 2020;7(4):281.
Mashhadi Z, Irani M, Ghorbani M, Ghazanfarpour M, Nayyeri S, Ghodrati A. The effects of Counselling based on PLISSIT model on sexual dysfunction: a systematic review and Meta-analysis. Res Health Med Sci. 2022;1(2):16–29.
Masood SN, Saeed S, Lakho N, Masood Y, Rehman M, Memon S. Frequency of sexual dysfunction in women with diabetes mellitus: a cross-sectional multicenter study. J Diabetol. 2021;12(3):357–62.
Khedr NFH, Metwally NS. Effect of PLISSIT model sexual counselling on sexual function among women with diabetes. J Nurs Health Sci. 2018;7(4):34–42.
Mohamed Elhomosy S, Abdallah Elshobary M, F., ES A. Effectiveness of Nursing Intervention on Sexual Health of women undergoing direct-acting antiviral drugs for Hepatitis C Virus. Egypt J Health Care. 2022;13(3):837–48.
Reed SD, Mitchell CM, Joffe H, Cohen L, Shifren JL, Newton KM, Guthrie KA. Sexual function in women on estradiol or venlafaxine for hot flushes: a randomized controlled trial. Obstet Gynecol. 2014;124(2 0 1):233.
Article CAS PubMed PubMed Central Google Scholar
Fatima T, Miyan Z, Naeem N, Riaz M, Basit A. Foot practices in patients with type 2 diabetes: where do we stand? J Diabetol. 2020;11(1):8–12.
Ahmed M, Gad M, Al-Adlany M. (2020). Cognitive impairment and depression in patients with diabetic retinopathy. Egyptian.
Abd-elatief A, Mohasib S, Mohamed H. Effect of counseling model on sexual dysfunction among women with diabetes and their sexual quality of life. Minia Sci Nurs J. 2019;006(1):118–27. https://doi.org/10.21608/msnj.2019.187810 .
Arafa AE, Elbahrawe RS, Shawky SM, Mostafa AM, Ahmed SS, El-Houfey AA, Abbas AM. Risk factors associated with female sexual dysfunction among married women in Upper Egypt; a cross-sectional study. Int J Community Med Public Health. 2018;5:449–53.
Ayalew J. (2022). Sexual Dysfunction and Associated Factors among Women with Diabetes Mellitus Attending on Chronic Follow-up in Diabetic Clinic at University of Gondar Specialized Hospital (Doctoral dissertation, uog).
Kirici S, Emel EGE. The Effect of the PLISSIT Model on sexual functions: a systematic review. Bandırma Onyedi Eylül Üniversitesi Sağlık Bilimleri Ve Araştırmaları. Dergisi. 2021;3(3):199–207.
Mehrabi M, Lotfi R, Rahimzadeh M, Merghati Khoei E. Effectiveness of sexual counseling using PLISSIT model on sexual function of women with type 2 diabetes mellitus: results from a randomized controlled trial. Int J Diabetes Developing Ctries. 2019;39:626–32.
Download references
Acknowledgements
The authors thank and appreciate all nurses and women who participated in this study.
Open access funding is provided by The Science, Technology & Innovation Funding Authority (STDF) in cooperation with The Egyptian Knowledge Bank (EKB). The Science, Technology & Innovation Funding Authority (STDF) and The Egyptian Knowledge Bank provide open-access funding (EKB). This study was not supported by any public, private, or nonprofit funding organization.
Open access funding provided by The Science, Technology & Innovation Funding Authority (STDF) in cooperation with The Egyptian Knowledge Bank (EKB).
Author information
Authors and affiliations.
Gynecology and Obstetrics Nursing, Faculty of Nursing, Port Said University, Port Said, Egypt
Nermen Awad Atia Abdelkhaliek
Obstetric and Gynecological Nursing, Faculty of Nursing, Banha University, Banha, Egypt
Soad Abdelsalam Ramadan
Seham Shehata Ibrahim
Maha Ramadan Ali Mohamed & Nour Elhoda Muhammad Elshabory
You can also search for this author in PubMed Google Scholar
Contributions
NA planned the study and prepared the manuscript, Writing the original and final manuscript drafts, educational program training, and administration. SR Supervised, reviewed and interpreted data and the manuscript. SI Conceptualization, Methodology, and Data Curation.MR reviewed and interpreted the data and the manuscript. NE reviewed and interpreted the data and the manuscript. The author(s) read and approved the final manuscript.
Corresponding author
Correspondence to Nermen Awad Atia Abdelkhaliek .
Ethics declarations
Ethics approval and consent to participate.
All methods and procedures for this study were carried out according to relevant guidelines and regulations. The study was approved by the Research Ethics Committee (REC), Faculty of Nursing/ Port Said University with (code number: NUR 12/9/2021–6). based on the standard of the committee, Faculty of Nursing/ Por Said University, and adhered to the declaration of Helinski. An official letter containing the title and the aim of the study was sent from the Dean of the Faculty of Nursing - Port Said University to the director of each setting to obtain approval from the hospital administrator for data collection in the abovementioned settings. Informed consent for participation in the study was obtained from nurse mentors and intern nursing students after clearing out all aspects of the study. The study did not directly or indirectly expose nurses and nurse students to any diagnosis or treatment.
Consent for publication
Not applicable.
Competing interests
The authors declare no competing interests.
Additional information
Publisher’s note.
Springer Nature remains neutral with regard to jurisdictional claims in published maps and institutional affiliations.
Rights and permissions
Open Access This article is licensed under a Creative Commons Attribution 4.0 International License, which permits use, sharing, adaptation, distribution and reproduction in any medium or format, as long as you give appropriate credit to the original author(s) and the source, provide a link to the Creative Commons licence, and indicate if changes were made. The images or other third party material in this article are included in the article’s Creative Commons licence, unless indicated otherwise in a credit line to the material. If material is not included in the article’s Creative Commons licence and your intended use is not permitted by statutory regulation or exceeds the permitted use, you will need to obtain permission directly from the copyright holder. To view a copy of this licence, visit http://creativecommons.org/licenses/by/4.0/ . The Creative Commons Public Domain Dedication waiver ( http://creativecommons.org/publicdomain/zero/1.0/ ) applies to the data made available in this article, unless otherwise stated in a credit line to the data.
Reprints and permissions
About this article
Cite this article.
Abdelkhaliek, N.A.A., Ramadan, S.A., Ibrahim, S.S. et al. Effect of counseling model on diabetic women regarding sexual dysfunction: a quasi-experimental study. BMC Public Health 24 , 1161 (2024). https://doi.org/10.1186/s12889-024-18585-9
Download citation
Received : 28 November 2023
Accepted : 12 April 2024
Published : 09 May 2024
DOI : https://doi.org/10.1186/s12889-024-18585-9
Share this article
Anyone you share the following link with will be able to read this content:
Sorry, a shareable link is not currently available for this article.
Provided by the Springer Nature SharedIt content-sharing initiative
- Counseling model
- Female patients
- Sexual dysfunction
BMC Public Health
ISSN: 1471-2458
- Submission enquiries: [email protected]
- General enquiries: [email protected]
- Reference Manager
- Simple TEXT file
People also looked at
Original research article, nutrient comparisons among the noble scallops chlamys nobilis with three different shell colours to provide advices for consumers to choose high-quality food.

- 1 Guangdong Provincial Key Laboratory of Marine Biotechnology, Shantou University, Shantou, China
- 2 Mariculture Research Center for Subtropical Shellfish & Algae of Guangdong Province, Shantou, China
- 3 STU-UMT Joint Shellfish Research Laboratory, Shantou University, Shantou, China
Introduction: In aquatic animals, colors not only reflect their sensory qualities but also affect their nutritional components and market price. Noble scallop Chlamys nobilis is an importantly economical bivalve cultured in the south sea of China and renowned for its various shell colors.
Methods: In this study, the nutrient compositions were compared among golden, yellow, and brown shell colour noble scallops originating from the same population for breeding new varieties.
Results: Among three colour scallops, there is no significant difference in the content of moisture, ash, and total protein content (TPC) but significant differences in total carotenoid content (TCC), total lipid content (TLC), and amino acids (AAs) ( P < 0.05), with the TCC of the brown scallop being about 2 times lower. The yellow scallop contained the same nutrients as TCC, TLC, ∑PUFAs (including EPA and DHA), and n-3/n-6 as the golden scallop, and both were significantly higher than the brown scallop ( P < 0.05), but they had significantly lower ∑SFAs than the latter ( P < 0.05). The correlation between the nutrient indices and the shell color of scallops was 67.5%. There is a significantly positive correlation between TCC and ∑PUFAs ( P < 0.05), while a significantly negative correlation exists between TCC and ∑SFAs ( P < 0.05). More importantly, the yellow scallop had significantly higher EAAs and FAAs than the golden scallop ( P < 0.05).
Discussion: This study showed that the yellow noble scallop not only enriched in carotenoids and PUFAs but also enriched in amino acids. Therefore, the yellow scallop is more benefit to human health, which can provide high-quality food for customers.
1 Introduction
The surface colour of organisms is the most visual feature, and the difference in color often represents important differences in material composition and information ( Bolechová et al., 2019 ). As the most important high-quality protein source for human beings, the quality and nutritional values of aquatic products is significantly linked to the color, based on experience, tradition and customs ( Cai and Leung, 2022 ; He et al., 2023 ; Wang et al., 2024 ), and the color of aquatic products significantly affects their purchasing decisions ( Steine et al., 2007 ). Therefore, the body or muscle of most farmed aquatic animals are indirect or direct involving in coloration ( Sun et al., 2023 ; Ding et al., 2024 ).
The mollusk is the second Phylum in the animal Kingdom, which can not only provide crucial ecological services ( Pruden et al., 2021 ), significant economic benefits and huge amounts of high-quality protein to humans, but also provide great values of viewing and collecting for their pleasantly regular geometric shapes, striking colors and colour patterns (Evo-devo of shell colour in gastropods and bivalves). Therefore, studies on genetics in shell colors have been attended in many species ( Williams, 2017 ), especially in bivalve, such as oysters ( Wang et al., 2018 ; Han et al., 2021 ), scallops ( Zheng et al., 2013 ; Liu et al., 2015 ), mussels ( Newkirk, 1980 ; Sun et al., 2021 ), etc. With increasing attention of high quality of aquatic products, over 20 new varieties marked by colors have been bred in China since 2000. Subsequently, studies on nutrient comparison among different shell colors have also increased ( Zheng et al., 2010 ; Zhu et al., 2018 ; Tan et al., 2021 ).
The noble scallop Chlamys nobilis is an important marine bivalve, which is famous for its brilliant colors including orange/golden, yellow, orange-purple, purple, or brown, etc ( Tan et al., 2020 ). More interestingly, muscle colour in adductor and mantle of this scallop has a significantly positive correlation with the total carotenoids content (TCC), resulting in the golden and white muscle ( Zheng et al., 2010 ), as well as the shell and muscle colors can be inherited stably ( Zheng et al., 2013 ). Based on these traits, a new variety named the noble scallop “Nan’ao Golden Scallop” was bred by artificial selection in 2015 ( Zheng et al., 2015 ), and rapidly cultured in the southern sea of China for its unique features ( Tan et al., 2020 ). In recent years, a new strain with yellow shell and the same color of muscles as “Nan’ao Golden Scallop” was bred by three-generations artificial selection, however, the nutritional compositions of noble scallop with different shell colors (such as golden, yellow, and brown) are not yet compared. Therefore, to investigate the difference of nutrient compositions among noble scallops with golden, yellow, and brown shell color, the content of moisture, ash, total protein, total lipid, amino acid, fatty acid, and total carotenoids were compared. The results will provide useful information for customers to obtain high-quality food.
2 Materials and methods
2.1 experimental sample.
The golden, yellow, and brown noble scallops C. nobilis ( Figure 1 ) originated from the same population, which were collected from different stocks established in 2022. These scallops had been cultured in the same environments at the field of the Marine Biology Experimental Station of Nan’ao, Shantou University (N:23°28’38.78”, E:117°06’53.69”), China, and sea water temperature fluctuates in the range of 15-28°C with the season ( Sun et al., 2024 ). Ten adult individuals with twelve months were randomly picked from each stock in Spring 2023, respectively. The muscle tissues from adductor and mantle were sampled, mixed, weighed, and frozen in liquid nitrogen. The studies involving animals were reviewed and approved by Shantou University of ethics committee.

Figure 1 Shell and soft tissues of golden, yellow, and brown noble scallops C. nobilis . He et al., 2024.
2.2 Determination of moisture and ash
The frozen sample was first dried in a vacuum freeze-dryer (Alpha 1-2 LDplus, Germany). Then, the moisture content is determined by the formula
Next, the dried sample was placed into powder to be grinded, taking 0.1 g to place in a muffle furnace, and calcining at 800°C for 8 hours. Finally, ash was weighed and determined by the formula
2.3 Determination of total protein content and amino acids content
The 0.5 g dried sample was accurately weighed and placed in a glass tube, and the protein digestive fluid was added to react until the liquid in the tube was green and transparent. After the liquid has cooled and been transferred to a 50-mL measuring flask, adjust the volume to 50 mL by deionized water. According to the National Food Safety Standard of China (GB/T5009.5-2016), the total protein content was determined and calculated using an automatic Kjeldahl nitrogen analyzer (FOSS kjeltec-8400, Denmark).
Determination of amino acids (AAs) was according to Tan et al. (2019) . The amino acid content in the sample was analyzed according to the National Food Safety Standard of China (GB/T5009.124-2016) using a high-performance liquid chromatography and mass spectrometry (TSQ-Endura system, Thermo Fisher, USA).
2.4 Determination of total lipid content and fatty acids content
Determination of total lipid content and fatty acids content was according to Zhu et al. (2022) using a high-performance gas chromatography (Shimadzu, Japan) and a GC workstation (Shimadzu CLASS-GC10, Japan).
2.5 Determination of total carotenoid content
Determination of total carotenoid content was according to the method used by Zheng et al. (2010) using a vacuum freeze-drying (Alpha 1-2 LDplus, Germany) and an UV-Vis recording spectrophotometer (UV-2501PC, Shimadzu, Japan).
2.6 Statistical analysis
All data in this study were expressed as the mean ± standard deviation (SD), and the data follows a normal distribution. ANOVA and multiple comparisons were completed, and Pearson correlation and PCA analysis were performed on all nutritional indicators. The PCA was analyzed using the Omicshare data processing platform developed by GENE DENOVO ( https://www.omicshare.com ), with default parameters. All statistical analyses were performed on the Statistical Package for the Social Sciences (SPSS, vision 26.0) and significance for all analyses was set to P < 0.05 unless noted otherwise.
3.1 Proximate compositions
Proximate compositions including moisture, ash, TPC, and TLC of golden, yellow, and brown scallops are listed in Table 1 . No significant difference in moisture, ash, and TPC existed among three scallops, but both golden and yellow scallops had significantly higher TLC than brown one ( P < 0.05).

Table 1 Comparison of proximate compositions among golden, yellow, and brown noble scallops C. nobilis .
3.2 Total carotenoid content
The golden and yellow scallops were both had significantly higher TCC than the brown scallop ( P < 0.05). But the golden and yellow scallops had no significant differences ( Figure 2 ).

Figure 2 Comparison of total carotenoid content (TCC) in muscle among golden, yellow, and brown noble scallops C. nobilis . The different letters indicate a significant difference ( P < 0.05). He et al., 2024.
3.3 Fatty acids
Compositions and content of FAs are listed in Table 2 . Content of 11 FAs including 3 saturated fatty acids (SFAs), 4 monounsaturated fatty acids (MUFAs), and 4 polyunsaturated fatty acids (PUFAs) were determined. There was no significant difference in ∑MUFAs among three colour scallops. However, the golden and yellow scallops had significantly lower ∑SFAs and higher ∑PUFAs than the brown one ( P < 0.05). Furthermore, the golden and yellow scallops contained significantly higher EPA and DHA, and n-3/n-6 than the brown one ( P < 0.05).

Table 2 Comparison of fatty acid contents (%) among golden, yellow, and brown noble scallops C. nobilis .
3.4 Amino acids
Totally, 17 amino acids were detected in all scallops, including seven essential amino acids (EAAs) and six flavor amino acids (FAAs) ( Table 3 ). The content of EAAs (Lys, Thr, Met, Ile, Leu, and Phe) and FAAs (Phe, Asp, Glu, Gly, and Tyr) had significant differences among three color scallops ( P < 0.05), Among them, the content of AAs in the brown scallops is the highest, followed by the yellow scallops, and the golden scallops are the lowest.

Table 3 Comparison of amino acid content (mg/g) among golden, yellow, and brown noble scallops C. nobilis .
3.5 Correlation analyses among nutritional indexes
The results of PCA showed that the correlation between nutrient indices and shell color was 67.5% (PCA1 was 47.2%, PCA2 was 20.3%), and the nutrient indices of golden and yellow scallops were similar ( Figure 3 ). Among eight nutritional indexes ( Table 4 ), significant positive correlations were found between TPC and TLC, as well as between AAs and EAAs ( P < 0.01). Additionally, there was a significant positive correlation between TCC and PUFAs, TPC and PUFAs, SFAs and AAs ( P < 0.05). However, there were significant negative correlations between SFAs and TCC ( P < 0.05), SFAs and TLC ( P < 0.05), SFAs and PUFAs ( P < 0.01).

Figure 3 PCA analysis among golden, yellow, and brown noble scallops C. nobilis . He et al., 2024.

Table 4 Correlation coefficients (r) among different nutritional components in noble scallops C. nobilis.
4 Discussion
For aquatic products, colour is the most striking feature and serves as an important reference index for people to evaluate its quality ( Zhang et al., 2024 ). For some important aquatic products, bright colors not only have unique ornamental value ( Jiang et al., 2019 ), but also have higher nutritional value ( Li et al., 2020 ). They often contain special pigments (such as carotenoids) or essential nutrients. In this study, the three different colors of scallops have the same environment and natural food supply, so it is presumed that the differences in their nutritional composition are genetically or inherited determined rather than due to environmental factors.
It is well known that carotenoids are high-potency antioxidants, crucial for human and animal health. In the present study, TCC in the golden scallop was significantly higher than the brown one, which is consistent with our previous report on the species ( Zheng et al., 2010 ). Interestingly, the yellow scallop had significantly higher TCC than the brown scallop as well. Both golden and yellow scallops enriched carotenoids in their muscles, which is the reason for their golden muscles. Moreover, TCC and muscle colors is steadily heritable in the golden and yellow noble scallops (unpublished data). Previously, a new variety of noble scallop “Nan’ao Golden Scallop” was enriched in carotenoids be bred by color ( Zheng et al., 2015 ) and widely farmed on a large scale in China ( Tan et al., 2020 ). Therefore, the yellow noble scallop is expected to breed another high-quality new variety, and worthy of further study.
Nowadays, people are paying more attention to a healthy diet. The composition and proportion of lipids in organisms are often used to assess their health status as food, particularly n-3 polyunsaturated fatty acids (n-3PUFAs), such as EPA and DHA, have received more attention ( Nettleton, 1991 ; Xiao and Ou, 2005 ; Zhang et al., 2019 ; Djuricic and Calder, 2021 ). Moreover, excessive SFAs have been regarded as harmful to human health ( Little et al., 2012 ; Karupaiah and Sundram, 2013 ). Therefore, new varieties with lower SFAs but higher PUFAs in aquatic animals are bred increasingly ( He et al., 2020 ). In this study, the golden and yellow scallops contained significantly lower ∑SFAs and higher ∑PUFAs (especially EPA and DHA) and n-3/n-6 than the brown scallops, which may be more in line with the nutritional needs of humans.
In the present study, there is a significant positive correlation between TCC and ∑PUFAs, and a significant negative correlation between TCC and ∑SFAs, which is consistent with our previous result in this species ( Tan et al., 2021 ). Studies have shown that carotenoids (such as lutein and lycopene) can regulate the lipid metabolism pathway, improve the efficiency of cell mitochondria, and accelerate fat decomposition, and regulate fat structure ( Wang et al., 2019 ; Tian et al., 2020 ; Wang et al., 2020 ; Wu et al., 2020 ), which may be the reason why the golden and yellow scallops are rich in both carotenoids and PUFAs. Actually, the new variety of noble scallop “Nanao Golden Scallop” has widely farmed in southern China and mainly occupied the market since 2015 due to its enrich in carotenoids and PUFAs. Therefore, the yellow scallops, which are also rich in TCC and PUFAs, may have the same market appeal as the “Nan’ao Golden Scallop”.
More importantly and interestingly, the yellow scallop had significantly higher EAAs and FAAs than the golden scallop. More and more studies have shown that the EAAs rich in aquatic animal food are of great benefit to human health ( Tacon and Metian, 2013 ; Norman et al., 2019 ), and the same is true for bivalve shellfish food ( Idayachandiran et al., 2014 ; Wright et al., 2018 ; Thilagavathi and Christy, 2019 ). Rich in FAAs are also an important characteristics of aquatic animal food ( Guo et al., 2019 ), especially the high content of Glu and Asp will directly improve the fresh and sweet taste ( Babarro et al., 2011 ; Karnjanapratum et al., 2013 ). In addition, carotenoids can play a role in regulating the taste of food ( Francis, 2000 ; Murillo et al., 2022 ). Therefore, the yellow scallop is more benefit to human health than the golden scallop.
Exploring marker traits with economic potential has been thought to be an important step in shellfish genetic breeding. In this study, yellow shell color, as an obviously mark in appearance, can be applied in breeding the new variety of the noble scallop. More importantly, the yellow scallop is not only richer in carotenoids and PUFAs than the brown scallop, but also richer in EAAs and FAAs than the golden scallop, which is the first time report in molluscs. We believe that the yellow scallop is more benefit to human health. It is expected that the new strain of the yellow noble scallop “Shanda Golden Scallop” will be able to be bred a new variety and provide high-quality food for customers.
Conclusions
Nutrient compositions were compared among golden, yellow, and brown shell color noble scallops originating from the same population. The correlation between the nutrient indices and the shell color of scallops was 67.5%. The golden and yellow scallops have more TCC, TLC, and PUFAs, and lower SFAs than the brown scallop. Moreover, the yellow scallop contained more AAs (including EAAs and FAAs) than golden one. Therefore, the yellow scallop is more benefit to human health, which is expected to have potential market.
Data availability statement
The raw data supporting the conclusions of this article will be made available by the authors, without undue reservation.
Ethics statement
The animal studies were approved by Shantou University of ethics committee. The studies were conducted in accordance with the local legislation and institutional requirements. Written informed consent was obtained from the owners for the participation of their animals in this study.
Author contributions
CH: Conceptualization, Data curation, Formal analysis, Methodology, Software, Writing – original draft, Investigation, Resources, Visualization. TY: Data curation, Formal analysis, Writing – original draft. JZ: Data curation, Investigation, Writing – original draft. HoZ: Funding acquisition, Writing – review & editing. YS: Data curation, Formal analysis, Writing – review & editing. CZ: Data curation, Formal analysis, Writing – original draft. XH: Data curation, Investigation, Writing – original draft. JQ: Data curation, Formal analysis, Writing – original draft. HuZ: Conceptualization, Funding acquisition, Project administration, Resources, Supervision, Writing – review & editing.
The author(s) declare financial support was received for the research, authorship, and/or publication of this article. This study was financially supported by the Department of Science and Technology of Guangdong Province, China (2021B0202020003), National Natural Science Foundation of China (32273119, 42206102), and China Agriculture Research System of MOF and MARA (CARS-49).
Conflict of interest
The authors declare that the research was conducted in the absence of any commercial or financial relationships that could be construed as a potential conflict of interest.
Publisher’s note
All claims expressed in this article are solely those of the authors and do not necessarily represent those of their affiliated organizations, or those of the publisher, the editors and the reviewers. Any product that may be evaluated in this article, or claim that may be made by its manufacturer, is not guaranteed or endorsed by the publisher.
Babarro J. M. F., Fernández reiriz M. J., Labarta U., Garrido J. L. (2011). Variability of the total free amino acid (TFAA) pool in Mytilus galloprovincialis cultured on a raft system. Effect body size. Aquac Nutri 17, e448–e458. doi: 10.1111/j.1365-2095.2010.00781.x
CrossRef Full Text | Google Scholar
Bolechová P., Chaloupková H., Hradec M., Jánová E., Doležalová J. (2019). Fur color change and hormonal development in captive females of northern white-cheeked ( Nomascus leucogenys ) and buff-cheeked ( Nomascus gabriellae ) gibbons. Gen. Comp. Endoc 282, 113210. doi: 10.1016/j.ygcen.2019.113210
Cai J. N., Leung P. S. (2022). Unlocking the potential of aquatic foods in global food security and nutrition: A missing piece under the lens of seafood liking index. Global Food Secur 33, 100641. doi: 10.1016/j.gfs.2022.100641
Ding P., Yu Y. S., Zhao Z. H., Li X., Wang X. J., Wang H. Y., et al. (2024). Behavior, intestinal health, and growth of small sea cucumbers Apostichopus japonicus in different color morphs. Mar. Env. Res. 193, 106300. doi: 10.1016/j.marenvres.2023.106300
Djuricic I., Calder P. C. (2021). Beneficial outcomes of omega-6 and omega-3 polyunsaturated fatty acids on human health: an update for 2021. Nutrients 13, 2421. doi: 10.3390/nu13072421
PubMed Abstract | CrossRef Full Text | Google Scholar
Francis F. J. (2000). Carotenoids as food colorants. Cereal Foods World 45, 198–203.
Google Scholar
Guo Q., Kong X. F., Hu C. J., Zhou B., Wang C. T., Shen Q. W. (2019). Fatty acid content, flavor compounds, and sensory quality of pork loin as affected by dietary supplementation with L-arginine and glutamic acid. J. Food Sci. 84, 3445–3453. doi: 10.1111/1750-3841.14959
Han Z. Q., Li Q., Xu C. X., Liu S. K., Yu H., Kong L. F. (2021). QTL mapping for orange shell color and sex in the Pacific oyster ( Crassostrea gigas ). Aquaculture 530, 735781. doi: 10.1016/j.aquaculture.2020.735781
He X. M., Wen Y. L., Li Z. L., Zhou Y., Hu W. J., Sun J. M., et al. (2023). Body color selection of domesticated carp ( Cyprinus carpio ) in traditional agricultural systems: Insight provided by growth performance, nutritional quality, and genetic diversity. Aquaculture 572, 739528. doi: 10.1016/j.aquaculture.2023.739528
He Z. J., Xie D. Z., Nie G. X. (2020). Comprehensive strategies for increasing n-3 highly unsaturated fatty acids content in farmed fish. Chin. J. Ani Nutri 32, 5089–5104. doi: 10.3969/j.issn.1006-267x.2020.11.015
Idayachandiran G., Muthukumar A., Kumaresan S., Balasubramanian T. (2014). Nutritional value of marine bivalve, Donax cuneatus (Linnaeus 1758) from Cuddalore coastal waters, southeast coast of India. Inventi Impact: Life Style 1, 15–19.
Jiang J. F., Nuez-Ortin W., Angell A., Zeng C. S., Nys R. D., Vucko M. J. (2019). Enhancing the coloration of the marine ornamental fish Pseudochromis fridmani using natural and synthetic sources of astaxanthin. Algal Res. 42, 101596. doi: 10.1016/j.algal.2019.101596
Karnjanapratum S., Benjakul S., Kishimura H., Tsai Y. H. (2013). Chemical compositions and nutritional value of Asian hard clam ( Meretrix lusoria ) from the coast of Andaman Sea. Food Chem. 141, 4138–4145. doi: 10.1016/j.foodchem.2013.07.001
Karupaiah T., Sundram K. (2013). Modulation of human postprandial lipemia by changing ratios of polyunsaturated to saturated (P/S) fatty acid content of blended dietary fats: a cross-over design with repeated measures. Nutri J. 12, 1–11. doi: 10.1186/1475-2891-12-122
Li Q. Q., Zu L., Cheng Y. X., Wade N. M., Liu J. G., Wu X. G. (2020). Carapace color affects carotenoid composition and nutritional quality of the Chinese mitten crab, Eriochier sinensis . LWT 126, 109286. doi: 10.1016/j.lwt.2020.109286
Little J. P., Madeira J. M., Klegeris A. (2012). The saturated fatty acid palmitate induces human monocytic cell toxicity toward neuronal cells: exploring a possible link between obesity-related metabolic impairments and neuroinflammation. J. Alzheimers Dis. 30, 179–183. doi: 10.3233/JAD-2011-111262
Liu H. L., Zheng H. P., Zhang H. K., Deng L. H., Liu W. H., Wang S. Q., et al. (2015). A de novo transcriptome of the noble scallop, Chlamys nobilis , focusing on mining transcripts for carotenoid-based coloration. BMC Genomics 16, 44. doi: 10.1186/s12864-015-1241-x
Murillo C. M. C., Rodrigues N., Dias M. I., Bermejo-Román R., Veloso A. C. A., Pereira J. A., et al. (2022). Monovarietal olive oils fortified with carotenoids: Physicochemical and sensory trends and taste sensor evaluation. J. Am. Oil Chem. Soc 99, 1113–1126. doi: 10.1002/aocs.12650
Nettleton J. (1991). Omega-3 fatty acids: Comparison of plant and seafood sources in human nutrition. J. Am. Diet Assoc. 91, 331–337. doi: 10.1016/S0002-8223(21)01118-4
Newkirk G. F. (1980). Genetics of shell color in Mytilus edulis L. and the association of growth rate with shell color. J. Exp. Mar. Biol. Ecol. 47, 89–94. doi: 10.1016/0022-0981(80)90140-9
Norman R., Crumlish M., Stetkiewicz S. (2019). The importance of fisheries and aquaculture production for nutrition and food security. Rev. Sci. Tech Oie 38, 395–407. doi: 10.20506/rst.issue.38.2.2990
Pruden M. J., Dietl G. P., Handley J. C., Smith J. A. (2021). Using molluscs to assess ecological quality status of soft-bottom habitats along the Atlantic coastline of the United States. Ecol. Indic 129, 107910. doi: 10.1016/j.ecolind.2021.107910
Steine G., Guttormsen A. G., Alfnes F., Kolstad K. (2007). Economic values for quality traits, the colour of salmon fillet. Aquaculture 272, S312–S313. doi: 10.1016/j.aquaculture.2007.07.190
Sun T. Y., He Z. R., Bai Z. Y., Zheng H. F., Li J. L. (2021). Estimates of genetic parameters and genotype-by-environment interaction for inner shell color and inner shell luster in the golden strain of the freshwater mussel Hyriopsis cumingii . Aquac Rep. 22, 100980. doi: 10.1016/j.aqrep.2021.100980
Sun W. K., Qiao L. K., Li X. T., Gu J. Y., Zhou Y. G., Wang P. (2023). The relationship between the surface color and astaxanthin concentration of different fillet parts of Atlantic salmon under mariculture and freshwater farming modes. J. Food Compos Anal. 123, 105506. doi: 10.1016/j.jfca.2023.105506
Sun Y. Z., Zhang C. X., Liu F. X., Zhang H. K., Du H., Zhang Y. H., et al. (2024). Effects of different aquaculture patterns on growth, survival and yield of diploid and triploid Portuguese oysters ( Crassostrea angulata ). Aquaculture 579, 740264. doi: 10.1016/j.aquaculture.2023.740264
Tacon A. J., Metian M. (2013). Fish matters: Importance of aquatic foods in Human nutrition and global food supply. Rev. Fish Sci. 21, 22–38. doi: 10.1080/10641262.2012.753405
Tan K. S., Leng X. M., Zhao Y., Liu H. X., Cheng D. W., Ma H. Y., et al. (2019). Amino acid variations in polymorphic noble scallops, Chlamys nobilis . J. Food Process Perserv 42, e14262. doi: 10.1111/jfpp.14262
Tan K. S., Liu H. L., Zhang H. K., Li S. K., Ma H. Y., Zheng H. P. (2021). Carotenoids content and lipid nutritional quality variation in tissues of male and female polymorphic (golden and brown) noble scallops Chlamys nobilis . Aquaculture 536, 736483. doi: 10.1016/j.aquaculture.2021.736483
Tan K. S., Zhang H. K., Lim L., Zheng H. P. (2020). Selection breeding program of Nan’ao Golden Scallop Chlamys nobilis with higher nutritional values and less susceptible to stress. Aquaculture 517, 734769. doi: 10.1016/j.aquaculture.2019.734769
Thilagavathi M., Christy P. D. A. (2019). Nutritional value of marine bivalve, Donax variabilis (Linnaeus 1758) from Porayar coastal area, Nagapattinam District Tamil Nadu India. Pramana Res. J. 9, 812–819.
Tian H. C., Liu G. B., Guo Y. Q., Li Y. K., Deng M., Liu D. W., et al. (2020). Lycopene supplementation regulates the gene expression profile and fat metabolism of breeding hens. J. Anim. Physiol. Anim. Nutri 104, 936–945. doi: 10.1111/jpn.13344
Wang J., Geng T. H., Zou Q. H., Yang N. R., Zhao W. Y., Li Y. T., et al. (2020). Lycopene prevents lipid accumulation in hepatocytes by stimulating PPARα and improving mitochondrial function. J. Funct. Foods 67, 103857. doi: 10.1016/j.jff.2020.103857
Wang J. L., Li Q., Zhong X. X., Song J. L., Kong L. F., Yu H. (2018). An integrated genetic map based on EST-SNPs and QTL analysis of shell color traits in Pacific oyster Crassostrea gigas . Aquaculture 492, 226–236. doi: 10.1016/j.aquaculture.2018.04.018
Wang N., Wang D. X., Zhou J., Luo G. (2019). Lutein prevents the excessive fat deposition in liver and abdominal tissues by activating SIRT1 and up-regulating ATGL and HSL in high fat diet rats (FS06-01-19). Curr. Dev. Nutr. 3, nzz029.FS06-01-19. doi: 10.1093/cdn/nzz029.FS06-01-19
Wang L. M., Xiong J. R., Xu C. C., Qin C. B., Zhang Y. R., Yang L. P., et al. (2024). Comparison of muscle nutritional composition, texture quality, carotenoid metabolites and transcriptome to underling muscle quality difference between wild-caught and pond-cultured Yellow River carp ( Cyprinus carpio haematopterus). Aquaculture 581, 740392. doi: 10.1016/j.aquaculture.2023.740392
Williams S. T. (2017). Molluscan shell colour. Biol. Rev. 92, 1039–1052. doi: 10.1111/brv.12268
Wright A. C., Fan Y., Baker G. (2018). Nutritional value and food safety of bivalve molluscan shellfish. J. Shellfish Res. 37, 695–708. doi: 10.2983/035.037.0403
Wu T., Gao Y. F., Hao J. Y., Geng J. T., Zhang J. J., Yin J. J., et al. (2020). Capsanthin extract prevents obesity, reduces serum tmao levels and modulates the gut microbiota composition in high-fat-diet induced obese C57BL/6J mice. Food Res. Int. 128, 108774. doi: 10.1016/j.foodres.2019.108774
Xiao M., Ou Z. Q. (2005). Research progress of the physiological function and mechanism of two kinds of fatty acid (EPA and DHA) in the fish oil of deep sea. Food Sci. 26, 522–526.
Zhang K. X., Li N., Wang Z. H., Feng D. D., Liu X. Y., Zhou D. Y., et al. (2024). Recent advances in the color of aquatic products: Evaluation methods, discoloration mechanism, and protection technologies. Food Chem. 434, 137495. doi: 10.1016/j.foodchem.2023.137495
Zhang T. T., Xu J., Wang Y. M., Xue C. H. (2019). Health benefits of dietary marine DHA/EPA-enriched glycerophospholipids. Prog. Lipid Res. 75, 100997. doi: 10.1016/j.plipres.2019.100997
Zheng H. P., Liu H. L., Chen X. Q., Zhang B., Zhang Q., Wang Y. J., et al. (2015). “A new variety of the noble scallop “Nan’ao Golden Scallop” Chlamys nobilis (Bivalve: Pectinidae) (Ed by the National Aquaculture Technique Extension Central Station of China),” in Guide for 2015 Extending Aquatic Varieties (Chin Agri Press, Beijing), 123–132.
Zheng H. P., Liu H. L., Zhang T., Wang S. Q., Sun Z. W., Liu W. H., et al. (2010). Total carotenoid differences in scallop tissues of Chlamys nobilis (Bivalve: Pectinidae) with regard to gender and shell colour. Food Chem. 122, 1164–1167. doi: 10.1016/j.foodchem.2010.03.109
Zheng H. P., Zhang T., Sun Z. W., Liu W. H., Liu H. L. (2013). Inheritance of shell colors in the noble scallop Chlamys nobilis (Bivalve: Pectinidae). Aquac Res. 44, 1229–1235. doi: 10.1111/are.2013.44.issue-8
Zhu Y. J., Li Q., Zhang J. X., Yu H., Kong L. F. (2018). Analysis and evaluation of nutrient composition in different tissues of Pacific oyster ( Crassostrea gigas ) with five shell colors. J. Fish Sci. China 25, 354–360. doi: 10.3724/SP.J.1118.2018.17198
Zhu W. L., Zhang C. X., Tan K. S., Wang B. P., Huang R. H., Wen J. H., et al. (2022). Variation of lipids and fatty acids in noble scallop Chlamys nobilis under low temperature stress. Aquaculture 554, 738121. doi: 10.1016/j.aquaculture.2022.738121
Keywords: scallop, shell colour, nutrient, carotenoids, PUFA, high-quality food
Citation: He C, Ye T, Zeng J, Zhang H, Sun Y, Zhang C, He X, Qiu J and Zheng H (2024) Nutrient comparisons among the noble scallops Chlamys nobilis with three different shell colours to provide advices for consumers to choose high-quality food. Front. Mar. Sci. 11:1395339. doi: 10.3389/fmars.2024.1395339
Received: 03 March 2024; Accepted: 24 April 2024; Published: 08 May 2024.
Reviewed by:
Copyright © 2024 He, Ye, Zeng, Zhang, Sun, Zhang, He, Qiu and Zheng. This is an open-access article distributed under the terms of the Creative Commons Attribution License (CC BY) . The use, distribution or reproduction in other forums is permitted, provided the original author(s) and the copyright owner(s) are credited and that the original publication in this journal is cited, in accordance with accepted academic practice. No use, distribution or reproduction is permitted which does not comply with these terms.
*Correspondence: Huaiping Zheng, [email protected]
IMAGES
VIDEO
COMMENTS
Examples of Experimental Research. 1. Pavlov's Dog: Classical Conditioning. Dr. Ivan Pavlov was a physiologist studying animal digestive systems in the 1890s. In one study, he presented food to a dog and then collected its salivatory juices via a tube attached to the inside of the animal's mouth.
Step 1: Define your variables. You should begin with a specific research question. We will work with two research question examples, one from health sciences and one from ecology: Example question 1: Phone use and sleep. You want to know how phone use before bedtime affects sleep patterns.
Objective To investigate whether sleep deprived people are perceived as less healthy, less attractive, and more tired than after a normal night's sleep. Design Experimental study. Setting Sleep laboratory in Stockholm, Sweden. Participants 23 healthy, sleep deprived adults (age 18-31) who were photographed and 65 untrained observers (age 18-61) who rated the photographs. Intervention ...
1) True Experimental Design. In the world of experiments, the True Experimental Design is like the superstar quarterback everyone talks about. Born out of the early 20th-century work of statisticians like Ronald A. Fisher, this design is all about control, precision, and reliability.
Based on the methods used to collect data in experimental studies, the experimental research designs are of three primary types: 1. Pre-experimental Research Design. A research study could conduct pre-experimental research design when a group or many groups are under observation after implementing factors of cause and effect of the research.
Experimental research serves as a fundamental scientific method aimed at unraveling. cause-and-effect relationships between variables across various disciplines. This. paper delineates the key ...
The experimental study design can be classified into 2 groups, that is, controlled (with comparison) ... Hence, it is more challenging in studies with a small sample size. ... Hence, while designing a research study, both the scientific validity and ethical aspects of the study will need to be thoroughly evaluated. ...
The study design used to answer a particular research question depends on the nature of the question and the availability of resources. In this article, which is the first part of a series on "study designs," we provide an overview of research study designs and their classification. The subsequent articles will focus on individual designs.
Three types of experimental designs are commonly used: 1. Independent Measures. Independent measures design, also known as between-groups, is an experimental design where different participants are used in each condition of the independent variable. This means that each condition of the experiment includes a different group of participants.
Step 1: Define your variables. You should begin with a specific research question. We will work with two research question examples, one from health sciences and one from ecology: Example question 1: Phone use and sleep. You want to know how phone use before bedtime affects sleep patterns.
The pre-experimental research design is further divided into three types. One-shot Case Study Research Design. In this type of experimental study, only one dependent group or variable is considered. The study is carried out after some treatment which was presumed to cause change, making it a posttest study.
You can also create a mixed methods research design that has elements of both. Descriptive research vs experimental research. Descriptive research gathers data without controlling any variables, while experimental research manipulates and controls variables to determine cause and effect.
Chapter 10 Experimental Research. Experimental research, often considered to be the "gold standard" in research designs, is one of the most rigorous of all research designs. In this design, one or more independent variables are manipulated by the researcher (as treatments), subjects are randomly assigned to different treatment levels ...
Experimental science is the queen of sciences and the goal of all speculation. Roger Bacon (1214-1294) Download chapter PDF. Experiments are part of the scientific method that helps to decide the fate of two or more competing hypotheses or explanations on a phenomenon. The term 'experiment' arises from Latin, Experiri, which means, 'to ...
Study, experimental, or research design is the backbone of good research. It directs the experiment by orchestrating data collection, defines the statistical analysis of the resultant data, and guides the interpretation of the results. When properly described in the written report of the experiment, it serves as a road map to readers, 1 helping ...
The classic experimental design definition is: "The methods used to collect data in experimental studies.". There are three primary types of experimental design: The way you classify research subjects based on conditions or groups determines the type of research design you should use. 01. Pre-Experimental Design.
Experimental research design is centrally concerned with constructing research that is high in causal (internal) validity. Randomized experimental designs provide the highest levels of causal validity. Quasi-experimental designs have a number of potential threats to their causal validity. Yet, new quasi-experimental designs adopted from fields ...
Here is a brief overview from the SAGE Encyclopedia of Survey Research Methods: Experimental design is one of several forms of scientific inquiry employed to identify the cause-and-effect relation between two or more variables and to assess the magnitude of the effect (s) produced. The independent variable is the experiment or treatment applied ...
The three main types of experimental research design are: 1. Pre-experimental research. A pre-experimental research study is an observational approach to performing an experiment. It's the most basic style of experimental research. Free experimental research can occur in one of these design structures: One-shot case study research design: In ...
There are three types of experiments you need to know: 1. Lab Experiment. A laboratory experiment in psychology is a research method in which the experimenter manipulates one or more independent variables and measures the effects on the dependent variable under controlled conditions. A laboratory experiment is conducted under highly controlled ...
Natural experiments are increasingly valued as a way to assess the health impact of health and non-health interventions when planned controlled experimental research designs may be infeasible or inappropriate to implement. This study sought to investigate the value of natural experiments by exploring how they have been used in practice. The study focused on obesity prevention research as one ...
For example, in a study testing the impact of different study techniques on exam scores, the independent variable might be the study method (e.g., flashcards, reading, or practice quizzes). ... Market Research. Experimental studies are crucial in market research in testing hypotheses, evaluating marketing strategies, and understanding consumer ...
The study was an experimental study by applying Post test only control group design. ... Step-by-step analysis of real research studies provides students with practical examples of how to prepare ...
A few studies have employed experimental designs to mitigate selection bias and they predominantly found detrimental effects of WFH on workers' career outcomes [12, 13, 32, 52]. These negative effects were stronger for parents than childless workers, but interestingly, they were attenuated for fathers who pursued WFH for childcare-related ...
The study employed theoretical and computational modeling of PL/Raman techniques for qualitative and quantitative analysis of the PVA-coated ITO-MoS2 sample. The utilization of Mathematica v 9.0 contributed to the accuracy and reliability of the results, ensuring robust analysis and interpretation of the experimental data.
Experimental research is best suited for explanatory research—rather than for descriptive or exploratory research—where the goal of the study is to examine cause-effect relationships. ... there may be more than one treatment group. For example, in order to test the effects of a new drug intended to treat a certain medical condition like ...
Research design. A Quasi-experimental research design (pre and post-test) was utilized to meet the aim of this study. Study setting. The current study was conducted at the diabetic and obstetric outpatient clinic in 2 hospitals (Al-Salam General Hospital, and El-zohor Central Hospital) and five centers affiliated the Health Insurance in Port Said City.
We've put together 15 real-life case study examples to inspire you. These examples cover a variety of industries and formats, plus templates to inspire you. ... Video marketing, especially in case studies, works wonders. Research shows us that 42% of people prefer video testimonials because they show real customers with real success stories ...
IntroductionIn aquatic animals, colors not only reflect their sensory qualities but also affect their nutritional components and market price. Noble scallop Chlamys nobilis is an importantly economical bivalve cultured in the south sea of China and renowned for its various shell colors.MethodsIn this study, the nutrient compositions were compared among golden, yellow, and brown shell colour ...