Hypothesis Testing Calculator Online
Hypothesis testing is a foundational method used in statistics to infer the validity of a hypothesis about a population parameter. The Hypothesis Testing Calculator facilitates this process by automating the computations necessary for the t-test , a method used to compare sample means against a hypothesized mean or against each other. Let’s delve into the formulas this calculator uses to execute one-sample and two-sample t-tests.

One-Sample t-Test
This test is used to determine if the mean (x̄) of your sample is statistically different from a hypothesized population mean (μ₀).

- t is the test statistic
- x̄ is the sample mean
- μ₀ is the hypothesized population mean
- s is the sample standard deviation
- n is the sample size (number of observations)
Two-Sample t-Test
This formula compares the means of two independent groups (x̄₁ and x̄₂), with variations for equal and unequal variances.
Equal Variances:

- x̄₁ and x̄₂ are the means of the first and second sample, respectively
- s pooled is the pooled standard deviation (calculated from both samples)
- n₁ and n₂ are the sizes of the first and second sample, respectively
Unequal Variances (Welch’s t-Test):
t = (x̄₁ – x̄₂) / (√((s₁² / n₁) + (s₂² / n₂)))
- x̄₁ is the mean of the first sample
- x̄₂ is the mean of the second sample
- s₁ and s₂ are the standard deviations of the first and second sample, respectively
Table of Critical t-Values
The following table provides critical t-values for different confidence levels and degrees of freedom which are typically use to determine the cutoff points at which the null hypothesis is reject.
These values are crucial in hypothesis testing as they help define the threshold for significance, assisting users of the calculator in interpreting their results accurately.
Consider a scenario where a school administrator wants to test if the average test score of the students this semester differs from a hypothesized mean of 70%. Using the one-sample t-test:
- Sample mean (x̄) = 74%
- Hypothesized mean (μ₀) = 70%
- Sample standard deviation (s) = 8%
- Sample size (n) = 36
Using the one-sample t-test formula:
t = (74 – 70) / (8 / √36) = (4 / 1.333) = 3.00
The calculated t-value is 3.00. Using the critical t-values table, at 95% confidence level and 35 degrees of freedom, the critical value is approximately 2.030. Since 3.00 > 2.030, the null hypothesis is reject, indicating a significant difference from the hypothesize mean.
Most Common FAQs
The p-value represents the probability of obtaining test results at least as extreme as the results observed, under the assumption that the null hypothesis is correct. A low p-value (typically below 0.05) indicates strong evidence against the null hypothesis, hence it is usually rejected.
Use a one-sample t-test when comparing the mean of a single sample to a known standard or hypothesized mean. Use a two-sample t-test when comparing the means of two independent groups to see if there is a statistically significant difference between them.
Yes, while the t-test is specifically design for means, the principles of hypothesis testing apply to other parameters such as proportions and variances. Which can also be tested using appropriate versions of hypothesis tests such as the z-test and F-test.
🚀 Upgrade Your Calculations with AI-Powered Precision!
Solve any problem in a snap with Calculatorshub Ai Calculator.
Related Calculators
PSI to ATM Calculator Online
Exponential Growth Decay Calculator Online
Microscope Resolution Calculator Online
True Position Calculator Online
Microstrip Width Calculator Online
Le Chatelier’s Principle Calculator Online
K and J Magnetics Calculator Online
Mass of Moon Calculator Online
Electrostatic Calculator Online
WKG Calculator Online
Leave a Comment Cancel reply
Save my name, email, and website in this browser for the next time I comment.
For optimal use, please visit DATAtab on your desktop PC!
Metric Variables:
Ordinal variables:, nominal variables:, hypothesis test calculator.
Do you want to calculate a hypothesis test such as a t-test , Chi Square test or an ANOVA ? You can do that easily here in the browser.

If you want to use your own data just clear the upper table
- Clear the table in the Hypothesis test calculator.
- Copy your data into the table.
- Select the variables.
In the hypothesis test calculator you can calculate e.g. a t-test, a chi-square test, a binomial test or an analysis of variance. If you need a more detailed explanation, you can find more information in the tutorials.
In order to use the hypothesis test calculator, you must first formulate your hypothesis and collect your data. DATAtab will then suggest the hypothesis test you need based on the data entered into the statistics calculator.
p value calculator
With the p value calculator you can calculate the p value for different tests. There is a wide range of methods for this. Just click on the variables you want to evaluate above and DATAtab will give you the tests you can use.
For example, if you select a metric and a categorical variable, the Independent t-Test calculator is automatically selected. If your data is not normally distributed, simply use the Mann-Whitney U-test calculator.
H0 and H1 calculator
With the h0 and h1 calculator for the different hypothesis test you can calculate the p-value which gives you an indication if you can reject the H0 or not.
Cite DATAtab: DATAtab Team (2024). DATAtab: Online Statistics Calculator. DATAtab e.U. Graz, Austria. URL https://datatab.net

Hypothesis Testing Calculator
Navigating hypothesis testing: unveiling the potential of the hypothesis testing calculator.
Embarking on the journey of statistical exploration, hypothesis testing stands out as an indispensable method for informed decision-making and drawing meaningful conclusions from data. Whether you find yourself in the academic realm, engaged in research endeavors, or navigating the professional landscape, having a trustworthy Hypothesis Testing Calculator in your statistical toolkit can prove to be a game-changer. Let’s delve into the intricacies of hypothesis testing and uncover how this calculator can be your ally in statistical analyses.
Demystifying Hypothesis Testing:
Null Hypothesis (H0): Positioned as the default assumption, the null hypothesis asserts the absence of any significant difference or effect and is commonly represented as H0.
Alternative Hypothesis (Ha): In direct contradiction to the null hypothesis, the alternative hypothesis posits the existence of a noteworthy difference or effect, denoted as Ha.
Significance Level (α): Acting as the predetermined threshold, typically set at 0.05 or 5%, the significance level plays a pivotal role in determining statistical significance. Should the calculated p-value fall below α, the null hypothesis is rejected.
p-value: Representing the likelihood of observing the results, or more extreme outcomes, under the assumption of the null hypothesis being true, a smaller p-value suggests the unlikelihood of the results occurring by chance.
Features that Define the Hypothesis Testing Calculator:
Input Parameters: The calculator demands input of sample data, selection of the test type (e.g., t-test, chi-square test), specification of null and alternative hypotheses, and determination of the significance level.
Calculations: Once armed with the requisite data and parameters, the calculator diligently executes statistical tests and computations. The output encompasses crucial details like the test statistic, degrees of freedom, and the all-important p-value.
Interpretation: Armed with the results, the calculator aids in the decision-making process, guiding whether to reject or accept the null hypothesis. An interpretation of the findings is provided, playing a pivotal role in drawing insightful conclusions.
Visual Representation: Some calculators go the extra mile by offering visual aids such as graphs or charts, facilitating a deeper understanding of data distribution and test outcomes.
Unveiling the Significance of the Hypothesis Testing Calculator:
In Scientific Research: Researchers spanning diverse fields leverage hypothesis testing to validate their hypotheses, thereby extracting meaningful insights from data.
In Quality Control: Industries rely on hypothesis testing as a quality assurance mechanism, ensuring the consistency and excellence of products and processes.
In Medical Studies: Within the realm of medical research, hypothesis testing serves as a critical tool for evaluating the effectiveness of treatments or interventions.
In Academics: Both students and educators find value in hypothesis testing as an educational tool, enabling the comprehension of statistical concepts and the conduct of experiments.
In Data-Driven Decision-Making: Businesses, keen on making decisions grounded in data, turn to hypothesis testing to navigate choices such as launching a new product based on comprehensive market research.
P-value Calculator
Statistical significance calculator to easily calculate the p-value and determine whether the difference between two proportions or means (independent groups) is statistically significant. T-test calculator & z-test calculator to compute the Z-score or T-score for inference about absolute or relative difference (percentage change, percent effect). Suitable for analysis of simple A/B tests.
Related calculators
- Using the p-value calculator
- What is "p-value" and "significance level"
- P-value formula
- Why do we need a p-value?
- How to interpret a statistically significant result / low p-value
- P-value and significance for relative difference in means or proportions
Using the p-value calculator
This statistical significance calculator allows you to perform a post-hoc statistical evaluation of a set of data when the outcome of interest is difference of two proportions (binomial data, e.g. conversion rate or event rate) or difference of two means (continuous data, e.g. height, weight, speed, time, revenue, etc.). You can use a Z-test (recommended) or a T-test to find the observed significance level (p-value statistic). The Student's T-test is recommended mostly for very small sample sizes, e.g. n < 30. In order to avoid type I error inflation which might occur with unequal variances the calculator automatically applies the Welch's T-test instead of Student's T-test if the sample sizes differ significantly or if one of them is less than 30 and the sampling ratio is different than one.
If entering proportions data, you need to know the sample sizes of the two groups as well as the number or rate of events. These can be entered as proportions (e.g. 0.10), percentages (e.g. 10%) or just raw numbers of events (e.g. 50).
If entering means data, simply copy/paste or type in the raw data, each observation separated by comma, space, new line or tab. Copy-pasting from a Google or Excel spreadsheet works fine.
The p-value calculator will output : p-value, significance level, T-score or Z-score (depending on the choice of statistical hypothesis test), degrees of freedom, and the observed difference. For means data it will also output the sample sizes, means, and pooled standard error of the mean. The p-value is for a one-sided hypothesis (one-tailed test), allowing you to infer the direction of the effect (more on one vs. two-tailed tests ). However, the probability value for the two-sided hypothesis (two-tailed p-value) is also calculated and displayed, although it should see little to no practical applications.
Warning: You must have fixed the sample size / stopping time of your experiment in advance, otherwise you will be guilty of optional stopping (fishing for significance) which will inflate the type I error of the test rendering the statistical significance level unusable. Also, you should not use this significance calculator for comparisons of more than two means or proportions, or for comparisons of two groups based on more than one metric. If a test involves more than one treatment group or more than one outcome variable you need a more advanced tool which corrects for multiple comparisons and multiple testing. This statistical calculator might help.
What is "p-value" and "significance level"
The p-value is a heavily used test statistic that quantifies the uncertainty of a given measurement, usually as a part of an experiment, medical trial, as well as in observational studies. By definition, it is inseparable from inference through a Null-Hypothesis Statistical Test (NHST) . In it we pose a null hypothesis reflecting the currently established theory or a model of the world we don't want to dismiss without solid evidence (the tested hypothesis), and an alternative hypothesis: an alternative model of the world. For example, the statistical null hypothesis could be that exposure to ultraviolet light for prolonged periods of time has positive or neutral effects regarding developing skin cancer, while the alternative hypothesis can be that it has a negative effect on development of skin cancer.
In this framework a p-value is defined as the probability of observing the result which was observed, or a more extreme one, assuming the null hypothesis is true . In notation this is expressed as:
p(x 0 ) = Pr(d(X) > d(x 0 ); H 0 )
where x 0 is the observed data (x 1 ,x 2 ...x n ), d is a special function (statistic, e.g. calculating a Z-score), X is a random sample (X 1 ,X 2 ...X n ) from the sampling distribution of the null hypothesis. This equation is used in this p-value calculator and can be visualized as such:

Therefore the p-value expresses the probability of committing a type I error : rejecting the null hypothesis if it is in fact true. See below for a full proper interpretation of the p-value statistic .
Another way to think of the p-value is as a more user-friendly expression of how many standard deviations away from the normal a given observation is. For example, in a one-tailed test of significance for a normally-distributed variable like the difference of two means, a result which is 1.6448 standard deviations away (1.6448σ) results in a p-value of 0.05.
The term "statistical significance" or "significance level" is often used in conjunction to the p-value, either to say that a result is "statistically significant", which has a specific meaning in statistical inference ( see interpretation below ), or to refer to the percentage representation the level of significance: (1 - p value), e.g. a p-value of 0.05 is equivalent to significance level of 95% (1 - 0.05 * 100). A significance level can also be expressed as a T-score or Z-score, e.g. a result would be considered significant only if the Z-score is in the critical region above 1.96 (equivalent to a p-value of 0.025).
P-value formula
There are different ways to arrive at a p-value depending on the assumption about the underlying distribution. This tool supports two such distributions: the Student's T-distribution and the normal Z-distribution (Gaussian) resulting in a T test and a Z test, respectively.
In both cases, to find the p-value start by estimating the variance and standard deviation, then derive the standard error of the mean, after which a standard score is found using the formula [2] :

X (read "X bar") is the arithmetic mean of the population baseline or the control, μ 0 is the observed mean / treatment group mean, while σ x is the standard error of the mean (SEM, or standard deviation of the error of the mean).
When calculating a p-value using the Z-distribution the formula is Φ(Z) or Φ(-Z) for lower and upper-tailed tests, respectively. Φ is the standard normal cumulative distribution function and a Z-score is computed. In this mode the tool functions as a Z score calculator.
When using the T-distribution the formula is T n (Z) or T n (-Z) for lower and upper-tailed tests, respectively. T n is the cumulative distribution function for a T-distribution with n degrees of freedom and so a T-score is computed. Selecting this mode makes the tool behave as a T test calculator.
The population standard deviation is often unknown and is thus estimated from the samples, usually from the pooled samples variance. Knowing or estimating the standard deviation is a prerequisite for using a significance calculator. Note that differences in means or proportions are normally distributed according to the Central Limit Theorem (CLT) hence a Z-score is the relevant statistic for such a test.
Why do we need a p-value?
If you are in the sciences, it is often a requirement by scientific journals. If you apply in business experiments (e.g. A/B testing) it is reported alongside confidence intervals and other estimates. However, what is the utility of p-values and by extension that of significance levels?
First, let us define the problem the p-value is intended to solve. People need to share information about the evidential strength of data that can be easily understood and easily compared between experiments. The picture below represents, albeit imperfectly, the results of two simple experiments, each ending up with the control with 10% event rate treatment group at 12% event rate.

However, it is obvious that the evidential input of the data is not the same, demonstrating that communicating just the observed proportions or their difference (effect size) is not enough to estimate and communicate the evidential strength of the experiment. In order to fully describe the evidence and associated uncertainty , several statistics need to be communicated, for example, the sample size, sample proportions and the shape of the error distribution. Their interaction is not trivial to understand, so communicating them separately makes it very difficult for one to grasp what information is present in the data. What would you infer if told that the observed proportions are 0.1 and 0.12 (e.g. conversion rate of 10% and 12%), the sample sizes are 10,000 users each, and the error distribution is binomial?
Instead of communicating several statistics, a single statistic was developed that communicates all the necessary information in one piece: the p-value . A p-value was first derived in the late 18-th century by Pierre-Simon Laplace, when he observed data about a million births that showed an excess of boys, compared to girls. Using the calculation of significance he argued that the effect was real but unexplained at the time. We know this now to be true and there are several explanations for the phenomena coming from evolutionary biology. Statistical significance calculations were formally introduced in the early 20-th century by Pearson and popularized by Sir Ronald Fisher in his work, most notably "The Design of Experiments" (1935) [1] in which p-values were featured extensively. In business settings significance levels and p-values see widespread use in process control and various business experiments (such as online A/B tests, i.e. as part of conversion rate optimization, marketing optimization, etc.).
How to interpret a statistically significant result / low p-value
Saying that a result is statistically significant means that the p-value is below the evidential threshold (significance level) decided for the statistical test before it was conducted. For example, if observing something which would only happen 1 out of 20 times if the null hypothesis is true is considered sufficient evidence to reject the null hypothesis, the threshold will be 0.05. In such case, observing a p-value of 0.025 would mean that the result is interpreted as statistically significant.
But what does that really mean? What inference can we make from seeing a result which was quite improbable if the null was true?
Observing any given low p-value can mean one of three things [3] :
- There is a true effect from the tested treatment or intervention.
- There is no true effect, but we happened to observe a rare outcome. The lower the p-value, the rarer (less likely, less probable) the outcome.
- The statistical model is invalid (does not reflect reality).
Obviously, one can't simply jump to conclusion 1.) and claim it with one hundred percent certainty, as this would go against the whole idea of the p-value and statistical significance. In order to use p-values as a part of a decision process external factors part of the experimental design process need to be considered which includes deciding on the significance level (threshold), sample size and power (power analysis), and the expected effect size, among other things. If you are happy going forward with this much (or this little) uncertainty as is indicated by the p-value calculation suggests, then you have some quantifiable guarantees related to the effect and future performance of whatever you are testing, e.g. the efficacy of a vaccine or the conversion rate of an online shopping cart.
Note that it is incorrect to state that a Z-score or a p-value obtained from any statistical significance calculator tells how likely it is that the observation is "due to chance" or conversely - how unlikely it is to observe such an outcome due to "chance alone". P-values are calculated under specified statistical models hence 'chance' can be used only in reference to that specific data generating mechanism and has a technical meaning quite different from the colloquial one. For a deeper take on the p-value meaning and interpretation, including common misinterpretations, see: definition and interpretation of the p-value in statistics .
P-value and significance for relative difference in means or proportions
When comparing two independent groups and the variable of interest is the relative (a.k.a. relative change, relative difference, percent change, percentage difference), as opposed to the absolute difference between the two means or proportions, the standard deviation of the variable is different which compels a different way of calculating p-values [5] . The need for a different statistical test is due to the fact that in calculating relative difference involves performing an additional division by a random variable: the event rate of the control during the experiment which adds more variance to the estimation and the resulting statistical significance is usually higher (the result will be less statistically significant). What this means is that p-values from a statistical hypothesis test for absolute difference in means would nominally meet the significance level, but they will be inadequate given the statistical inference for the hypothesis at hand.
In simulations I performed the difference in p-values was about 50% of nominal: a 0.05 p-value for absolute difference corresponded to probability of about 0.075 of observing the relative difference corresponding to the observed absolute difference. Therefore, if you are using p-values calculated for absolute difference when making an inference about percentage difference, you are likely reporting error rates which are about 50% of the actual, thus significantly overstating the statistical significance of your results and underestimating the uncertainty attached to them.
In short - switching from absolute to relative difference requires a different statistical hypothesis test. With this calculator you can avoid the mistake of using the wrong test simply by indicating the inference you want to make.
References
1 Fisher R.A. (1935) – "The Design of Experiments", Edinburgh: Oliver & Boyd
2 Mayo D.G., Spanos A. (2010) – "Error Statistics", in P. S. Bandyopadhyay & M. R. Forster (Eds.), Philosophy of Statistics, (7, 152–198). Handbook of the Philosophy of Science . The Netherlands: Elsevier.
3 Georgiev G.Z. (2017) "Statistical Significance in A/B Testing – a Complete Guide", [online] https://blog.analytics-toolkit.com/2017/statistical-significance-ab-testing-complete-guide/ (accessed Apr 27, 2018)
4 Mayo D.G., Spanos A. (2006) – "Severe Testing as a Basic Concept in a Neyman–Pearson Philosophy of Induction", British Society for the Philosophy of Science , 57:323-357
5 Georgiev G.Z. (2018) "Confidence Intervals & P-values for Percent Change / Relative Difference", [online] https://blog.analytics-toolkit.com/2018/confidence-intervals-p-values-percent-change-relative-difference/ (accessed May 20, 2018)
Cite this calculator & page
If you'd like to cite this online calculator resource and information as provided on the page, you can use the following citation: Georgiev G.Z., "P-value Calculator" , [online] Available at: https://www.gigacalculator.com/calculators/p-value-significance-calculator.php URL [Accessed Date: 19 May, 2024].
Our statistical calculators have been featured in scientific papers and articles published in high-profile science journals by:

The author of this tool

Statistical calculators
Two sample t test
Kruskal wallis
Pearson product moment
Two sample f test
One way anova
Bartlett test
Chi square goodness of fit
Fligner killeen
Hypothesis Test Calculator
Upload your data set below to get started
Or input your data as csv
Sharing helps us build more free tools
An open portfolio of interoperable, industry leading products
The Dotmatics digital science platform provides the first true end-to-end solution for scientific R&D, combining an enterprise data platform with the most widely used applications for data analysis, biologics, flow cytometry, chemicals innovation, and more.

Statistical analysis and graphing software for scientists
Bioinformatics, cloning, and antibody discovery software
Plan, visualize, & document core molecular biology procedures
Electronic Lab Notebook to organize, search and share data
Proteomics software for analysis of mass spec data
Modern cytometry analysis platform
Analysis, statistics, graphing and reporting of flow cytometry data
Software to optimize designs of clinical trials
T test calculator
A t test compares the means of two groups. There are several types of two sample t tests and this calculator focuses on the three most common: unpaired, welch's, and paired t tests. Directions for using the calculator are listed below, along with more information about two sample t tests and help on which is appropriate for your analysis. NOTE: This is not the same as a one sample t test; for that, you need this One sample t test calculator .
1. Choose data entry format
Caution: Changing format will erase your data.
2. Choose a test
Help me choose
3. Enter data
Help me arrange the data
4. View the results
What is a t test.
A t test is used to measure the difference between exactly two means. Its focus is on the same numeric data variable rather than counts or correlations between multiple variables. If you are taking the average of a sample of measurements, t tests are the most commonly used method to evaluate that data. It is particularly useful for small samples of less than 30 observations. For example, you might compare whether systolic blood pressure differs between a control and treated group, between men and women, or any other two groups.
This calculator uses a two-sample t test, which compares two datasets to see if their means are statistically different. That is different from a one sample t test , which compares the mean of your sample to some proposed theoretical value.
The most general formula for a t test is composed of two means (M1 and M2) and the overall standard error (SE) of the two samples:

See our video on How to Perform a Two-sample t test for an intuitive explanation of t tests and an example.
How to use the t test calculator
- Choose your data entry format . This will change how section 3 on the page looks. The first two options are for entering your data points themselves, either manually or by copy & paste. The last two are for entering the means for each group, along with the number of observations (N) and either the standard error of that mean (SEM) or standard deviation of the dataset (SD) standard error. If you have already calculated these summary statistics, the latter options will save you time.
- Choose a test from the three options: Unpaired t test, Welch's unpaired t test, or Paired t test. Use our Ultimate Guide to t tests if you are unsure which is appropriate, as it includes a section on "How do I know which t test to use?". Notice not all options are available if you enter means only.
- Enter data for the test, based on the format you chose in Step 1.
- Click Calculate Now and View the results. All options will perform a two-tailed test .
Performing t tests? We can help.
Sign up for more information on how to perform t tests and other common statistical analyses.
Common t test confusion
In addition to the number of t test options, t tests are often confused with completely different techniques as well. Here's how to keep them all straight.
Correlation and regression are used to measure how much two factors move together. While t tests are part of regression analysis, they are focused on only one factor by comparing means in different samples.
ANOVA is used for comparing means across three or more total groups. In contrast, t tests compare means between exactly two groups.
Finally, contingency tables compare counts of observations within groups rather than a calculated average. Since t tests compare means of continuous variable between groups, contingency tables use methods such as chi square instead of t tests.
Assumptions of t tests
Because there are several versions of t tests, it's important to check the assumptions to figure out which is best suited for your project. Here are our analysis checklists for unpaired t tests and paired t tests , which are the two most common. These (and the ultimate guide to t tests ) go into detail on the basic assumptions underlying any t test:
- Exactly two groups
- Sample is normally distributed
- Independent observations
- Unequal or equal variance?
- Paired or unpaired data?
Interpreting results
The three different options for t tests have slightly different interpretations, but they all hinge on hypothesis testing and P values. You need to select a significance threshold for your P value (often 0.05) before doing the test.
While P values can be easy to misinterpret , they are the most commonly used method to evaluate whether there is evidence of a difference between the sample of data collected and the null hypothesis. Once you have run the correct t test, look at the resulting P value. If the test result is less than your threshold, you have enough evidence to conclude that the data are significantly different.
If the test result is larger or equal to your threshold, you cannot conclude that there is a difference. However, you cannot conclude that there was definitively no difference either. It's possible that a dataset with more observations would have resulted in a different conclusion.
Depending on the test you run, you may see other statistics that were used to calculate the P value, including the mean difference, t statistic, degrees of freedom, and standard error. The confidence interval and a review of your dataset is given as well on the results page.
Graphing t tests
This calculator does not provide a chart or graph of t tests, however, graphing is an important part of analysis because it can help explain the results of the t test and highlight any potential outliers. See our Prism guide for some graphing tips for both unpaired and paired t tests.
Prism is built for customized, publication quality graphics and charts. For t tests we recommend simply plotting the datapoints themselves and the mean, or an estimation plot . Another popular approach is to use a violin plot, like those available in Prism.
For more information
Our ultimate guide to t tests includes examples, links, and intuitive explanations on the subject. It is quite simply the best place to start if you're looking for more about t tests!
If you enjoyed this calculator, you will love using Prism for analysis. Take a free 30-day trial to do more with your data, such as:
- Clear guidance to pick the right t test and detailed results summaries
- Custom, publication quality t test graphics, violin plots, and more
- More t test options, including normality testing as well as nested and multiple t tests
- Non-parametric test alternatives such as Wilcoxon, Mann-Whitney, and Kolmogorov-Smirnov
Check out our video on how to perform a t test in Prism , for an example from start to finish!
Remember, this page is just for two sample t tests. If you only have one sample, you need to use this calculator instead.
We Recommend:
Analyze, graph and present your scientific work easily with GraphPad Prism. No coding required.
One Sample T Test Calculator
Enter sample data, reporting results in apa style, one sample t-test, what is a one sample t-test, how to use the one sample t test calculator, calculators.
Teach yourself statistics
Bartlett's Test Calculator
Bartlett's test is used to test the assumption that variances are equal (homogeneous) across groups. For help in using this calculator, read the Frequently-Asked Questions or review the Sample Problem .
To learn more about Bartlett's test, read Stat Trek's tutorial on Bartlett's test .
- In the dropdown box, specify the number of groups.
- Enter a value in each of the unshaded textboxes.
- Click Calculate to compute outputs.
Frequently-Asked Questions
Instructions: To find the answer to a frequently-asked question, simply click on the question.
What is Bartlett's test?
Bartlett's test is used to test the assumption that variances are equal (i.e., homogeneous) across groups. The test is easy to implement and produces valid results, assuming data points within groups are randomly sampled from a normal distribution.
Because Bartlett's test is sensitive to departures from normality, a normality test is prudent. Several ways to check for departures from normality are described at: How to Test for Normality: Three Simple Tests .
Note: Unlike Hartley's Fmax test , which also tests for homogeneity, Bartlett's test does not assume equal sample sizes across groups.
How does Bartlett's test work?
Bartlett's test is an actual hypothesis test , where we examine observed data to choose between two statistical hypotheses:
H 0 : σ 2 i = σ 2 j for all groups
H 0 : σ 2 i ≠ σ 2 j for at least one pair of groups
Like many other techniques for testing hypotheses, Bartlett's test for homogeneity involves computing a test-statistic and finding the P-value for the test statistic, given degrees of freedom and significance level . If the P-value is bigger than the significance level, we accept the null hypothesis; if it is smaller, we reject the null hypothesis.
What steps (computations) are required to execute Bartlett's test?
The steps required to conduct Bartlett's test for homogeneity are detailed below:
- Step 1. Specify the significance level ( α ).
s 2 j = [ Σ ( X i, j - X j ) 2 ] / ( n j - 1 )
where X i, j is the score for observation i in Group j , X j is the mean of Group j , n j is the number of observations in Group j , and k is the number of groups.
N = Σ n i
s 2 p = [ Σ ( n j -1 ) s 2 j ] / ( N - K )
where n j is the sample size in Group j , k is the number of groups, N is the total sample size, and s 2 j is the sample variance in Group j .
A = ( N - k ) * ln( s 2 p )
B = Σ [ ( n j - 1 ) * ln( s 2 j ) ]
C = 1 / [ 3 * ( k - 1 ) ]
D = Σ [ 1 / ( n j - 1 ) - 1 / ( N - k ) ]
T = ( A - B ) / [ 1 + ( C * D ) ]
where A is the first term in the numerator of the test statistic, B is the second term in the numerator, C is the first term in the denominator , D is the second term in the denominator, and ln is the natural logarithm.
It turns out that the test statistic (T) is distributed much like a chi-square statistic with ( k-1 ) degrees of freedom. Knowing the value of T and the degrees of freedom associated with T, we can use Stat Trek's Chi-Square Calculator to find the P-value - the probability of seeing a test statistic more extreme than T.
- Step 7. Accept or reject the null hypothesis, based on P-value and significance level. If the P-value is bigger than the significance level, we accept the null hypothesis that variances are equal across groups. Otherwise, we reject the null hypothesis.
What should I enter in the field for number of groups?
Bartlett's is designed to test the hypothesis of homogeneity among nonoverlapping sets of data. The number of groups is the number of data sets under consideration.
What should I enter for significance level?
The significance level is the probability of rejecting the null hypothesis when it is true. Researchers often choose 0.05 or 0.01 for a significance level.
What should I enter for sample size?
Sample size refers to the number of observations in a group. For each group, enter the number of observations in the space provided.
Note: Unlike some other tests for homogeneity (e.g., Hartley's Fmax test ), Bartlett's test does not require equal sample sizes across groups.
What should I enter for variance?
In the fields provided, enter an estimate of sample variance for each group. To compute sample variance ( s 2 j ) for each group, use the following formula:
where X i, j is the score for observation i in Group j , X j is the mean of Group j , and n j is the number of observations in Group j .
What is degrees of freedom?
Bartlett's test computes a test statistic (T) to test for normality. The degrees of freedom ( df ) for a chi-square test of that statistic is:
where N is the total sample size across all groups, and k is the number of groups in the sample.
What is the test statistic (T)?
The test statistic (T) is the statistic used by Bartlett's test to make a decision about whether to accept or reject the null hypothesis of equal variances between groups. When T is very big, we reject the null hypothesis; when T is small, we accept the null hypothesis.
The calculator computes a T statistic, based on user inputs. The formulas that the calculator uses to compute a T statistic are given at Bartlett's Test for Homogeneity of Variance .
What is the P-value?
If you assume that the null hypothesis of equal variance is true, the P-value is the probability of seeing a test statistic (T) that is more extreme (bigger) than the actual test statistic computed from sample data.
How does the calculator test hypotheses?
Like many other techniques for testing hypotheses, Bartlett's test for homogeneity of variance involves computing a test-statistic and finding the P-value for the test statistic, given degrees of freedom and significance level .
If the P-value is bigger than the significance level, the calculator accepts the null hypothesis. Otherwise, it rejects the null hypothesis.
Sample Problems
The table below shows sample data and variance for five groups. How would you test the assumption that variances are equal across groups?
One option would be to use Stat Trek's Bartlett's Test Calculator . Simply, take the following steps:
- Enter the number of groups (5).
- Enter the significance level. For this problem, we'll use 0.05.
- For each group, enter sample size. In this example, the sample size is 5 for each group.
- For each group, enter a sample estimate of group variance.
Then, click the Calculate button to produce the output shown below:
From the calculator, we see that the test statistic (T) is 8.91505. Assuming equal variances in groups and given a significance level of 0.05, the probability of observing a test statistic (T) bigger than 8.91505 is given by the P-value. Since the P-value (0.06326) is bigger than the significance level (0.05), we cannot reject the null hypothesis of equal variances across groups.
Note: To see the hand calculations required to solve this problem, go to Bartlett's Test for Homogeneity of Variance: Example 1 .
Oops! Something went wrong.

- Calculators
- Descriptive Statistics
- Merchandise
- Which Statistics Test?
T-Test Calculator for 2 Independent Means
This simple t -test calculator, provides full details of the t-test calculation, including sample mean, sum of squares and standard deviation.
Further Information
A t -test is used when you're looking at a numerical variable - for example, height - and then comparing the averages of two separate populations or groups (e.g., males and females).
Requirements
- Two independent samples
- Data should be normally distributed
- The two samples should have the same variance
Null Hypothesis
H0: u1 - u2 = 0, where u1 is the mean of first population and u2 the mean of the second.
As above, the null hypothesis tends to be that there is no difference between the means of the two populations; or, more formally, that the difference is zero (so, for example, that there is no difference between the average heights of two populations of males and females).

Correlation Calculator
Input your values with a space or comma between in the table below
Critical Value
Results shown here
Sample size, n
Sample correlation coefficient, r, standardized sample score.

- school Campus Bookshelves
- menu_book Bookshelves
- perm_media Learning Objects
- login Login
- how_to_reg Request Instructor Account
- hub Instructor Commons
Margin Size
- Download Page (PDF)
- Download Full Book (PDF)
- Periodic Table
- Physics Constants
Scientific Calculator
- Reference & Cite
- Tools expand_more
- Readability
selected template will load here
This action is not available.
29: Hypothesis Test for a Population Proportion Calculator
- Last updated
- Save as PDF
- Page ID 8351

- Larry Green
- Lake Tahoe Community College
\( \newcommand{\vecs}[1]{\overset { \scriptstyle \rightharpoonup} {\mathbf{#1}} } \)
\( \newcommand{\vecd}[1]{\overset{-\!-\!\rightharpoonup}{\vphantom{a}\smash {#1}}} \)
\( \newcommand{\id}{\mathrm{id}}\) \( \newcommand{\Span}{\mathrm{span}}\)
( \newcommand{\kernel}{\mathrm{null}\,}\) \( \newcommand{\range}{\mathrm{range}\,}\)
\( \newcommand{\RealPart}{\mathrm{Re}}\) \( \newcommand{\ImaginaryPart}{\mathrm{Im}}\)
\( \newcommand{\Argument}{\mathrm{Arg}}\) \( \newcommand{\norm}[1]{\| #1 \|}\)
\( \newcommand{\inner}[2]{\langle #1, #2 \rangle}\)
\( \newcommand{\Span}{\mathrm{span}}\)
\( \newcommand{\id}{\mathrm{id}}\)
\( \newcommand{\kernel}{\mathrm{null}\,}\)
\( \newcommand{\range}{\mathrm{range}\,}\)
\( \newcommand{\RealPart}{\mathrm{Re}}\)
\( \newcommand{\ImaginaryPart}{\mathrm{Im}}\)
\( \newcommand{\Argument}{\mathrm{Arg}}\)
\( \newcommand{\norm}[1]{\| #1 \|}\)
\( \newcommand{\Span}{\mathrm{span}}\) \( \newcommand{\AA}{\unicode[.8,0]{x212B}}\)
\( \newcommand{\vectorA}[1]{\vec{#1}} % arrow\)
\( \newcommand{\vectorAt}[1]{\vec{\text{#1}}} % arrow\)
\( \newcommand{\vectorB}[1]{\overset { \scriptstyle \rightharpoonup} {\mathbf{#1}} } \)
\( \newcommand{\vectorC}[1]{\textbf{#1}} \)
\( \newcommand{\vectorD}[1]{\overrightarrow{#1}} \)
\( \newcommand{\vectorDt}[1]{\overrightarrow{\text{#1}}} \)
\( \newcommand{\vectE}[1]{\overset{-\!-\!\rightharpoonup}{\vphantom{a}\smash{\mathbf {#1}}}} \)
hypothesis test for a population Proportion calculator
Fill in the sample size, n, the number of successes, x, the hypothesized population proportion \(p_0\), and indicate if the test is left tailed, <, right tailed, >, or two tailed, \(\neq\). Then hit "Calculate" and the test statistic and p-Value will be calculated for you.
5 Ways to Find P-Value in Microsoft Excel
If you’re wondering how to find p-values in Excel, you’ve reached the right resource. Keep reading!
Microsoft Excel offers a little over 100 statistical analysis functions. However, you won’t find a function that says p-value. If you’re an expert in statistics and Excel you’ll know that the output of certain statistical formulas are p-values and there’s no need to create a dedicated formula named p-value.
If you’re new to statistics and Excel this article is just for you.
Determining the p-value for different types of hypothesis testing in Excel is a complicated skill. You must choose the Excel functions or tools carefully and verify if the underlying formulas align with the statistical analysis you’re doing.
In this effortless Excel tutorial, I’ll explain all popular Excel functions and tools you can use to calculate p-values in easy steps. I’ll also mention which method is suitable for which experiments of hypothesis. Furthermore, you’ll find here real-world datasets so you can easily relate to the problem at hand.
Moreover, you’ll discover advanced Excel automation techniques that enable you to find p-values more intuitively than all conventional methods.
Let’s dive in!
What Is P-Value?
Think of the p-value (the probability value) like a detective’s clue in a mystery. It tells you if the evidence (data) you have is strong enough to believe a certain idea.
For example, let’s say you have a hypothesis that eating breakfast makes you smarter. You do a study and find a p-value of 0.03 . This means there’s only a 3% chance the results are due to luck or random chance.
So, a low p-value suggests your idea might be true, like finding a strong clue in a mystery. But a high p-value , like 0.5 , means the evidence isn’t very convincing, like finding a weak clue that might not lead anywhere.
In short, the p-value helps you decide if your findings are worth believing, just like a detective uses clues to solve a case.
Find P-Value Using the T.TEST Function
The T.TEST function in Excel is a statistical function you can use to determine whether two samples are correlated. Whether it’s likely or not likely to have come from the same two underlying populations with the same mean.
It’s also known as the Student’s t-test and the function returns the probability associated ( p-value ) with the null hypothesis of your study.
The null hypothesis in which the T.TEST function be used could be as outlined below:
“ You’re assuming that there’s no significant difference between the means of the two populations from which you’ve drawn the samples. “
Scenarios where you can use this method could be:
- Medical trials to determine if a new drug treatment yields significantly different outcomes compared to a control group.
- To analyze if there’s a significant difference in customer response rates to different advertising strategies in different marketing campaigns.
- To compare the effectiveness of two training methods by analyzing the performance metrics of employees who underwent each.
Whenever you need to test if the null hypothesis mentioned above is true or not for two given lists of values as in Sample 1 and Sample 2 , you can use the T.TEST function.
Organize your input dataset as shown in the above screenshot.

Go to I2 or wherever you want to get the p-value and enter the following formula in it:

Hit Enter to calculate the p-value .
In the above formula, F2:F12 and G2:G12 are references for Sample 1 and Sample 2 . The first numeric value 2 tells Excel that you’re looking for a two-tailed distribution and the second numeric value 2 indicates that you’ve opted for a two-sample equal variance t-Test . So, customize your inputs according to the specific statistical problem you’re solving.
A higher p-value , often more than 0.05 indicates that there’s a solid ground that the null hypothesis is true. The datasets in Sample 1 and Sample 2 are related because I pulled them from two similar populations having a matching average or mean value.
However, it depends on the alpha or the level of significance you’ve chosen when starting the experiment.
Find P-Value Using the Z.TEST Function
You can use Z.TEST to calculate the p-value which is the one-tailed probability value of the following null hypothesis:
“ There’s no significant difference between the sample mean and the population mean. “
In this case, you know the mean and standard deviation of the population.
Find below some common statistical experiments where you can use the Z.TEST function:
- Analyzing the performance of students on a standardized test and determining if their average score differs significantly from the national average.
- Testing the effectiveness of a new drug treatment by comparing the average recovery time of patients to a known population average.
- Assessing whether the average wait times in two different customer service queues are statistically different from each other.

In the above dataset, I’ve drawn 11 samples from a population of 22 chocolate nutty bars. I aim to prove that the mean weight of the nuts in the population isn’t significantly different from the mean weight of nuts in the drawn sample.

I’ve also calculated the required basic statistics for the population data as shown above.

Now, I can easily find the p-value for this experiment in F6 by entering this formula:
In the above formula, you simply need to enter the cell range for the sample dataset ( C2:C12 ), the mean of the population ( F2 ), and the standard deviation of the population ( F3 ).
The p-value of this Z-test experiment is 0.677 which suggests that the null hypothesis is true.

The mean of the population and sample datasets aren’t significantly different.
Find P-Value Using the F.TEST Function
The F.TEST function helps prove whether the following null hypothesis value is true or not by generating a p-value as the output:
“ That the variances of the two populations are equal. “
If the p-value is below the significance level value or the alpha of the experiment, suppose, 0.05 , then the null hypothesis isn’t true, and vice versa.
So, when you’re comparing the variance of two samples drawn potentially from different populations you use F.TEST to calculate the p-value and not any other methods explained so far.

Using this method is too easy. Just arrange the input datasets of two different samples as shown above.

Now, use the following formula in the cell where you’d like to generate the p-value of the F-test:
You only need to enter the references of the two sample datasets in any order.
The p-value of the example dataset is 0.553 which is more than the alpha ( 0.05 ) set for the experiment. Hence, the null hypothesis is valid.
Find P-Value Using Data Analysis ToolPak
The Data Analysis ToolPak add-in allows you to find the p-value using a graphical user interface. Also, there are additional inputs you can use to refine the results. However, you must possess some previous experience in statistical data analysis to use the add-in effectively.
Using Regression

Suppose, you’ve got a dataset as shown above. Here, you’re studying if there’s any correlation between the average grades of the science subjects and that of the individual math grades.

In this problem, your null hypothesis should be as outlined below:
“ Average grades of science subjects (Math, Physics, Chemistry, & Biology) aren’t correlated to Math grades. “
You’ve aimed for an alpha or significance level 0.05 as the cut-off to determine if the null hypothesis stands or not.
Now, follow this simple Excel tutorial to activate the Data Analysis ToolPak add-in in your Excel desktop app:
📒 Read More : How to Install Data Analysis Toolpak in Microsoft Excel

If you’ve already done it, go to the Data tab and click on the Data Analysis command inside the Analysis block.

You shall see the Data Analysis dialog box.
Scroll down the scroll bar to find the Regression tool, select it, and click the OK button.

You should now see the Regression analysis configuration dialog.
Choose the dependent variable or the outcome variable that you are trying to predict or explain in the Input Y Range field. In the current exercise, it’s the Average of Science column.
Select the independent variables or predictors that are believed to influence the dependent variable in the Input X Range field. In the present example, it’s the Score in Math .
Click on the Output Range option and select a blank cell on the active worksheet. From this cell, Excel shall start printing the result of the Regression analysis.
Click OK to start the analysis.

You’ll see a Regression analysis chart as shown above. In the screenshot, I’ve highlighted the cells where you’ll find the p-value.
The p-value calculated in this example is 0.0000003 . This is far lower than the alpha value of 0.05 . It indicates that the null hypothesis doesn’t stand. There’s a correlation between the grades obtained in all the subjects of science and individual grades in math.
Using t-Test
If you wish to perform advanced t-Test on Excel you can use various t-Test tools available in the Data Analysis ToolPak add-in.
Follow the steps mentioned earlier to bring up the Data Analysis dialog.

Scroll down to find three different types of t-Tests you can choose from.
Let’s go ahead with the t-Test: Paired Two Sample for Means . Click OK to bring up the dialog box.

Enter the sample dataset ranges in the Variable 1 Range and Variable 2 Range fields.
Enter the significance level you’re aiming for in the Alpha field.
Select the Output Range and choose a cell as the destination for the results.
Click OK to perform the t-Test .
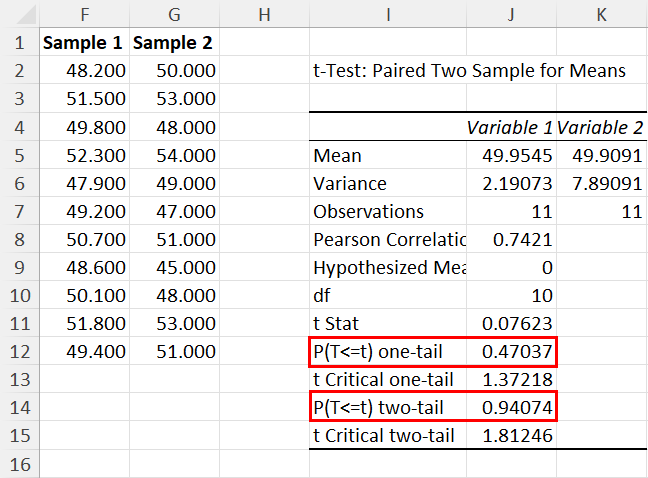
I’ve highlighted the cells in the above screenshot where you should find the p-values .
Find P-Value Using Excel VBA
Suppose, you find it challenging to remember various formula syntaxes and arguments of Excel functions. Or, you’d like to automate the task of finding the p-value using a programmatic method. In both scenarios, you can use Excel VBA.
You can create a VBA macro using the following script:

To learn the steps to create a VBA macro using a VBA script, read this Excel article now:
📒 Read More : How To Use The VBA Code You Find Online
The above script visually guides you to calculate p-values using the Z.TEST function.
You shall see the following prompts if you ruin the macro:

- Input box for the sample dataset

- Prompt for the population mean

- Input box for the population standard deviation

- Prompt for destination cell range

When you go through the above steps, Excel calculates the p-value in the selected cell.
If you wish to calculate the p-value with the t-Test, use the following script:

You just need to create a VBA macro using the above script.
Then, the VBA script input boxes shall visually guide you through the process.
⚠️ Warning : Excel VBA doesn’t allow the use of Excel undo features to revert back to the original workbook structure. So, create a backup copy of the workbook before running any VBA macros.
Conclusions
Before going through this Excel tutorial, if you thought calculating p-value in statistical analysis was a complex tax, your perception should have changed by now. So far, you must have learned that it’s pretty easy to find the p-value of a statistical experiment to disprove or establish a null hypothesis. All you need to do is follow the manual and automatic methods mentioned above.
Did the article help you to clear your doubts about p-value or probability value calculation in Excel? Comment below!
About the Author

Bipasha Nath
Subscribe for awesome Microsoft Excel videos 😃

John MacDougall
I’m John , and my goal is to help you Excel!
You’ll find a ton of awesome tips , tricks , tutorials , and templates here to help you save time and effort in your work.
- Pivot Table Tips and Tricks You Need to Know
- Everything You Need to Know About Excel Tables
- The Complete Guide to Power Query
- Introduction To Power Query M Code
- The Complete List of Keyboard Shortcuts in Microsoft Excel
- The Complete List of VBA Keyboard Shortcuts in Microsoft Excel

Related Posts

How To Find Z-Score in Excel
May 14, 2024
Learn how to find Z-score in Excel in this quick and easy-to-remember...

4 Ways to Calculate Weighted Average in Excel
Aug 14, 2023
You must be precise if you're analyzing data for actionable insights. Enter...

3 Ways to Calculate a Pearson’s Correlation Coefficient in Excel
Aug 23, 2020
Learn 3 easy ways to calculate the Pearson’s Correlation Coefficient statistic in Excel.
Submit a Comment Cancel reply
Your email address will not be published. Required fields are marked *
Save my name, email, and website in this browser for the next time I comment.
Submit Comment
This site uses Akismet to reduce spam. Learn how your comment data is processed .
Get the Latest Microsoft Excel Tips

Follow us to stay up to date with the latest in Microsoft Excel!
IMAGES
VIDEO
COMMENTS
Hypothesis Testing Calculator. The first step in hypothesis testing is to calculate the test statistic. The formula for the test statistic depends on whether the population standard deviation (σ) is known or unknown. If σ is known, our hypothesis test is known as a z test and we use the z distribution. If σ is unknown, our hypothesis test is ...
Calculation Example: There are six steps you would follow in hypothesis testing: Formulate the null and alternative hypotheses in three different ways: H 0: θ = θ 0 v e r s u s H 1: θ ≠ θ 0. H 0: θ ≤ θ 0 v e r s u s H 1: θ > θ 0. H 0: θ ≥ θ 0 v e r s u s H 1: θ < θ 0.
This t-test calculator allows you to use either the p-value approach or the critical regions approach to hypothesis testing! Enter your T-score and the number of degrees of freedom . If you don't know them, provide some data about your sample(s): sample size, mean, and standard deviation, and our t-test calculator will compute the T-score and ...
Hypothesis testing is a foundational method used in statistics to infer the validity of a hypothesis about a population parameter. The Hypothesis Testing Calculator facilitates this process by automating the computations necessary for the t-test, a method used to compare sample means against a hypothesized mean or against each other.Let's delve into the formulas this calculator uses to ...
Alternative to statistical software like SPSS and STATA. DATAtab was designed for ease of use and is a compelling alternative to statistical programs such as SPSS and STATA. On datatab.net, data can be statistically evaluated directly online and very easily (e.g. t-test, regression, correlation etc.). DATAtab's goal is to make the world of statistical data analysis as simple as possible, no ...
Copy your data into the table. Select the variables. In the hypothesis test calculator you can calculate e.g. a t-test, a chi-square test, a binomial test or an analysis of variance. If you need a more detailed explanation, you can find more information in the tutorials. In order to use the hypothesis test calculator, you must first formulate ...
Z-test examples FAQs. This Z-test calculator is a tool that helps you perform a one-sample Z-test on the population's mean. Two forms of this test - a two-tailed Z-test and a one-tailed Z-tests - exist, and can be used depending on your needs. You can also choose whether the calculator should determine the p-value from Z-test or you'd rather ...
The Hypothesis Testing Calculator emerges as a formidable ally, simplifying intricate statistical analyses and fostering data-driven decision-making. Whether you are in the midst of experimental undertakings, scrutinizing survey data, or overseeing quality control protocols, a solid understanding of hypothesis testing coupled with the use of ...
A P-value calculator is used to determine the statistical significance of an observed result in hypothesis testing. It takes as input the observed test statistic, the null hypothesis, and the relevant parameters of the statistical test (such as degrees of freedom), and computes the p-value.
Calculations: Once you input the data and parameters, the calculator performs the necessary statistical tests and calculations. It generates results such as the test statistic, degrees of freedom, and the p-value. Interpretation: Based on the results, the calculator helps you determine whether to reject or fail to reject the null hypothesis.
Powerful p-value calculator online: calculate statistical significance using a Z-test or T-test statistic (z test calculator / t-test calculator). P-value formula, Z-score formula, T-statistic formula and explanation of the inference procedure. Statistical significance for the difference between two independent groups (unpaired) - proportions (binomial) or means (non-binomial, continuous).
One sample t test: Overview. The one sample t test, also referred to as a single sample t test, is a statistical hypothesis test used to determine whether the mean calculated from sample data collected from a single group is different from a designated value specified by the researcher. This designated value does not come from the data itself ...
Hypothesis Test Calculator. Upload your data set below to get started. Upload File. Or input your data as csv. column_one,column_two,column_three 1,2,3 4,5,6 7,8,9. Submit CSV. Sharing helps us build more free tools.
A t test compares the means of two groups. There are several types of two sample t tests and this calculator focuses on the three most common: unpaired, welch's, and paired t tests. Directions for using the calculator are listed below, along with more information about two sample t tests and help on which is appropriate for your analysis. NOTE: This is not the same as a one sample t test; for ...
Single Sample T-Test Calculator. A single sample t-test (or one sample t-test) is used to compare the mean of a single sample of scores to a known or hypothetical population mean. So, for example, it could be used to determine whether the mean diastolic blood pressure of a particular group differs from 85, a value determined by a previous study.
The one-sample t-test determines if the mean of a single sample is significantly different from a known population mean. The one sample t-test calculator calculates the one sample t-test p-value and the effect size. When you enter the raw data, the one sample t-test calculator provides also the Shapiro-Wilk normality test result and the outliers.
Present the findings in your results and discussion section. Though the specific details might vary, the procedure you will use when testing a hypothesis will always follow some version of these steps. Table of contents. Step 1: State your null and alternate hypothesis. Step 2: Collect data. Step 3: Perform a statistical test.
Bartlett's test is an actual hypothesis test, where we examine observed data to choose between two statistical hypotheses: . Null hypothesis: Variance is equal across all groups. H 0: σ 2 i = σ 2 j for all groups. Alternative hypothesis: Variance is not equal across all groups. H 0: σ 2 i ≠ σ 2 j for at least one pair of groups
Sample Mean: Sample Size: Population Mean (Null Hypothesis): Population Standard Deviation: Significance Level (Alpha): Perform Test Understanding Hypothesis Testing: A Guide to the Hypothesis Testing Calculator Hypothesis testing is a crucial statistical method used to make informed decisions about data and draw conclusions. Whether you're a student, researcher, or professional, a ...
This simple t -test calculator, provides full details of the t-test calculation, including sample mean, sum of squares and standard deviation. A t -test is used when you're looking at a numerical variable - for example, height - and then comparing the averages of two separate populations or groups (e.g., males and females).
Explore math with our beautiful, free online graphing calculator. Graph functions, plot points, visualize algebraic equations, add sliders, animate graphs, and more. Z-Hypothesis Testing (stats) Save Copy. Log InorSign Up. Enter the size of the sample n, sample mean m, population standard deviation s. ...
Discover the power of statistics with our free hypothesis test for Pearson correlation coefficient (r) on two numerical data sets. Our user-friendly calculator provides accurate results to determine the strength and significance of relationships between variables. Uncover valuable insights from your data and make informed decisions with ease.
hypothesis test for a population Proportion calculator. Fill in the sample size, n, the number of successes, x, the hypothesized population proportion p0 p 0, and indicate if the test is left tailed, <, right tailed, >, or two tailed, ≠ ≠ . Then hit "Calculate" and the test statistic and p-Value will be calculated for you. n: x: p0 p 0
Just arrange the input datasets of two different samples as shown above. Calculating P-value using F.TEST. Now, use the following formula in the cell where you'd like to generate the p-value of the F-test: =F.TEST(F2:F12,G2:G12) You only need to enter the references of the two sample datasets in any order.