- Texas Go Math
- Big Ideas Math
- Engageny Math
- McGraw Hill My Math
- enVision Math
- 180 Days of Math
- Math in Focus Answer Key
- Math Expressions Answer Key
- Privacy Policy

McGraw Hill My Math Grade 3 Chapter 12 Lesson 1 Answer Key Collect and Record Data
All the solutions provided in McGraw Hill My Math Grade 3 Answer Key PDF Chapter 12 Lesson 1 Collect and Record Data will give you a clear idea of the concepts.
McGraw-Hill My Math Grade 3 Answer Key Chapter 12 Lesson 1 Collect and Record Data
Data is collected information or facts. One way to collect data is by taking a survey, or asking a lot of people a question. A frequency table or tally chart will help you record the data you collect
Math in My World

4. Write one sentence that describes your survey results. From the survey, we can say that the same number of students like pizza and peanut butter sandwich for lunch.

Guided Practice

Independent Practice
Organize each set of data in a frequency table.

Question 4. Which item was the top seller? Answer: Pencil was the top most seller among the remaning items.
Question 5. Which item sold once? Answer: Scissors was sold only once.
Question 6. How many items were sold altogether? Answer: The total number of items sold altogether were 5+8+1=14 items.
Problem Solving

How many more golden retrievers than poodles are owned by Elisa’s classmates? Answer: The number of classmates who own more golden retrievers than poodles are 3-1=2.
HOT Problems

Question 10. Building on the Essential Question What information can a tally chart and frequency table give you? Answer: Tally charts give the information of the count as a group of tallies. Each tally mark is equal to one, and the diagonal tally drawn on the group of 4 tallies is equal to the count of 5. So, we can say that the tally chart is a way of recording data in groups of five. While the frequency table gives us the total count of the number of times a value occurs, it displays the data in numbers such as 1, 2, and so on.
McGraw Hill My Math Grade 3 Chapter 12 Lesson 1 My Homework Answer Key

Question 2. Which day of the school week is the least favorite day? Answer: From the above data, we can say that Wednesday is the least favorite day of the school week.
Mathematical PRACTICE Model Math For Exercises 3-5, refer to the following information. Fillipo observed the type of pants his friends wear to school.

Question 4. How many more pairs of jeans were worn than corduroys? Answer: Number of friends who wore jeans = 6 Number of friends who wore corduroys = 4 Therefore, the total number of more people who wore jeans than corduroys will be 6-4=2
Question 5. Which type of pants was worn the most that day? Answer: From the data above, Number of friends who wore jeans = 6
Vocabulary Check

Test Practice

Leave a Comment Cancel Reply
You must be logged in to post a comment.

Collect and Record Data
Loading ad...
Lesson 1: Collect and Record Data
- Google Classroom
- Microsoft Teams
- Download PDF

Collect, sort, and organize data
Related Topics: Lesson Plans and Worksheets for Grade 1 Lesson Plans and Worksheets for all Grades More Lessons for Grade 1 Common Core For Grade 1
Eureka Math/EngageNY grade 1 module 3 lesson 10, Lesson 11 Worksheets
New York State Common Core Math Grade 1 Module 3, Lesson 10, Lesson 11 Worksheets for First Grade
Worksheets, solutions, and videos to help Grade 1 students learn how to collect, sort, and organize data, then ask and answer questions about the number of data points.
Common Core Grade 1, Module 3, Topic D: Data Interpretation
Common Core Standards: 1.OA.1, 1.MD.2, 1.MD.4
New York State Common Core Math Grade 1, Module 3, Lesson 10, Lesson 11
Lesson 10 Concept Development
Lesson 10 Concept Development and Homework
Look at the picture below. How much shorter is Trophy A than Trophy B? Students were asked about their favorite ice cream flavor. Use the data below to answer the questions.
- Write the number of students that liked each flavor in the Votes column.
- How many students chose cookie dough as the flavor they like best?
- What is the total number of students who like chocolate or strawberry the best?
- Which flavor is the least favorite?
- What is the total number of students who like cookie dough or chocolate the best? Students voted on what they like to read the most. Organize the data using tally marks and then answer the questions.
Lesson 11 Concept Development and Problem Set
Welcome to Data Day! Follow the directions to collect, organize, ask, and answer questions about data.
- Choose a question. Circle your choice.
- Pick 3 answer choices.
- Ask your classmates the question and record the data on a class list.
- Organize the data in the chart below.
Collect information about things you own. Then, organize your data like you did for the Problem Set and answer the questions.
Lesson 11 Homework

We welcome your feedback, comments and questions about this site or page. Please submit your feedback or enquiries via our Feedback page.
1: Collecting Data
Welcome to Lesson 1! In this lesson, we will be learning about collecting data. This is essentially a brief introduction to research methods. Depending on your academic major, you may also be required to take a full course in research methods after this course, which will focus on the methods used in your field. In this lesson, we'll focus on methods that are applied across many fields.
You will be introduced to a lot of the terminology that we will be using throughout the course. Because this lesson is heavy on vocabulary, many students find that making and studying from flashcards is a good strategy to apply this week.
- Identify cases and variables in a research study
- Classify variables as categorical or quantitative
- Identify explanatory and response variables in a research study
- Distinguish between a sample and a population
- Determine whether a given sample is representative of the intended population
- Identify simple random sampling and convenience sampling methods
- Use Minitab to draw a simple random sample from a known population
- Identify potential non-response and response bias
- Distinguish between experimental and observational designs
- Identify confounding variables
- Identify randomized experiments
- Determine when causal conclusions (as opposed to associations) can be made
- Classify samples as being independent or paired
- Identify control groups, placebos, and blinding in research studies and explain why each is used
1.1 - Cases & Variables
Throughout the course, we will be using many of the terms introduced in this lesson. Let's start by defining some of the most frequently used terms: case, variable, and constant.
A case is an experimental unit. These are the individuals from which data are collected. When data are collected from humans, we sometimes call them participants . When data are collected from animals, the term subjects is often used. Another synonym is experimental unit .
A variable is a characteristic that is measured and can take on different values. In other words, something that varies between cases. This is in contrast to a constant which is the same for all cases in a research study.
Let's look at a few examples.
Example: Study Time & Grades
A teacher wants to know if third grade students who spend more time reading at home get higher homework and exam grades.
The students are the cases . There are three variables : amount of time spent reading at home, homework grades, and exam grades. The grade-level of the students is a constant because all students are in the third grade.
Example: Dog Food
A researcher wants to know if dogs who are fed only canned food have different body mass indexes (BMI) than dogs who are fed only hard food. They collect BMI data from 50 dogs who eat only canned food and 50 dogs who eat only hard food.
The cases are the dogs. There are two variables : type of food and BMI. A constant would be subspecies, because all cases are domestic dogs.
Example: Age & Weight of Sea Otters
Researchers are studying the relationship between age and weight in a sample of 100 male sea otters ( Enhydra lutris ).
The 100 otters are the cases . There are two variables : age and weight. Biological sex is a constant because all subjects are male. Species is also a constant .
1.1.1 - Categorical & Quantitative Variables
Variables can be classified as categorical or quantitative . Categorical variables are those that provide groupings that may have no logical order, or a logical order with inconsistent differences between groups (e.g., the difference between 1st place and 2 second place in a race is not equivalent to the difference between 3rd place and 4th place). Quantitative variables have numerical values with consistent intervals.
Example: Weight
A team of medical researchers weigh participants in kilograms. Weight in kilograms is a quantitative variable because it takes on numerical values with meaningful magnitudes and equal intervals.
Example: Favorite Ice Cream Flavor
A teacher conducts a poll in her class. She asks her students if they would prefer chocolate, vanilla, or strawberry ice cream at their class party. Preferred ice cream flavor is a categorical variable because the different flavors are categories with no meaningful order of magnitudes.
Example: Birth Location
A survey asks “On which continent were you born?” This is a categorical variable because the different continents represent categories without a meaningful order of magnitudes.
Example: Children per Household
A census asks every household in a city how many children under the age of 18 reside there. Number of children in a household is a quantitative variable because it has a numerical value with a meaningful order and equal intervals.
Example: Highway Mile Markers
When a car breaks down on the highway, the emergency dispatcher may ask for the nearest mile marker. Highway mile marker value is a quantitative variable because it is numeric with a meaningful order of magnitudes and equal intervals.
Example: Running Distance
A runner records the distance he runs each day in miles. Distance in miles is a quantitative variable because it takes on numerical values with meaningful magnitudes and equal intervals.
Example: Highest Level of Education
A census asks residents for the highest level of education they have obtained: less than high school, high school, 2-year degree, 4-year degree, master's degree, doctoral/professional degree. This is a categorical variable . While there is a meaningful order of educational attainment, the differences between each category are not consistent. For example, the difference between high school and 2-year degree is not the same as the difference between a master's degree and a doctoral/professional degree. Because there are not equal intervals, this variable cannot be classified as quantitative.
Example: Online Courses Taught
A survey designed for online instructors asks, "How many online courses have you taught?" Three options are given: "none," "some," or "many." While there is a meaningful order of magnitudes, there are not equal intervals. This is a categorical variable .
If the survey had asked, "How many online courses have you taught? Enter a number." this would be a quantitative variable . Here, participants are answering with the number of online courses they have taught. This is a numerical value with a meaningful order of magnitudes and equal intervals.
1.1.2 - Explanatory & Response Variables
In some research studies one variable is used to predict or explain differences in another variable. In those cases, the explanatory variable is used to predict or explain differences in the response variable . In an experimental study, the explanatory variable is the variable that is manipulated by the researcher.
Also known as the independent or predictor variable , it explains variations in the response variable; in an experimental study, it is manipulated by the researcher
Also known as the dependent or outcome variable, its value is predicted or its variation is explained by the explanatory variable; in an experimental study, this is the outcome that is measured following manipulation of the explanatory variable
Example: Panda Fertility Treatments
A team of veterinarians wants to compare the effectiveness of two fertility treatments for pandas in captivity. The two treatments are in-vitro fertilization and male fertility medications. This experiment has one explanatory variable : type of fertility treatment. The response variable is a measure of fertility rate.
Example: Public Speaking Approaches
A public speaking teacher has developed a new lesson that she believes decreases student anxiety in public speaking situations more than the old lesson. She designs an experiment to test if her new lesson works better than the old lesson. Public speaking students are randomly assigned to receive either the new or old lesson; their anxiety levels during a variety of public speaking experiences are measured. This experiment has one explanatory variable : the lesson received. The response variable is anxiety level.
Example: Coffee Bean Origin
A researcher believes that the origin of the beans used to make a cup of coffee affects hyperactivity. He wants to compare coffee from three different regions: Africa, South America, and Mexico. The explanatory variable is the origin of coffee bean; this has three levels: Africa, South America, and Mexico. The response variable is hyperactivity level.
Example: Height & Age
A group of middle school students wants to know if they can use height to predict age. They take a random sample of 50 people at their school, both students and teachers, and record each individual's height and age. This is an observational study. The students want to use height to predict age so the explanatory variable is height and the response variable is age.
Example: Grade & Height
Research question: Do fourth graders tend to be taller than third graders?
This is an observational study. The researcher wants to use grade level to explain differences in height. The explanatory variable is grade level. The response variable is height.
1.2 - Samples & Populations
We often have questions concerning large populations . Gathering information from the entire population is not always possible due to barriers such as time, accessibility, or cost. Instead of gathering information from the whole population, we often gather information from a smaller subset of the population, known as a sample .
Values concerning a sample are referred to as sample statistics while values concerning a population are referred to as population parameters .
The process of using sample statistics to make conclusions about population parameters is known as inferential statistics . In other words, data from a sample are used to make an inference about a population.
Example: Student Housing
A survey is carried out at Penn State Altoona to estimate the proportion of all undergraduate students living at home during the current term. Of the 3,838 undergraduate students enrolled at the campus, a random sample of 100 was surveyed.
- Population : All 3,838 undergraduate students at Penn State Altoona
- Sample : The 100 undergraduate students surveyed
We can use the data collected from the sample of 100 students to make inferences about the population of all 3,838 students.
Example: Polling Teachers
Educational policy researchers randomly selected 400 teachers at random from the National Science Teachers Association database of members and asked them whether or not they believed that evolution should be taught in public schools. They received responses from 252 teachers.
- Population : All National Science Teachers Association members
- Sample : The 252 respondents
The researchers can use the data collected from the 252 teachers who responded to the survey to make inferences about the population of all National Science Teachers Association members.
Example: Flipping a Coin
A fair coin is flipped 500 times and the number of heads is recorded.
- Population : All flips of this coin
- Sample : The 500 flips recorded in this study
We can use data from these 500 flips to make inferences about the population of all flips of this coin.
1.2.1 - Sampling Bias
Recall the entire group of individuals of interest is called the population. It may be unrealistic or even impossible to gather data from the entire population. The subset of the population from which data are actually gathered is the sample. A sample should be selected from a population randomly, otherwise it may be prone to bias . Our goal is to obtain a sample that is representative of the population.
Example: Weight Loss Study Volunteers
A medical research center is testing a new weight loss treatment. They advertise on a social media site that they are looking for volunteers to participate. There is sampling bias because the sample will be limited to people who use the social media site where they advertised. The individuals who choose to participate may be different from the overall population. For example, volunteers may be individuals who are already actively trying to lose weight. This is not a representative sample because the sample may have characteristics that are different from the population of interest.
Example: NYC Advertising Study
The marketing department for a large retail chain wants to survey their customers about a new advertising plan. They go into one of their largest New York City stores on a Tuesday morning and survey the first 50 people who make a purchase. There is sampling bias for a number of reasons. They are only sampling at one store, in New York City; there may be differences between the customers at this store and those that shop at their other locations. By conducting their survey on a Tuesday morning they are limiting themselves to individuals who are out shopping at that time; the sample may lack people who work during the day. Finally, they only survey people who make a purchase; individuals who do not make a purchase, perhaps because they are not satisfied with the store, will not be included in their sample. This is not a representative sample because the sample selected may be different from the population of interest.
1.2.2 - Sampling Methods
There are many different ways to select a sample from a population. Some of these methods are probability-based, such as the simple random sampling method, which you'll read about below and in your textbook. Other probability-based methods include cluster sampling methods and stratified sampling methods. You may learn more about these if you take a research methods course or an advanced statistics course in the future. Other sampling methods are not probability-based, such as convenience sampling methods, which you will read about below.
Simple Random Sampling
To prevent sampling bias and obtain a representative sample, a sample should be selected using a probability-based sampling design which gives each individual a known chance of being selected. The most common probability-based sampling method is the simple random sampling method.
Using this method, a sample is selected without replacement. This means that once an individual has been selected to be a part of the sample they cannot be selected a second time. If multiple samples are being taken (e.g., when constructing a sampling distribution in Lesson 4), an individual can appear in more than one sample, but only once in each sample.
Example: Community Service Attitudes
An institutional researcher is conducting a study of World Campus students’ attitudes toward community service. He takes a list of all 12,242 World Campus students and uses a random number generator to select 30 students whom he contacts to complete the survey. This researcher used simple random sampling because participants were selected from the overall population in a way that each individual had an equal chance of being selected.
Example: Languages
A student wants to learn more about the languages spoken in her town. She has access to the census forms submitted by all 3,500 households in her town. It would take too long for her to go through all 3,500 forms, so she uses a random number generator to select 100 households. She finds those 100 census forms and records data concerning the languages spoken in those households. This is a simple random sample because the sample of 100 households was selected in a way that each of the 3,500 households had an equal chance of being selected.
Convenience Sampling
While probability-based sampling methods are considered better because they can prevent sampling bias, there are times when it is not possible to use one of these methods. For example, a researcher may not have access to the entire population. In cases were probability-based sampling methods are not practical, convenience samples are often used.
Example: Weight Loss Supplements
A weight loss company wants to compare how much weight adults lose on their supplement versus a competitor's supplement. To recruit participants, they post an advertisement in a newspaper asking for adults who want to lose weight. This is an example of a volunteer sample which is a convenience sampling method . The researchers are using a sample of individuals who volunteer to participate.
Example: Chocolate Preferences
A chocolate company wants to know if customers prefer their dark chocolate with or without peanuts. They set up a table in a grocery store on a Monday morning, offer customers samples of their dark chocolate with and without peanuts, and ask which they prefer. This is an example of a convenience sampling method . The sample is not being selected using any probability-based method and may not be representative of the company's intended population. People who grocery shop may be a special subset of the population. For example, people who do not work traditional full-time jobs may be more likely to grocery shop at that time. The researchers are using a sample of individuals who happen to be grocery shopping on a Monday morning and who volunteer to eat their chocolate.
1.2.2.1 - Minitab: Simple Random Sampling
At the end of most lessons, there will be a "Minitab" section. These pages will demonstrate how Minitab can be used to create some of the graphs or conduct some of the analyses presented in that lesson. Videos showing where to click will be provided after the step-by-step instructions.
Lesson 1 focused primarily on the design of research studies and data collection. There is just one feature in Minitab that is applicable to this lesson, and that is the Sample from Columns feature. This takes a simple random sample of cases from one or more variables in a dataset.
Minitab ® – Random Sampling from a Column
In this example, we have a worksheet containing the names of all of the Department of Statistics' full-time faculty members from the Spring 2021 semester.
These data are in the following files. The file ending in .mwx is a Minitab worksheet file; this can only be opened with Minitab 20. The file ending in .xlsx is an Excel file; this can be opened with any version of Minitab as well as with Excel:
FacultySP21.mwx
FacultySP21.xlsx
If this is your first time opening an .mwx file you may receive an error message if your computer does not know to open this in Minitab. You should be able to fix this by saving the file to your desktop, opening Minitab, and then opening the worksheet from within Minitab. After the first time, you computer should recognize that .mwx files should be opened with Minitab.
To select a simple random sample of 10 names from this dataset, follow the steps below. At the bottom of this section there is a video that shows where to click.
- Open the data in Minitab
- From the tool bar, select Calc > Sample from Columns...
- In the Number of rows to sample box, enter 10
- Click in the From columns box and then double click the Name variable
- Click in the Store samples in box and type My Sample
The third column of your worksheet should now be labeled "MySample" and it should contain 10 names. Since we are using simple random sampling procedures, the results will be different each time due to random sampling variation. Try these steps a few times, you should see that you get a different set of 10 names each time.
Watch Video
1.3 - Other Sources of Bias
On the previous pages you learned about sampling bias and how simple random sampling methods can be used to avoid sampling bias. Here, we will discuss two other sources of bias: non-response bias and response bias . These are both problems that should be prevented in the design of a research study.
Example: Restaurant Experience Survey
A restaurant invited their recent customers to complete an online survey. Customers who had really strong feelings about their experience, either positive or negative, were very likely to complete the survey while customers who had a neutral experience were much less likely to complete the survey. This is an example of non-response bias because the individuals who chose to participate differed from those who chose to not participate.
Example: Retail Store Hours
A retail store was considering expanding their operating hours. To determine if this was a need perceived by their customers, they conducted a survey over the telephone to obtain data. Research assistants called the phone numbers of customers who were randomly selected to participate between the hours of 9AM and 4PM. Individuals who were at work were less likely to answer their phone call or agree to participate in the study than individuals who were at home at that time. This is an example of non-response bias because the individuals who responded to the survey were different from individuals who did not respond in terms of their work schedule.
Example: Sexual Activity Survey
A psychologist is conducting a research study concerning sexual activities. The survey is administered over the phone and many of the questions are personal. Some participants feel uncomfortable and do not answer honestly. This is an example of response bias because the participants are not responding truthfully; instead their responses are biased toward what they perceive as being socially acceptable.
Example: Cheating in Class
Using an anonymous online survey, a professor asks his students “Have you cheated on an exam in my class?” Many of the students who have cheated still answered “no.” This is an example of response bias because the participants are not responding truthfully; instead their responses are biased toward responses that are less likely to get them in trouble.
1.4 - Research Study Design
Experimental and observational designs.
Research studies are often classified in terms of their designs. Here, we will make the distinction between experimental and observational research designs.
A study in which the researcher manipulates the treatments (i.e., level of the explanatory variable) received by subjects and collects data; also known as a scientific study
A study in which the researcher collects data without performing any manipulations; also known as a non-experimental study
Example: Caffeinated Coffee Studies

An organization wants to know if drinking caffeinated coffee causes hyperactivity in college students. To test their research question, they select a sample of college students and give them a survey concerning their intake of caffeinated coffee and their hyperactivity levels. This is an observational study because the researchers are not making any manipulations. They are observing what is happening without intervening. This is not an experiment because no treatment was imposed by the researchers.
Another organization also wants to know if drinking caffeinated coffee causes hyperactivity in college students. They design a different study. They select a random sample of college students and randomly assign them to drink coffee with or without caffeine. The researchers observe the students' behaviors. This is an experimental study because the researchers are manipulating the treatment that each participant receives.
Choosing a Research Study Design
Usually, if there is an option available, experimental studies are preferred over observational studies. Later in this lesson you will learn about randomization, placebos, and blinding, which can all be built into experimental designs to strengthen the conclusions that can be made.
There are times when an experimental design is not possible. If the independent variable is naturally occurring, it may not be possible for a researcher to manipulate it. For example, race, ethnicity, birthplace, age, gender identity, and biological sex are all variables that cannot be randomly assigned to different cases.
On Your Own
A team of researchers want to know if Advil or Tylenol is more effective.
Think about the following data collection methods, then click on the method to compare your answers.
1.4.1 - Confounding Variables
Randomized experiments are typically preferred over observational studies or experimental studies that lack randomization because they allow for more control. A common problem in studies without randomization is that there may be other variables influencing the results. These are known as confounding variables . A confounding variable is related to both the explanatory variable and the response variable.
Characteristic that varies between cases and is related to both the explanatory and response variables; also known as a lurking variable or a third variable
Example: Ice Cream & Home Invasions
There is a positive relationship between ice cream sales and home invasions (i.e., as ice cream sales increase throughout the year so do home invasions). It is clear that increases in ice cream sales do not cause home invasions to increase, and home invasions do not cause an increase in ice cream sales. There is a third variable at play here: outdoor temperature. When the weather is warmer both ice cream sales and home invasions increase. In this case, outdoor temperature is a confounding variable because it is related to both ice cream sales and home invasions.
Example: Weight & Preferred Beverage
Research question: Do adults who prefer to drink beer, wine, and water differ in terms of their mean weights?
Data were collected from a sample of World Campus students to address the research question above. The researchers found that adults who preferred beer tended to weigh more than those who preferred wine.
A confounding variable in this study was gender identity. Those who identified as men were more likely to prefer beer and those who identified as women were more likely to prefer wine. In the sample, men weighed more than women on average.
1.4.2 - Causal Conclusions
In order to control for confounding variables, participants can be randomly assigned to different levels of the explanatory variable. This act of randomly assigning cases to different levels of the explanatory variable is known as randomization . An experiment that involves randomization may be referred to as a randomized experiment or randomized comparative experiment . By randomly assigning cases to different conditions, a causal conclusion can be made; in other words, we can say that differences in the response variable are caused by differences in the explanatory variable. Without randomization, an association can be noted, but a causal conclusion cannot be made.
Note that randomization and random sampling are different concepts. Randomization refers to the random assignment of experimental units to different conditions (e.g., different treatment groups). Random sampling refers to probability-based methods for selecting a sample from a population.
Example: Fitness Programs
Two teams have designed research studies to compare the weight loss of participants in two different fitness programs. Each team used a different research study design.
The first team surveyed people who already participate in each program. This is an observational study, which means there is no randomization . Each group is comprised of participants who made the personal decision to engaged in that fitness program. With this research study design, the researchers can only determine whether or not there is an association between the fitness program and participants' weight loss. A causal conclusion cannot be made because there may be confounding variables . The people in the two groups may be different in some key ways. For example, if the cost of the two programs is different, the two groups may differ in terms of their finances.
The second team of researchers obtained a sample of participants and randomly assigned half to participate in the first fitness program and half to participate in the second fitness program. They measured each participants' weight twice: both at the beginning and end of their study. This is a randomized experiment because the researchers randomly assigned each participant to one of the two programs. Because participants were randomly assigned to groups, the groups should be balanced in terms of any confounding variables and a causal conclusion may be drawn from this study.
1.4.3 - Independent and Paired Samples
In both observational and experimental studies, we often want to compare two or more groups. When comparing two or more groups, cases may be independent or paired .
Cases in each group are meaningfully matched with one another; also known as dependent samples or matched pairs
Example: Exam Scores
An instructor wants to compare students' scores on the midterm and final exam. This is most often done by obtaining a sample of students and recording each student's midterm exam score and final exam score. In other words, there would be two measurements for each student. This is an example of a matched pairs design because data would be paired by student.
Example: Shoes
A shoe company is studying how many shoes Italian men and women own. In one research study they take a random sample of 500 Italian adults and ask each individual if they identify as a man or women and how many pairs of shoes they own. The men and women in this study are in two independent groups. In a second study the researchers use a different design. This time they take a random sample of 250 heterosexual married couples in Italy (i.e., 250 husbands and 250 wives). They record the number of shoes owned by each husband and each wife. This is an example of a matched pairs design. Data are paired by couple.
1.4.4 - Control and Placebo Groups
A control group is an experimental condition that does not receive the actual treatment and may serve as a baseline. A control group may receive a placebo or they may receive no treatment at all. A placebo is something that appears to the participants to be an active treatment, but does not actually contain the active treatment. For example, a placebo pill is a sugar pill that participants may take not knowing that it does not contain any active medicine. This can lead to a psychological phenomena called the placebo effect which occurs when participants who are given a placebo treatment experience a change even though they are not receiving any active treatment. Researchers use placebos in the control group to determine if any differences between groups are due to the active medicine or the participants' perceptions (the placebo effect).
Example: Vitamin B Energy Study
Researchers want to know if adults who consume a drink that is high in vitamin B-12 have increased energy. They obtain a representative sample of adults. All participants are given a drink that they are told to consume every morning. They are not told what is in the drink. Half are given a drink that is high in vitamin B-12 while the other half are given a drink that tastes the same but contains no vitamin B-12.
The participants who received the drink with no vitamin B-12 are the placebo group . The purpose of the placebo group in this study is to make the two groups equivalent except for the presence of the vitamin B-12. By comparing these two groups, the researchers will be able to determine what impact the vitamin B-12 had on the response variable. We could also say that this served as a control group because this group did not receive any active ingredients.
1.4.5 - Blinding
Blinding techniques are also used to avoid bias. In a single-blind study the participants do not know what treatment groups they are in, but the researchers interacting with them do know. In a double-blind study, the participants do not know what treatment groups they are in and neither do the researchers who are interacting with them directly. Double-blind studies are used to prevent researcher bias.
Example: Yogurt Tasting
Researchers are comparing a low-fat blueberry yogurt to a high-fat blueberry yogurt. Participants are randomly assigned to receive one type of yogurt. After tasting it, they complete an online survey. The researchers know which yogurt containers are low-fat and which are high-fat, but participants are not told. This is an example of a single-blind study because the researchers know which participants are in the low- and high-fat groups but the participants do not know. A double-blind study may not be necessary in this case since the researchers have only minimal contact with the participants.
Example: Caffeine Energy Study
Researchers want to know if adult males who consume high amounts of caffeine interact more energetically. They obtain a representative sample and randomly assign half of the participants to take a caffeine pill and half to take a placebo pill. The pills are randomly numbered and coded so at the time the researchers do not know which participants have been given caffeine and which have been given the placebo. All participants are told that they may have been given a caffeine pill. After taking the pill, researchers observe the participants interacting with one another and rate the interactions in terms of level of energy.
This is a double-blind study because neither the researchers nor the participants know who is in which group at the time the data are collected. After the data are collected, researchers can look at the pill codes to determine which groups the participants were in to conduct their analyses. A double-blind study is necessary here because the researchers are observing and rating the participants. If the researchers know who is in the caffeine group they may be more likely to rate their levels of energy as very high because that is consistent with their hypothesis.
1.5 - Lesson 1 Summary
Lesson 1: learning objectives.
In this lesson you learned about how data are collected. You were introduced to terminology that will be used throughout the course and you examined different types of research study designs (experimental and observational), sampling methods, and sources of bias. You learned that in order to make generalizations from a sample to a population the sample must be representative of the population; ideally the sample should be randomly selected using a probability-based sampling method such as a simple random sampling. In order to make a causal conclusion, randomization is required.
Getting to Know You
1.1: Which One Doesn’t Belong?: Types of Data (5 minutes)
CCSS Standards
Building On
Building Towards
Routines and Materials
Instructional Routines
- Which One Doesn’t Belong?
This is the first Which One Doesn't Belong routine in the course. In this routine, students are presented with four figures, diagrams, graphs, or expressions with the prompt “Which one doesn’t belong?” Typically, each of the four options “doesn’t belong” for a different reason, and the similarities and differences are mathematically significant. Students are prompted to explain their rationale for deciding that one option doesn’t belong and given opportunities to make their rationale more precise.
This warm-up prompts students to compare four survey questions. It gives students a reason to use language precisely (MP6) and gives you the opportunity to hear how they use terminology and talk about characteristics of the items in comparison to one another.
Arrange students in groups of 2–4. Display the survey questions for all to see. Give students 1 minute of quiet think time and then time to share their thinking with their small group. In their small groups, tell each student to share their reasoning why a particular item does not belong and together find at least one reason each item doesn't belong.
Student Facing
Which one doesn’t belong?
Question A: How many potato chips are in this bag of chips?
Question B: What is the typical number of chips in a bag of chips?
Question C: What type of chips are these?
Question D: What type of chips do students in this class prefer?
Student Response
For access, consult one of our IM Certified Partners .
Activity Synthesis
Ask each group to share one reason why a particular item does not belong. Record and display the responses for all to see. After each response, ask the class if they agree or disagree. Since there is no single correct answer to the question of which one does not belong, attend to students’ explanations and ensure the reasons given are correct. During the discussion, ask students to explain the meaning of any terminology they use, such as numerical data, categorical data, or average. Also, press students on unsubstantiated claims.
1.2: Representing Data About You and Your Classmates (25 minutes)
- MLR2: Collect and Display
In this activity, each group of 4 students is assigned three questions. One of the three they are assigned is a non-statistical question, one would generate numerical data, and one would generate categorical data. Groups also generate a fourth question of their own that can be answered with data. First, the group comes up with four survey questions that they can ask their classmates to collect data about their four questions of interest. Then, they collect data from their classmates by asking the survey questions. Finally, they summarize their results to answer the four questions of interest and reflect on the nature of the different questions they attempted to answer.
In a later lesson, students will represent the distribution of data collected in this activity graphically. If they record the data in their workbooks, it will be easy to retrieve later. If students record data some other way, be sure your method allows them to easily retrieve the data later.
Arrange students in groups of 4. Assign each group one of the following sets of three questions. Set A
- On average, how many letters are in the family (last) names for students in this class?
- Which month has the most birthdays from the class?
- How many periods (or blocks) have there been before this math class?
- On average, what is the furthest, in miles, that each student in this class has ever been from home?
- Would the class rather have a snow day or a field trip day?
- In what year was the 13th Amendment ratified?
- About how long did it take students in this class to get to school this morning?
- Which combination does the class prefer: peanut butter and banana or strawberry and banana?
- What is the lightest element from the periodic table?
- On average, how many movies in the theater did each student in the class watch this summer?
- Does the class prefer to write on paper with or without lines?
- How many seats are in the classroom?
Give students 2 minutes to write a question of their own that could be answered using data from the class. After giving students time to discuss the questions in their groups, pause for a whole group discussion.
Give students an example of the types of questions they should be asking their classmates. “For example, if you are assigned the question, ‘Which month has the most birthdays from the class?’ you might ask your classmates, ‘In what month is your birthday?’”
Your teacher will assign you a set of 3 questions.
- Write another question of your own that will require data collected from the class to answer.
- For each of the 4 questions, write a survey question that will help you collect data from the class that can be analyzed to answer the question.
- Ask the 4 survey questions to 15 classmates and record their responses to collect data.
- After collecting the data return to your group.
- What is the question of your own that will require data collected from the class to answer?
- What are the 4 survey questions you will ask your classmates?
- Summarize the data for each question in a sentence or two and share the results with your group.
- With your group, decide what the responses for question number 1 have in common. Then do the same for questions numbered 2 and 3.
- Does the question you wrote fit best with the questions from number 1, 2, or 3? Explain your reasoning.
Are you ready for more?
Find a news article that uses numerical data to discuss a statistical question.
Find a news article that uses categorical data to discuss a statistical question.
Anticipated Misconceptions
Students may confuse statistical questions with survey questions. Explain that the set of three questions are statistical questions that can be answered using the survey questions. For example, students may think they should ask each of their classmates for the average distance they have traveled from home. However, students can ask each classmate "What is the furthest distance you have traveled from home?" and colletively use the answers to this survey question to answer the statistical question about the average distance their classmates have travelled from home.
Share all of the questions numbered 1 from each set. Ask students to summarize what responses to these questions might have in common. (In order to answer them, you collect responses that are numbers.)
Repeat for the questions from number 2 and 3. (In order to answer questions from number 2, you collect responses that are descriptive words or characteristics. The questions from number 3 only have one possible answer, and don’t have any variability in the responses.)
Tell students that we call data collected by questions in number 1 numerical data , data collected by questions in number 2 categorical data , and the questions in number 3 are non-statistical questions, because there will be no variability in the responses. Questions in number 1 and 2 are called statistical questions since they require collection of data and there is anticipated variability in the responses.
Lesson Synthesis
To promote student understanding of the differences between statistical and non-statistical questions and classifying data as numerical or categorical, ask:
- “What makes a question statistical?” (There is variability in the data collected.)
- “What is an example of a non-statistical question?” (What value for \(x\) makes the equation \(x + 5 = 7\) true?)
- “What is an example of a statistical question that we have not used in class?” (On average, how many people eat breakfast every day?)
- “What type data is collected to answer the statistical question, ‘Would the class rather have pizza or donuts?’” (Categorical)
- “What is an example of a statistical question that results in numerical data?” (What is the typical surface area of styrofoam pellets?)
To help prepare students for the next lesson, ask:
- “What are some different ways to represent data graphically?” (Bar graphs, dot plots, box plots, pie charts, and histograms.)
1.3: Cool-down - Categorizing Questions (5 minutes)
Student lesson summary.
Statistics is about using data to solve problems or make decisions. There are two types of data:
- Numerical data are expressed using a number. For example, to answer the question “How tall are the students in this class?” you would measure the height of each student which would result in numerical data.
- Categorical data are expressed using characteristics. For example, to answer the question “What brand of phones do people use?” you would survey several people and their answers result in categorical data.
The question that you ask determines the type of data that you collect and whether or not there is variability in the data collected. In earlier grades, you learned that there is variability in a data set if not all of the values in the data set are the same. These are examples of statistical questions because they are answered by collecting data that has variability:
- “What is the average class size at this school?” would produce numerical data with some variability.
- “What are the favorite colors of students in this class?” would produce categorical data with some variability.
These are examples non-statistical questions because they are answered by collecting data that does not vary:
- “How many students are on the roster for this class?” would produce numerical data that does not vary. There is only one value in the data set, so there is no variability.
- “What color is this marker?” would produce categorical data that does not vary. There is only one value in the data set, so there is no variability.
- Lesson 2: Stick Figures
- Lesson 3: Data Structures
- Lesson 4: The Data Cycle
- Lesson 5: So Many Questions
- Lesson 6: What Do I Eat?
- Lesson 7: Setting the Stage
- Campaign Guidelines – Food Habits
- AppDownloads
- How to..Video
- Applications
Lesson 1: Data Trails
Students will understand what are data, how they are collected, and possible effects of sharing data.
Video: The Target Story found at: https://www.youtube.com/watch?v=XvSA-6BJkx4
Data Science (DS) journal (quad-ruled composition book or similar); MUST be available for every lesson
Data Diary handout ( LMR_1.1_Data Diary )
Video: Terms and Conditions found at: https://www.youtube.com/watch?v=ZcjtEKNP05c
Vocabulary:
data observations data trails privacy
Essential Concepts:
Data are a collection of recorded observations. Data are gathered by people and by sensors. Patterns in data can reveal previously unknown patterns in our world. Data play a large, and sometimes invisible, role in our lives.
Before implementing the IDS curriculum, ensure that:
a) Students have been placed in teams and each student understands his or her role in the team.
b) Each student knows who his/her partner is within each team.
c) Expectations regarding collaborative teamwork are discussed and understood (see Team Roles in Teacher Resources ).
Introduce the lesson by showing The Target Story video: https://www.youtube.com/watch?v=XvSA-6BJkx4
In pairs, ask students to discuss the following question using the TPS strategy (see Instructional Strategies in Teacher Resources ):
- How do you think Target knew about the daughter? In other words, how did Target know the daughter was pregnant before her father did? Target used the information gathered from the daughter’s Red Card and compared it to information about other shoppers. Typically, women who bought those particular products were pregnant.
After students have had time to share their responses, engage in a whole class discussion regarding:
What are data ? Data are information, or observations , that have been gathered and recorded.
Where do data come from? Data can come from a variety of places. Some examples might include: cell phones, computers, school records, surveys, etc.
Give an example of data. Answers will vary. One example might be information about a person – including their age, height, weight, eye color, etc.
Give an example of something that is not data (e.g., something that was never written down). Answers will vary. One example might be just watching an event happen. If it wasn’t recorded in some way, it cannot be counted as data.
Explain to the students that we create "data trails" as we go through life. A data trail is the data collected about us as individuals that could be used to see the patterns in our personal lives. Inform the students that they will learn about their own data trails by keeping a data diary and logging entries over the next 24 hours. It is likely that students do not realize how often they leave a data trail or what information is being collected about them on a regular basis.
Distribute the Data Diary handout ( LMR_1.1 ) and be sure to go over the instructions, along with the first example to give the students an idea of how to proceed.
Inform the students that you will collect the handouts during the next class in order to assess their understanding of data.
To get students thinking about what happens to their data, show the Terms and Conditions video: https://www.youtube.com/watch?v=ZcjtEKNP05c
Engage the students in a whole class discussion about the video, particularly noting:
What terms in the privacy statements were concerning or worrisome?
Do you read the agreements when you download phone apps?
Class Scribes:
One team of students will give a brief talk to discuss what they think the 3 most important topics of the day were. Be prepared to facilitate a good discussion and to ask probing questions in order for students to elaborate on their thinking so that vague responses such as “we learned about data” can be avoided.
Students will complete the Data Diary handout. When grading the homework, be aware of whether the data really could be collected, and whether the students' ideas about how the data might be used are reasonable. For instance, students will often imagine that there is a "spy" watching them; this is not what we are after. We are after actual instances in which sensors or electronic surveillance records their actions or records information about them. For example, "someone saw me going into the store" is not valid data for this exercise, but "a camera recorded me entering the store" is valid data.
Finished Papers

Sophia Melo Gomes
- Math Problem
- Movie Review
- Personal Statement
- PowerPoint Presentation plain
- PowerPoint Presentation with Speaker Notes
- Proofreading
What if I’m unsatisfied with an essay your paper service delivers?
Gain recognition with the help of my essay writer.
Generally, our writers, who will write my essay for me, have the responsibility to show their determination in writing the essay for you, but there is more they can do. They can ease your admission process for higher education and write various personal statements, cover letters, admission write-up, and many more. Brilliant drafts for your business studies course, ranging from market analysis to business proposal, can also be done by them. Be it any kind of a draft- the experts have the potential to dig in deep before writing. Doing ‘my draft’ with the utmost efficiency is what matters to us the most.
Finished Papers
Megan Sharp

Courtney Lees
receive 15% off
Adam Dobrinich
Finished Papers

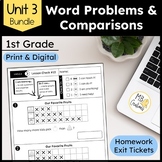
Collect and Compare Data Worksheets/Homework - iReady Math 1st Grade Lesson 13

- Easel Activity
What educators are saying
Also included in.
Description
Teaching first-grade students how to collect and compare data with iReady Classroom Math 2024 requires a great deal of practice. Save time and energy by implementing these exit tickets, worksheets, and vocabulary activities into your iReady Classroom Math routines. This resource provides extra practice for students as they collect and compare data, model their thinking, and solve problems. These rigorous first-grade math activities align with Common Core State Standards and prepare students for standardized testing.
Check out the Contents of Lesson 13 - Collect and Compare Data :
✏️ Two Vocabulary Worksheets that align with terms in the lesson
- Students will strengthen their understanding of this lesson’s vocabulary terms through fun activities.
✏️ Two Levels of Practice Pages (4 worksheets)
- Basic (On Level) - Provide additional practice with grade-level math.
- Advanced (Challenge) - Plunge deeper into grade-level math and apply knowledge.
- These “Lesson Checks” can be used for reteaching, independent work, assessment, math centers, or first-grade math homework.
✏️ Two Exit Tickets for Every Session (Printed two/page; most lessons have 5 sessions)
✏️ PowerPoint File
- All questions have been reformatted for screens
- The included PowerPoint file makes it easy to present immediately!
- Add interactive elements with PearDeck or Nearpod.
- Export the slides to OneNote, Google, or SeeSaw!
✏️ Answer Keys
Use These Worksheets and Exit Tickets with your iReady Classroom Math Curriculum!
✅ Differentiate by assigning “Basic” (>) worksheets to students who are practicing grade-level content. Challenge gifted and talented students with “Advanced” (>>) worksheets. These activities require students to dive deeper as they collect and compare data.
✅ Complete one lesson check in small groups and assign a second page for homework. (Questions prepare students to master iReady Classroom Math Quizzes!)
✅ Invite early finishers to think creatively about math vocabulary through a variety of activities.
✅ Quickly assess students’ abilities with the first-grade math exit tickets.
Hear From Educators Like You!
⭐️ “You will not regret purchasing this product. They are great resources and very well planned out. I love the exit tickets.”
⭐️ “I am in love with these resources! I use the exit tickets every day and I also use the worksheets as homework and assessments.”
⭐️ “Since iReady is new to me, I needed a guide to help me with exit tickets, homework, and extra practice for my students. This does just that. It has been so useful and I am so excited to keep using this resource."
Find Answers to Your Questions about this Supplement to iReady Classroom Math:
✋ Does my district have to use iReady Classroom Math 2024?
- No, these worksheets and exit tickets align with CCSS and provide excellent practice to students in all math classes. Don’t take my word for it… teachers like you have said, “This was awesome! I LOVE the range of problem types! My school doesn’t use iReady and I still LOVED these slides!”
✋ I use PearDeck...Google Classroom...SeeSaw... Will the digital elements work?
- Yes! Every question has been reformatted to make digital integration a breeze! Present with PearDeck, NearPod, or PowerPoint. Export the slides into SeeSaw or OneNote. It’s so easy!
Did you know? You can assign TPT Easel resources, like this lesson on how to collect and compare data, to Google Classroom! If you don’t teach in a “Google” school, share TPT Easel with students through a link. Save time and paper by assigning online!
#mbcreations #mbcreations4education #ireadymath
❤️ Follow me to receive updates on new resources. ❤️
⬇️ Yearlong 1st Grade iReady Math Collection: ⬇️
- 1st Grade Math Vocabulary Banner
- 1st Grade iReady Math Unit 1 Bundle
- 1st Grade iReady Math Unit 2 Bundle
- 1st Grade iReady Math Unit 3 Bundle
- 1st Grade iReady Math Unit 4 Bundle
- 1st Grade iReady Math Unit 5 Bundle
- 1st Grade iReady Math Unit 6 Bundle
- 1st Grade iReady Unit Reviews & Test Prep
Questions & Answers
Mb creations.
- We're hiring
- Help & FAQ
- Privacy policy
- Student privacy
- Terms of service
- Tell us what you think
The essay writers who will write an essay for me have been in this domain for years and know the consequences that you will face if the draft is found to have plagiarism. Thus, they take notes and then put the information in their own words for the draft. To be double sure about this entire thing, your final draft is being analyzed through anti-plagiarism software, Turnitin. If any sign of plagiarism is detected, immediately the changes will be made. You can get the Turnitin report from the writer on request along with the final deliverable.
Adam Dobrinich

Customer Reviews
Gain recognition with the help of my essay writer
Generally, our writers, who will write my essay for me, have the responsibility to show their determination in writing the essay for you, but there is more they can do. They can ease your admission process for higher education and write various personal statements, cover letters, admission write-up, and many more. Brilliant drafts for your business studies course, ranging from market analysis to business proposal, can also be done by them. Be it any kind of a draft- the experts have the potential to dig in deep before writing. Doing ‘my draft’ with the utmost efficiency is what matters to us the most.
- Human Resource
- Business Strategy
- Operations Management
- Project Management
- Business Management
- Supply Chain Management
- Scholarship Essay
- Narrative Essay
- Descriptive Essay
- Buy Essay Online
- College Essay Help
- Help To Write Essay Online
How can I be sure you will write my paper, and it is not a scam?

Why do I have to pay upfront for you to write my essay?
Susan Devlin
Some attractive features that you will get with our write essay service
Grab these brilliant features with the best essay writing service of PenMyPaper. With our service, not the quality but the quantity of the draft will be thoroughly under check, and you will be able to get hold of good grades effortlessly. So, hurry up and connect with the essay writer for me now to write.
Check your email for notifications. Once your essay is complete, double-check it to see if it falls under your expectations and if satisfied-release the funds to your writer. Keep in mind that our essay writing service has a free revisions policy.

Know Us Better
- Knowledge Base
- Referencing Styles
- Know Our Consultance
- Revision and Refund Policy
- Terms Of Use
Get Professional Writing Services Today!
Get a free quote from our professional essay writing service and an idea of how much the paper will cost before it even begins. If the price is satisfactory, accept the bid and watch your concerns slowly fade away! Our team will make sure that staying up until 4 am becomes a thing of the past. The essay service is known for providing some of the best writing, editing, and proofreading available online. What are you waiting for? Join our global educational community today!

IMAGES
VIDEO
COMMENTS
McGraw-Hill My Math Grade 3 Answer Key Chapter 12 Lesson 1 Collect and Record Data. Data is collected information or facts. One way to collect data is by taking a survey, or asking a lot of people a question. A frequency table or tally chart will help you record the data you collect. Math in My World. Example 1. Mr. Alvarez surveyed his scout ...
School subject: Math (1061955) Main content: Lesson 1: Collect and Record Data (1364080) Lesson 1: Collect and Record Data. Other contents: Lesson 1: Collect and Record Data Loading ad... Share / Print Worksheet. Google Classroom Microsoft Teams Facebook Pinterest Twitter ...
This video walks through Chapter 12 Lesson 1: Collect and Record Data from the Third grade My Math Series (2019). It walks through the teacher-led pages with...
Collect and Record Data Practice 1. ... Day Votes 2. Which day of the school week is the least favorite day? Homework Helper While Ryan waited for the bus, he recorded the colors of the cars that went ... Program: GMH CCM Component: SE PDF Pass Vendor: Quad Graphics Grade: 3 Lesson 1 My Homework 695 eHelp 00695_0696_Gr3_S_C12L1HW_116191.indd ...
Lesson 1: Generate and organize data. Date: 3/29/14 Lesson 1 ... Part 1: Collect data. List the following five colors on the board: green, yellow, red, blue, and orange. ... Record your favorite color with a tally mark on the chart now, and cross off your name. T: (Allow time for students to record favorite color.) ...
Worksheets, solutions, and videos to help Grade 1 students learn how to collect, sort, and organize data, then ask and answer questions about the number of data points. Common Core Grade 1, Module 3, Topic D: Data Interpretation. Common Core Standards: 1.OA.1, 1.MD.2, 1.MD.4. New York State Common Core Math Grade 1, Module 3, Lesson 10, Lesson 11.
1: Collecting Data. Welcome to Lesson 1! In this lesson, we will be learning about collecting data. This is essentially a brief introduction to research methods. Depending on your academic major, you may also be required to take a full course in research methods after this course, which will focus on the methods used in your field.
This is a worksheet with a review of the lesson 12.1 in the 3rd grade My Math series: Collect and Record Data Can be used as a quiz, formative assessment, review, extra help, or homework. Answer Key is included.
For each of the 4 questions, write a survey question that will help you collect data from the class that can be analyzed to answer the question. Ask the 4 survey questions to 15 classmates and record their responses to collect data. After collecting the data return to your group.
This is a worksheet with a review of the lesson 12.1 in the 3rd grade My Math series: Collect and Record Data Can be used as a quiz, formative assessment, review, extra help, or homework. Answer Key is included.
Unit 1, Lesson 3 How do Scientists Collect and Record Data. research. Click the card to flip 👆. When you use reference materials and talk to experts to learn what is known. Click the card to flip 👆. 1 / 18.
This is a worksheet with a review of the lesson 12.1 in the 3rd grade My Math series: Collect and Record Data Can be used as a quiz, formative assessment, review, extra help, or homework. Answer Key is included.
qacblogs.org
You can take a surveyto collect data. You can record the data with tally marks. Greg asked his classmates which lunch was their favorite. The tally marks in the tally chart show the children's answers. Each tally mark stands for one child's choice. 1. Take a survey.
Lesson 1: Data Trails Objective: Students will understand what are data, how they are collected, and possible effects of sharing data. ... Data are a collection of recorded observations. Data are gathered by people and by sensors. Patterns in data can reveal previously unknown patterns in our world. ... When grading the homework, be aware of ...
My Homework Lesson 1 Collect And Record Data. Level: College, University, Master's, High School, PHD, Undergraduate. Liberal Arts and Humanities. The reaction paper was written... We select our writers from various domains of academics and constantly focus on enhancing their skills for our writing essay services.
My Homework Lesson 1 Collect And Record Data, Example Glossary Second Grade, Essays Of Argumentative Writi, Steps In Implementing Business Plan, Professional Home Work Writer For Hire For School, Personal Statement Financial Advisor, Argumentative Research Paper Topics About Technology
My Homework Lesson 1 Collect And Record Data. Level: College, University, High School, Master's, Undergraduate, PHD. 10 Customer reviews. Great! I am on it. ID 13337.
My Homework Lesson 1 Collect And Record Data - ID 11801. 4.7/5. 132 . Customer Reviews. Verification link has been re-sent to your email. Click the link to activate your account. 24/7 Customer support. Support team is ready to answer any questions at any time of day and night ...
Check out the Contents of Lesson 13 - Collect and Compare Data: ️ Two Vocabulary Worksheets that align with terms in the lesson. Students will strengthen their understanding of this lesson's vocabulary terms through fun activities. ️ Two Levels of Practice Pages (4 worksheets) Basic (On Level) - Provide additional practice with grade ...
My Homework Lesson 1 Collect And Record Data - Nursing Business and Economics Management Psychology +94. 848 . Finished Papers. 100% Success rate REVIEWS HIRE. ID 12011. Show More. My Homework Lesson 1 Collect And Record Data ... It was my first time... ID 9011. User ID: 108261.
My Homework Lesson 1 Collect And Record Data | Best Writing Service. Updated Courtyard facing Unit at the Beacon! This newly remodeled…. 2. Accuracy and promptness are what you will get from our writers if you write with us. They will simply not ask you to pay but also retrieve the minute details of the entire draft and then only will ...
My Homework Lesson 1 Collect And Record Data | Best Writing Service. Original. Drafts. The experts well detail out the effect relationship between the two given subjects and underline the importance of such a relationship in your writing. Our cheap essay writer service is a lot helpful in making such a write-up a brilliant one.