- Chapter Four: Quantitative Methods (Part 1)
Once you have chosen a topic to investigate, you need to decide which type of method is best to study it. This is one of the most important choices you will make on your research journey. Understanding the value of each of the methods described in this textbook to answer different questions allows you to be able to plan your own studies with more confidence, critique the studies others have done, and provide advice to your colleagues and friends on what type of research they should do to answer questions they have. After briefly reviewing quantitative research assumptions, this chapter is organized in three parts or sections. These parts can also be used as a checklist when working through the steps of your study. Specifically, part 1 focuses on planning a quantitative study (collecting data), part two explains the steps involved in doing a quantitative study, and part three discusses how to make sense of your results (organizing and analyzing data).
- Chapter One: Introduction
- Chapter Two: Understanding the distinctions among research methods
- Chapter Three: Ethical research, writing, and creative work
- Chapter Four: Quantitative Methods (Part 2 - Doing Your Study)
- Chapter Four: Quantitative Methods (Part 3 - Making Sense of Your Study)
- Chapter Five: Qualitative Methods (Part 1)
- Chapter Five: Qualitative Data (Part 2)
- Chapter Six: Critical / Rhetorical Methods (Part 1)
- Chapter Six: Critical / Rhetorical Methods (Part 2)
- Chapter Seven: Presenting Your Results

Quantitative Worldview Assumptions: A Review
In chapter 2, you were introduced to the unique assumptions quantitative research holds about knowledge and how it is created, or what the authors referred to in chapter one as "epistemology." Understanding these assumptions can help you better determine whether you need to use quantitative methods for a particular research study in which you are interested.
Quantitative researchers believe there is an objective reality, which can be measured. "Objective" here means that the researcher is not relying on their own perceptions of an event. S/he is attempting to gather "facts" which may be separate from people's feeling or perceptions about the facts. These facts are often conceptualized as "causes" and "effects." When you ask research questions or pose hypotheses with words in them such as "cause," "effect," "difference between," and "predicts," you are operating under assumptions consistent with quantitative methods. The overall goal of quantitative research is to develop generalizations that enable the researcher to better predict, explain, and understand some phenomenon.
Because of trying to prove cause-effect relationships that can be generalized to the population at large, the research process and related procedures are very important for quantitative methods. Research should be consistently and objectively conducted, without bias or error, in order to be considered to be valid (accurate) and reliable (consistent). Perhaps this emphasis on accurate and standardized methods is because the roots of quantitative research are in the natural and physical sciences, both of which have at their base the need to prove hypotheses and theories in order to better understand the world in which we live. When a person goes to a doctor and is prescribed some medicine to treat an illness, that person is glad such research has been done to know what the effects of taking this medicine is on others' bodies, so s/he can trust the doctor's judgment and take the medicines.
As covered in chapters 1 and 2, the questions you are asking should lead you to a certain research method choice. Students sometimes want to avoid doing quantitative research because of fear of math/statistics, but if their questions call for that type of research, they should forge ahead and use it anyway. If a student really wants to understand what the causes or effects are for a particular phenomenon, they need to do quantitative research. If a student is interested in what sorts of things might predict a person's behavior, they need to do quantitative research. If they want to confirm the finding of another researcher, most likely they will need to do quantitative research. If a student wishes to generalize beyond their participant sample to a larger population, they need to be conducting quantitative research.
So, ultimately, your choice of methods really depends on what your research goal is. What do you really want to find out? Do you want to compare two or more groups, look for relationships between certain variables, predict how someone will act or react, or confirm some findings from another study? If so, you want to use quantitative methods.
A topic such as self-esteem can be studied in many ways. Listed below are some example RQs about self-esteem. Which of the following research questions should be answered with quantitative methods?
- Is there a difference between men's and women's level of self- esteem?
- How do college-aged women describe their ups and downs with self-esteem?
- How has "self-esteem" been constructed in popular self-help books over time?
- Is there a relationship between self-esteem levels and communication apprehension?
What are the advantages of approaching a topic like self-esteem using quantitative methods? What are the disadvantages?
For more information, see the following website: Analyse This!!! Learning to analyse quantitative data
Answers: 1 & 4
Quantitative Methods Part One: Planning Your Study
Planning your study is one of the most important steps in the research process when doing quantitative research. As seen in the diagram below, it involves choosing a topic, writing research questions/hypotheses, and designing your study. Each of these topics will be covered in detail in this section of the chapter.
Topic Choice
Decide on topic.
How do you go about choosing a topic for a research project? One of the best ways to do this is to research something about which you would like to know more. Your communication professors will probably also want you to select something that is related to communication and things you are learning about in other communication classes.
When the authors of this textbook select research topics to study, they choose things that pique their interest for a variety of reasons, sometimes personal and sometimes because they see a need for more research in a particular area. For example, April Chatham-Carpenter studies adoption return trips to China because she has two adopted daughters from China and because there is very little research on this topic for Chinese adoptees and their families; she studied home vs. public schooling because her sister home schools, and at the time she started the study very few researchers had considered the social network implications for home schoolers (cf. http://www.uni.edu/chatham/homeschool.html ).
When you are asked in this class and other classes to select a topic to research, think about topics that you have wondered about, that affect you personally, or that know have gaps in the research. Then start writing down questions you would like to know about this topic. These questions will help you decide whether the goal of your study is to understand something better, explain causes and effects of something, gather the perspectives of others on a topic, or look at how language constructs a certain view of reality.
Review Previous Research
In quantitative research, you do not rely on your conclusions to emerge from the data you collect. Rather, you start out looking for certain things based on what the past research has found. This is consistent with what was called in chapter 2 as a deductive approach (Keyton, 2011), which also leads a quantitative researcher to develop a research question or research problem from reviewing a body of literature, with the previous research framing the study that is being done. So, reviewing previous research done on your topic is an important part of the planning of your study. As seen in chapter 3 and the Appendix, to do an adequate literature review, you need to identify portions of your topic that could have been researched in the past. To do that, you select key terms of concepts related to your topic.
Some people use concept maps to help them identify useful search terms for a literature review. For example, see the following website: Concept Mapping: How to Start Your Term Paper Research .
Narrow Topic to Researchable Area
Once you have selected your topic area and reviewed relevant literature related to your topic, you need to narrow your topic to something that can be researched practically and that will take the research on this topic further. You don't want your research topic to be so broad or large that you are unable to research it. Plus, you want to explain some phenomenon better than has been done before, adding to the literature and theory on a topic. You may want to test out what someone else has found, replicating their study, and therefore building to the body of knowledge already created.
To see how a literature review can be helpful in narrowing your topic, see the following sources. Narrowing or Broadening Your Research Topic and How to Conduct a Literature Review in Social Science
Research Questions & Hypotheses
Write Your Research Questions (RQs) and/or Hypotheses (Hs)
Once you have narrowed your topic based on what you learned from doing your review of literature, you need to formalize your topic area into one or more research questions or hypotheses. If the area you are researching is a relatively new area, and no existing literature or theory can lead you to predict what you might find, then you should write a research question. Take a topic related to social media, for example, which is a relatively new area of study. You might write a research question that asks:
"Is there a difference between how 1st year and 4th year college students use Facebook to communicate with their friends?"
If, however, you are testing out something you think you might find based on the findings of a large amount of previous literature or a well-developed theory, you can write a hypothesis. Researchers often distinguish between null and alternative hypotheses. The alternative hypothesis is what you are trying to test or prove is true, while the null hypothesis assumes that the alternative hypothesis is not true. For example, if the use of Facebook had been studied a great deal, and there were theories that had been developed on the use of it, then you might develop an alternative hypothesis, such as: "First-year students spend more time on using Facebook to communicate with their friends than fourth-year students do." Your null hypothesis, on the other hand, would be: "First-year students do not spend any more time using Facebook to communication with their friends than fourth-year students do." Researchers, however, only state the alternative hypothesis in their studies, and actually call it "hypothesis" rather than "alternative hypothesis."
Process of Writing a Research Question/Hypothesis.
Once you have decided to write a research question (RQ) or hypothesis (H) for your topic, you should go through the following steps to create your RQ or H.
Name the concepts from your overall research topic that you are interested in studying.
RQs and Hs have variables, or concepts that you are interested in studying. Variables can take on different values. For example, in the RQ above, there are at least two variables – year in college and use of Facebook (FB) to communicate. Both of them have a variety of levels within them.
When you look at the concepts you identified, are there any concepts which seem to be related to each other? For example, in our RQ, we are interested in knowing if there is a difference between first-year students and fourth-year students in their use of FB, meaning that we believe there is some connection between our two variables.
- Decide what type of a relationship you would like to study between the variables. Do you think one causes the other? Does a difference in one create a difference in the other? As the value of one changes, does the value of the other change?
Identify which one of these concepts is the independent (or predictor) variable, or the concept that is perceived to be the cause of change in the other variable? Which one is the dependent (criterion) variable, or the one that is affected by changes in the independent variable? In the above example RQ, year in school is the independent variable, and amount of time spent on Facebook communicating with friends is the dependent variable. The amount of time spent on Facebook depends on a person's year in school.
If you're still confused about independent and dependent variables, check out the following site: Independent & Dependent Variables .
Express the relationship between the concepts as a single sentence – in either a hypothesis or a research question.
For example, "is there a difference between international and American students on their perceptions of the basic communication course," where cultural background and perceptions of the course are your two variables. Cultural background would be the independent variable, and perceptions of the course would be your dependent variable. More examples of RQs and Hs are provided in the next section.
APPLICATION: Try the above steps with your topic now. Check with your instructor to see if s/he would like you to send your topic and RQ/H to him/her via e-mail.
Types of Research Questions/Hypotheses
Once you have written your RQ/H, you need to determine what type of research question or hypothesis it is. This will help you later decide what types of statistics you will need to run to answer your question or test your hypothesis. There are three possible types of questions you might ask, and two possible types of hypotheses. The first type of question cannot be written as a hypothesis, but the second and third types can.
Descriptive Question.
The first type of question is a descriptive question. If you have only one variable or concept you are studying, OR if you are not interested in how the variables you are studying are connected or related to each other, then your question is most likely a descriptive question.
This type of question is the closest to looking like a qualitative question, and often starts with a "what" or "how" or "why" or "to what extent" type of wording. What makes it different from a qualitative research question is that the question will be answered using numbers rather than qualitative analysis. Some examples of a descriptive question, using the topic of social media, include the following.
"To what extent are college-aged students using Facebook to communicate with their friends?"
"Why do college-aged students use Facebook to communicate with their friends?"
Notice that neither of these questions has a clear independent or dependent variable, as there is no clear cause or effect being assumed by the question. The question is merely descriptive in nature. It can be answered by summarizing the numbers obtained for each category, such as by providing percentages, averages, or just the raw totals for each type of strategy or organization. This is true also of the following research questions found in a study of online public relations strategies:
"What online public relations strategies are organizations implementing to combat phishing" (Baker, Baker, & Tedesco, 2007, p. 330), and
"Which organizations are doing most and least, according to recommendations from anti- phishing advocacy recommendations, to combat phishing" (Baker, Baker, & Tedesco, 2007, p. 330)
The researchers in this study reported statistics in their results or findings section, making it clearly a quantitative study, but without an independent or dependent variable; therefore, these research questions illustrate the first type of RQ, the descriptive question.
Difference Question/Hypothesis.
The second type of question is a question/hypothesis of difference, and will often have the word "difference" as part of the question. The very first research question in this section, asking if there is a difference between 1st year and 4th year college students' use of Facebook, is an example of this type of question. In this type of question, the independent variable is some type of grouping or categories, such as age. Another example of a question of difference is one April asked in her research on home schooling: "Is there a difference between home vs. public schoolers on the size of their social networks?" In this example, the independent variable is home vs. public schooling (a group being compared), and the dependent variable is size of social networks. Hypotheses can also be difference hypotheses, as the following example on the same topic illustrates: "Public schoolers have a larger social network than home schoolers do."
Relationship/Association Question/Hypothesis.
The third type of question is a relationship/association question or hypothesis, and will often have the word "relate" or "relationship" in it, as the following example does: "There is a relationship between number of television ads for a political candidate and how successful that political candidate is in getting elected." Here the independent (or predictor) variable is number of TV ads, and the dependent (or criterion) variable is the success at getting elected. In this type of question, there is no grouping being compared, but rather the independent variable is continuous (ranges from zero to a certain number) in nature. This type of question can be worded as either a hypothesis or as a research question, as stated earlier.
Test out your knowledge of the above information, by answering the following questions about the RQ/H listed below. (Remember, for a descriptive question there are no clear independent & dependent variables.)
- What is the independent variable (IV)?
- What is the dependent variable (DV)?
- What type of research question/hypothesis is it? (descriptive, difference, relationship/association)
- "Is there a difference on relational satisfaction between those who met their current partner through online dating and those who met their current partner face-to-face?"
- "How do Fortune 500 firms use focus groups to market new products?"
- "There is a relationship between age and amount of time spent online using social media."
Answers: RQ1 is a difference question, with type of dating being the IV and relational satisfaction being the DV. RQ2 is a descriptive question with no IV or DV. RQ3 is a relationship hypothesis with age as the IV and amount of time spent online as the DV.
Design Your Study
The third step in planning your research project, after you have decided on your topic/goal and written your research questions/hypotheses, is to design your study which means to decide how to proceed in gathering data to answer your research question or to test your hypothesis. This step includes six things to do. [NOTE: The terms used in this section will be defined as they are used.]
- Decide type of study design: Experimental, quasi-experimental, non-experimental.
- Decide kind of data to collect: Survey/interview, observation, already existing data.
- Operationalize variables into measurable concepts.
- Determine type of sample: Probability or non-probability.
- Decide how you will collect your data: face-to-face, via e-mail, an online survey, library research, etc.
- Pilot test your methods.
Types of Study Designs
With quantitative research being rooted in the scientific method, traditional research is structured in an experimental fashion. This is especially true in the natural sciences, where they try to prove causes and effects on topics such as successful treatments for cancer. For example, the University of Iowa Hospitals and Clinics regularly conduct clinical trials to test for the effectiveness of certain treatments for medical conditions ( University of Iowa Hospitals & Clinics: Clinical Trials ). They use human participants to conduct such research, regularly recruiting volunteers. However, in communication, true experiments with treatments the researcher controls are less necessary and thus less common. It is important for the researcher to understand which type of study s/he wishes to do, in order to accurately communicate his/her methods to the public when describing the study.
There are three possible types of studies you may choose to do, when embarking on quantitative research: (a) True experiments, (b) quasi-experiments, and (c) non-experiments.
For more information to read on these types of designs, take a look at the following website and related links in it: Types of Designs .
The following flowchart should help you distinguish between the three types of study designs described below.
True Experiments.
The first two types of study designs use difference questions/hypotheses, as the independent variable for true and quasi-experiments is nominal or categorical (based on categories or groupings), as you have groups that are being compared. As seen in the flowchart above, what distinguishes a true experiment from the other two designs is a concept called "random assignment." Random assignment means that the researcher controls to which group the participants are assigned. April's study of home vs. public schooling was NOT a true experiment, because she could not control which participants were home schooled and which ones were public schooled, and instead relied on already existing groups.
An example of a true experiment reported in a communication journal is a study investigating the effects of using interest-based contemporary examples in a lecture on the history of public relations, in which the researchers had the following two hypotheses: "Lectures utilizing interest- based examples should result in more interested participants" and "Lectures utilizing interest- based examples should result in participants with higher scores on subsequent tests of cognitive recall" (Weber, Corrigan, Fornash, & Neupauer, 2003, p. 118). In this study, the 122 college student participants were randomly assigned by the researchers to one of two lecture video viewing groups: a video lecture with traditional examples and a video with contemporary examples. (To see the results of the study, look it up using your school's library databases).
A second example of a true experiment in communication is a study of the effects of viewing either a dramatic narrative television show vs. a nonnarrative television show about the consequences of an unexpected teen pregnancy. The researchers randomly assigned their 367 undergraduate participants to view one of the two types of shows.
Moyer-Gusé, E., & Nabi, R. L. (2010). Explaining the effects of narrative in an entertainment television program: Overcoming resistance to persuasion. Human Communication Research, 36 , 26-52.
A third example of a true experiment done in the field of communication can be found in the following study.
Jensen, J. D. (2008). Scientific uncertainty in news coverage of cancer research: Effects of hedging on scientists' and journalists' credibility. Human Communication Research, 34, 347-369.
In this study, Jakob Jensen had three independent variables. He randomly assigned his 601 participants to 1 of 20 possible conditions, between his three independent variables, which were (a) a hedged vs. not hedged message, (b) the source of the hedging message (research attributed to primary vs. unaffiliated scientists), and (c) specific news story employed (of which he had five randomly selected news stories about cancer research to choose from). Although this study was pretty complex, it does illustrate the true experiment in our field since the participants were randomly assigned to read a particular news story, with certain characteristics.
Quasi-Experiments.
If the researcher is not able to randomly assign participants to one of the treatment groups (or independent variable), but the participants already belong to one of them (e.g., age; home vs. public schooling), then the design is called a quasi-experiment. Here you still have an independent variable with groups, but the participants already belong to a group before the study starts, and the researcher has no control over which group they belong to.
An example of a hypothesis found in a communication study is the following: "Individuals high in trait aggression will enjoy violent content more than nonviolent content, whereas those low in trait aggression will enjoy violent content less than nonviolent content" (Weaver & Wilson, 2009, p. 448). In this study, the researchers could not assign the participants to a high or low trait aggression group since this is a personality characteristic, so this is a quasi-experiment. It does not have any random assignment of participants to the independent variable groups. Read their study, if you would like to, at the following location.
Weaver, A. J., & Wilson, B. J. (2009). The role of graphic and sanitized violence in the enjoyment of television dramas. Human Communication Research, 35 (3), 442-463.
Benoit and Hansen (2004) did not choose to randomly assign participants to groups either, in their study of a national presidential election survey, in which they were looking at differences between debate and non-debate viewers, in terms of several dependent variables, such as which candidate viewers supported. If you are interested in discovering the results of this study, take a look at the following article.
Benoit, W. L., & Hansen, G. J. (2004). Presidential debate watching, issue knowledge, character evaluation, and vote choice. Human Communication Research, 30 (1), 121-144.
Non-Experiments.
The third type of design is the non-experiment. Non-experiments are sometimes called survey designs, because their primary way of collecting data is through surveys. This is not enough to distinguish them from true experiments and quasi-experiments, however, as both of those types of designs may use surveys as well.
What makes a study a non-experiment is that the independent variable is not a grouping or categorical variable. Researchers observe or survey participants in order to describe them as they naturally exist without any experimental intervention. Researchers do not give treatments or observe the effects of a potential natural grouping variable such as age. Descriptive and relationship/association questions are most often used in non-experiments.
Some examples of this type of commonly used design for communication researchers include the following studies.
- Serota, Levine, and Boster (2010) used a national survey of 1,000 adults to determine the prevalence of lying in America (see Human Communication Research, 36 , pp. 2-25).
- Nabi (2009) surveyed 170 young adults on their perceptions of reality television on cosmetic surgery effects, looking at several things: for example, does viewing cosmetic surgery makeover programs relate to body satisfaction (p. 6), finding no significant relationship between those two variables (see Human Communication Research, 35 , pp. 1-27).
- Derlega, Winstead, Mathews, and Braitman (2008) collected stories from 238 college students on reasons why they would disclose or not disclose personal information within close relationships (see Communication Research Reports, 25 , pp. 115-130). They coded the participants' answers into categories so they could count how often specific reasons were mentioned, using a method called content analysis , to answer the following research questions:
RQ1: What are research participants' attributions for the disclosure and nondisclosure of highly personal information?
RQ2: Do attributions reflect concerns about rewards and costs of disclosure or the tension between openness with another and privacy?
RQ3: How often are particular attributions for disclosure/nondisclosure used in various types of relationships? (p. 117)
All of these non-experimental studies have in common no researcher manipulation of an independent variable or even having an independent variable that has natural groups that are being compared.
Identify which design discussed above should be used for each of the following research questions.
- Is there a difference between generations on how much they use MySpace?
- Is there a relationship between age when a person first started using Facebook and the amount of time they currently spend on Facebook daily?
- Is there a difference between potential customers' perceptions of an organization who are shown an organization's Facebook page and those who are not shown an organization's Facebook page?
[HINT: Try to identify the independent and dependent variable in each question above first, before determining what type of design you would use. Also, try to determine what type of question it is – descriptive, difference, or relationship/association.]
Answers: 1. Quasi-experiment 2. Non-experiment 3. True Experiment
Data Collection Methods
Once you decide the type of quantitative research design you will be using, you will need to determine which of the following types of data you will collect: (a) survey data, (b) observational data, and/or (c) already existing data, as in library research.
Using the survey data collection method means you will talk to people or survey them about their behaviors, attitudes, perceptions, and demographic characteristics (e.g., biological sex, socio-economic status, race). This type of data usually consists of a series of questions related to the concepts you want to study (i.e., your independent and dependent variables). Both of April's studies on home schooling and on taking adopted children on a return trip back to China used survey data.
On a survey, you can have both closed-ended and open-ended questions. Closed-ended questions, can be written in a variety of forms. Some of the most common response options include the following.
Likert responses – for example: for the following statement, ______ do you strongly agree agree neutral disagree strongly disagree
Semantic differential – for example: does the following ______ make you Happy ..................................... Sad
Yes-no answers for example: I use social media daily. Yes / No.
One site to check out for possible response options is http://www.360degreefeedback.net/media/ResponseScales.pdf .
Researchers often follow up some of their closed-ended questions with an "other" category, in which they ask their participants to "please specify," their response if none of the ones provided are applicable. They may also ask open-ended questions on "why" a participant chose a particular answer or ask participants for more information about a particular topic. If the researcher wants to use the open-ended question responses as part of his/her quantitative study, the answers are usually coded into categories and counted, in terms of the frequency of a certain answer, using a method called content analysis , which will be discussed when we talk about already-existing artifacts as a source of data.
Surveys can be done face-to-face, by telephone, mail, or online. Each of these methods has its own advantages and disadvantages, primarily in the form of the cost in time and money to do the survey. For example, if you want to survey many people, then online survey tools such as surveygizmo.com and surveymonkey.com are very efficient, but not everyone has access to taking a survey on the computer, so you may not get an adequate sample of the population by doing so. Plus you have to decide how you will recruit people to take your online survey, which can be challenging. There are trade-offs with every method.
For more information on things to consider when selecting your survey method, check out the following website:
Selecting the Survey Method .
There are also many good sources for developing a good survey, such as the following websites. Constructing the Survey Survey Methods Designing Surveys
Observation.
A second type of data collection method is observation . In this data collection method, you make observations of the phenomenon you are studying and then code your observations, so that you can count what you are studying. This type of data collection method is often called interaction analysis, if you collect data by observing people's behavior. For example, if you want to study the phenomenon of mall-walking, you could go to a mall and count characteristics of mall-walkers. A researcher in the area of health communication could study the occurrence of humor in an operating room, for example, by coding and counting the use of humor in such a setting.
One extended research study using observational data collection methods, which is cited often in interpersonal communication classes, is John Gottman's research, which started out in what is now called "The Love Lab." In this lab, researchers observe interactions between couples, including physiological symptoms, using coders who look for certain items found to predict relationship problems and success.
Take a look at the YouTube video about "The Love Lab" at the following site to learn more about the potential of using observation in collecting data for a research study: The "Love" Lab .
Already-Existing Artifacts.
The third method of quantitative data collection is the use of already-existing artifacts . With this method, you choose certain artifacts (e.g., newspaper or magazine articles; television programs; webpages) and code their content, resulting in a count of whatever you are studying. With this data collection method, researchers most often use what is called quantitative content analysis . Basically, the researcher counts frequencies of something that occurs in an artifact of study, such as the frequency of times something is mentioned on a webpage. Content analysis can also be used in qualitative research, where a researcher identifies and creates text-based themes but does not do a count of the occurrences of these themes. Content analysis can also be used to take open-ended questions from a survey method, and identify countable themes within the questions.
Content analysis is a very common method used in media studies, given researchers are interested in studying already-existing media artifacts. There are many good sources to illustrate how to do content analysis such as are seen in the box below.
See the following sources for more information on content analysis. Writing Guide: Content Analysis A Flowchart for the Typical Process of Content Analysis Research What is Content Analysis?
With content analysis and any method that you use to code something into categories, one key concept you need to remember is inter-coder or inter-rater reliability , in which there are multiple coders (at least two) trained to code the observations into categories. This check on coding is important because you need to check to make sure that the way you are coding your observations on the open-ended answers is the same way that others would code a particular item. To establish this kind of inter-coder or inter-rater reliability, researchers prepare codebooks (to train their coders on how to code the materials) and coding forms for their coders to use.
To see some examples of actual codebooks used in research, see the following website: Human Coding--Sample Materials .
There are also online inter-coder reliability calculators some researchers use, such as the following: ReCal: reliability calculation for the masses .
Regardless of which method of data collection you choose, you need to decide even more specifically how you will measure the variables in your study, which leads us to the next planning step in the design of a study.
Operationalization of Variables into Measurable Concepts
When you look at your research question/s and/or hypotheses, you should know already what your independent and dependent variables are. Both of these need to be measured in some way. We call that way of measuring operationalizing a variable. One way to think of it is writing a step by step recipe for how you plan to obtain data on this topic. How you choose to operationalize your variable (or write the recipe) is one all-important decision you have to make, which will make or break your study. In quantitative research, you have to measure your variables in a valid (accurate) and reliable (consistent) manner, which we discuss in this section. You also need to determine the level of measurement you will use for your variables, which will help you later decide what statistical tests you need to run to answer your research question/s or test your hypotheses. We will start with the last topic first.
Level of Measurement
Level of measurement has to do with whether you measure your variables using categories or groupings OR whether you measure your variables using a continuous level of measurement (range of numbers). The level of measurement that is considered to be categorical in nature is called nominal, while the levels of measurement considered to be continuous in nature are ordinal, interval, and ratio. The only ones you really need to know are nominal, ordinal, and interval/ratio.
Nominal variables are categories that do not have meaningful numbers attached to them but are broader categories, such as male and female, home schooled and public schooled, Caucasian and African-American. Ordinal variables do have numbers attached to them, in that the numbers are in a certain order, but there are not equal intervals between the numbers (e.g., such as when you rank a group of 5 items from most to least preferred, where 3 might be highly preferred, and 2 hated). Interval/ratio variables have equal intervals between the numbers (e.g., weight, age).
For more information about these levels of measurement, check out one of the following websites. Levels of Measurement Measurement Scales in Social Science Research What is the difference between ordinal, interval and ratio variables? Why should I care?
Validity and Reliability
When developing a scale/measure or survey, you need to be concerned about validity and reliability. Readers of quantitative research expect to see researchers justify their research measures using these two terms in the methods section of an article or paper.
Validity. Validity is the extent to which your scale/measure or survey adequately reflects the full meaning of the concept you are measuring. Does it measure what you say it measures? For example, if researchers wanted to develop a scale to measure "servant leadership," the researchers would have to determine what dimensions of servant leadership they wanted to measure, and then create items which would be valid or accurate measures of these dimensions. If they included items related to a different type of leadership, those items would not be a valid measure of servant leadership. When doing so, the researchers are trying to prove their measure has internal validity. Researchers may also be interested in external validity, but that has to do with how generalizable their study is to a larger population (a topic related to sampling, which we will consider in the next section), and has less to do with the validity of the instrument itself.
There are several types of validity you may read about, including face validity, content validity, criterion-related validity, and construct validity. To learn more about these types of validity, read the information at the following link: Validity .
To improve the validity of an instrument, researchers need to fully understand the concept they are trying to measure. This means they know the academic literature surrounding that concept well and write several survey questions on each dimension measured, to make sure the full idea of the concept is being measured. For example, Page and Wong (n.d.) identified four dimensions of servant leadership: character, people-orientation, task-orientation, and process-orientation ( A Conceptual Framework for Measuring Servant-Leadership ). All of these dimensions (and any others identified by other researchers) would need multiple survey items developed if a researcher wanted to create a new scale on servant leadership.
Before you create a new survey, it can be useful to see if one already exists with established validity and reliability. Such measures can be found by seeing what other respected studies have used to measure a concept and then doing a library search to find the scale/measure itself (sometimes found in the reference area of a library in books like those listed below).
Reliability . Reliability is the second criterion you will need to address if you choose to develop your own scale or measure. Reliability is concerned with whether a measurement is consistent and reproducible. If you have ever wondered why, when taking a survey, that a question is asked more than once or very similar questions are asked multiple times, it is because the researchers one concerned with proving their study has reliability. Are you, for example, answering all of the similar questions similarly? If so, the measure/scale may have good reliability or consistency over time.
Researchers can use a variety of ways to show their measure/scale is reliable. See the following websites for explanations of some of these ways, which include methods such as the test-retest method, the split-half method, and inter-coder/rater reliability. Types of Reliability Reliability
To understand the relationship between validity and reliability, a nice visual provided below is explained at the following website (Trochim, 2006, para. 2). Reliability & Validity
Self-Quiz/Discussion:
Take a look at one of the surveys found at the following poll reporting sites on a topic which interests you. Critique one of these surveys, using what you have learned about creating surveys so far.
http://www.pewinternet.org/ http://pewresearch.org/ http://www.gallup.com/Home.aspx http://www.kff.org/
One of the things you might have critiqued in the previous self-quiz/discussion may have had less to do with the actual survey itself, but rather with how the researchers got their participants or sample. How participants are recruited is just as important to doing a good study as how valid and reliable a survey is.
Imagine that in the article you chose for the last "self-quiz/discussion" you read the following quote from the Pew Research Center's Internet and American Life Project: "One in three teens sends more than 100 text messages a day, or 3000 texts a month" (Lenhart, 2010, para.5). How would you know whether you could trust this finding to be true? Would you compare it to what you know about texting from your own and your friends' experiences? Would you want to know what types of questions people were asked to determine this statistic, or whether the survey the statistic is based on is valid and reliable? Would you want to know what type of people were surveyed for the study? As a critical consumer of research, you should ask all of these types of questions, rather than just accepting such a statement as undisputable fact. For example, if only people shopping at an Apple Store were surveyed, the results might be skewed high.
In particular, related to the topic of this section, you should ask about the sampling method the researchers did. Often, the researchers will provide information related to the sample, stating how many participants were surveyed (in this case 800 teens, aged 12-17, who were a nationally representative sample of the population) and how much the "margin of error" is (in this case +/- 3.8%). Why do they state such things? It is because they know the importance of a sample in making the case for their findings being legitimate and credible. Margin of error is how much we are confident that our findings represent the population at large. The larger the margin of error, the less likely it is that the poll or survey is accurate. Margin of error assumes a 95% confidence level that what we found from our study represents the population at large.
For more information on margin of error, see one of the following websites. Answers.com Margin of Error Stats.org Margin of Error Americanresearchgroup.com Margin of Error [this last site is a margin of error calculator, which shows that margin of error is directly tied to the size of your sample, in relationship to the size of the population, two concepts we will talk about in the next few paragraphs]
In particular, this section focused on sampling will talk about the following topics: (a) the difference between a population vs. a sample; (b) concepts of error and bias, or "it's all about significance"; (c) probability vs. non-probability sampling; and (d) sample size issues.
Population vs. Sample
When doing quantitative studies, such as the study of cell phone usage among teens, you are never able to survey the entire population of teenagers, so you survey a portion of the population. If you study every member of a population, then you are conducting a census such as the United States Government does every 10 years. When, however, this is not possible (because you do not have the money the U.S. government has!), you attempt to get as good a sample as possible.
Characteristics of a population are summarized in numerical form, and technically these numbers are called parameters . However, numbers which summarize the characteristics of a sample are called statistics .
Error and Bias
If a sample is not done well, then you may not have confidence in how the study's results can be generalized to the population from which the sample was taken. Your confidence level is often stated as the margin of error of the survey. As noted earlier, a study's margin of error refers to the degree to which a sample differs from the total population you are studying. In the Pew survey, they had a margin of error of +/- 3.8%. So, for example, when the Pew survey said 33% of teens send more than 100 texts a day, the margin of error means they were 95% sure that 29.2% - 36.8% of teens send this many texts a day.
Margin of error is tied to sampling error , which is how much difference there is between your sample's results and what would have been obtained if you had surveyed the whole population. Sample error is linked to a very important concept for quantitative researchers, which is the notion of significance . Here, significance does not refer to whether some finding is morally or practically significant, it refers to whether a finding is statistically significant, meaning the findings are not due to chance but actually represent something that is found in the population. Statistical significance is about how much you, as the researcher, are willing to risk saying you found something important and be wrong.
For the difference between statistical significance and practical significance, see the following YouTube video: Statistical and Practical Significance .
Scientists set certain arbitrary standards based on the probability they could be wrong in reporting their findings. These are called significance levels and are commonly reported in the literature as p <.05 or p <.01 or some other probability (or p ) level.
If an article says a statistical test reported that p < .05 , it simply means that they are most likely correct in what they are saying, but there is a 5% chance they could be wrong and not find the same results in the population. If p < .01, then there would be only a 1% chance they were wrong and would not find the same results in the population. The lower the probability level, the more certain the results.
When researchers are wrong, or make that kind of decision error, it often implies that either (a) their sample was biased and was not representative of the true population in some way, or (b) that something they did in collecting the data biased the results. There are actually two kinds of sampling error talked about in quantitative research: Type I and Type II error. Type 1 error is what happens when you think you found something statistically significant and claim there is a significant difference or relationship, when there really is not in the actual population. So there is something about your sample that made you find something that is not in the actual population. (Type I error is the same as the probability level, or .05, if using the traditional p-level accepted by most researchers.) Type II error happens when you don't find a statistically significant difference or relationship, yet there actually is one in the population at large, so once again, your sample is not representative of the population.
For more information on these two types of error, check out the following websites. Hypothesis Testing: Type I Error, Type II Error Type I and Type II Errors - Making Mistakes in the Justice System
Researchers want to select a sample that is representative of the population in order to reduce the likelihood of having a sample that is biased. There are two types of bias particularly troublesome for researchers, in terms of sampling error. The first type is selection bias , in which each person in the population does not have an equal chance to be chosen for the sample, which happens frequently in communication studies, because we often rely on convenience samples (whoever we can get to complete our surveys). The second type of bias is response bias , in which those who volunteer for a study have different characteristics than those who did not volunteer for the study, another common challenge for communication researchers. Volunteers for a study may very well be different from persons who choose not to volunteer for a study, so that you have a biased sample by relying just on volunteers, which is not representative of the population from which you are trying to sample.
Probability vs. Non-Probability Sampling
One of the best ways to lower your sampling error and reduce the possibility of bias is to do probability or random sampling. This means that every person in the population has an equal chance of being selected to be in your sample. Another way of looking at this is to attempt to get a representative sample, so that the characteristics of your sample closely approximate those of the population. A sample needs to contain essentially the same variations that exist in the population, if possible, especially on the variables or elements that are most important to you (e.g., age, biological sex, race, level of education, socio-economic class).
There are many different ways to draw a probability/random sample from the population. Some of the most common are a simple random sample , where you use a random numbers table or random number generator to select your sample from the population.
There are several examples of random number generators available online. See the following example of an online random number generator: http://www.randomizer.org/ .
A systematic random sample takes every n-th number from the population, depending on how many people you would like to have in your sample. A stratified random sample does random sampling within groups, and a multi-stage or cluster sample is used when there are multiple groups within a large area and a large population, and the researcher does random sampling in stages.
If you are interested in understanding more about these types of probability/random samples, take a look at the following website: Probability Sampling .
However, many times communication researchers use whoever they can find to participate in their study, such as college students in their classes since these people are easily accessible. Many of the studies in interpersonal communication and relationship development, for example, used this type of sample. This is called a convenience sample. In doing so, they are using a non- probability or non-random sample. In these types of samples, each member of the population does not have an equal opportunity to be selected. For example, if you decide to ask your facebook friends to participate in an online survey you created about how college students in the U.S. use cell phones to text, you are using a non-random type of sample. You are unable to randomly sample the whole population in the U.S. of college students who text, so you attempt to find participants more conveniently. Some common non-random or non-probability samples are:
- accidental/convenience samples, such as the facebook example illustrates
- quota samples, in which you do convenience samples within subgroups of the population, such as biological sex, looking for a certain number of participants in each group being compared
- snowball or network sampling, where you ask current participants to send your survey onto their friends.
For more information on non-probability sampling, see the following website: Nonprobability Sampling .
Researchers, such as communication scholars, often use these types of samples because of the nature of their research. Most research designs used in communication are not true experiments, such as would be required in the medical field where they are trying to prove some cause-effect relationship to cure or alleviate symptoms of a disease. Most communication scholars recognize that human behavior in communication situations is much less predictable, so they do not adhere to the strictest possible worldview related to quantitative methods and are less concerned with having to use probability sampling.
They do recognize, however, that with either probability or non-probability sampling, there is still the possibility of bias and error, although much less with probability sampling. That is why all quantitative researchers, regardless of field, will report statistical significance levels if they are interested in generalizing from their sample to the population at large, to let the readers of their work know how confident they are in their results.
Size of Sample
The larger the sample, the more likely the sample is going to be representative of the population. If there is a lot of variability in the population (e.g., lots of different ethnic groups in the population), a researcher will need a larger sample. If you are interested in detecting small possible differences (e.g., in a close political race), you need a larger sample. However, the bigger your population, the less you have to increase the size of your sample in order to have an adequate sample, as is illustrated by an example sample size calculator such as can be found at http://www.raosoft.com/samplesize.html .
Using the example sample size calculator, see how you might determine how large of a sample you might need in order to study how college students in the U.S. use texting on their cell phones. You would have to first determine approximately how many college students are in the U.S. According to ANEKI, there are a little over 14,000,000 college students in the U.S. ( Countries with the Most University Students ). When inputting that figure into the sample size calculator below (using no commas for the population size), you would need a sample size of approximately 385 students. If the population size was 20,000, you would need a sample of 377 students. If the population was only 2,000, you would need a sample of 323. For a population of 500, you would need a sample of 218.
It is not enough, however, to just have an adequate or large sample. If there is bias in the sampling, you can have a very bad large sample, one that also does not represent the population at large. So, having an unbiased sample is even more important than having a large sample.
So, what do you do, if you cannot reasonably conduct a probability or random sample? You run statistics which report significance levels, and you report the limitations of your sample in the discussion section of your paper/article.
Pilot Testing Methods
Now that we have talked about the different elements of your study design, you should try out your methods by doing a pilot test of some kind. This means that you try out your procedures with someone to try to catch any mistakes in your design before you start collecting data from actual participants in your study. This will save you time and money in the long run, along with unneeded angst over mistakes you made in your design during data collection. There are several ways you might do this.
You might ask an expert who knows about this topic (such as a faculty member) to try out your experiment or survey and provide feedback on what they think of your design. You might ask some participants who are like your potential sample to take your survey or be a part of your pilot test; then you could ask them which parts were confusing or needed revising. You might have potential participants explain to you what they think your questions mean, to see if they are interpreting them like you intended, or if you need to make some questions clearer.
The main thing is that you do not just assume your methods will work or are the best type of methods to use until you try them out with someone. As you write up your study, in your methods section of your paper, you can then talk about what you did to change your study based on the pilot study you did.
Institutional Review Board (IRB) Approval
The last step of your planning takes place when you take the necessary steps to get your study approved by your institution's review board. As you read in chapter 3, this step is important if you are planning on using the data or results from your study beyond just the requirements for your class project. See chapter 3 for more information on the procedures involved in this step.
Conclusion: Study Design Planning
Once you have decided what topic you want to study, you plan your study. Part 1 of this chapter has covered the following steps you need to follow in this planning process:
- decide what type of study you will do (i.e., experimental, quasi-experimental, non- experimental);
- decide on what data collection method you will use (i.e., survey, observation, or already existing data);
- operationalize your variables into measureable concepts;
- determine what type of sample you will use (probability or non-probability);
- pilot test your methods; and
- get IRB approval.
At that point, you are ready to commence collecting your data, which is the topic of the next section in this chapter.
Research Guide
Chapter 4 research writing, 4.1 structure.
In this section, I focus on the main stages of the research writing process. Most of these concepts have been beautifully explained by Varanya Chaubey (2018) .We will be focusing on the book, but in this section, I compile some of the most interesting ideas and link them to other important aspects to consider when structuring an argument. Some of this material is structured with more detail on Laura Belcher’s book Writing your Journal Article in Twelve Weeks .
4.2 The Three Layer Method
Once we have found our research question and we obtained and processed the data we need to conduct our analysis, we need to write our results.
This method asks us to work from the general ideas to the details, using a descending structure , or a Three layer method .
This method is a 3-step process in which we start working by laying a foundation of the main project and build upon it. The concept is simple: we need to understand what we are doing, why and how before even immersing in the writing process. Otherwise, we will lose sight of the main objective. The process is straightforward and quite intuitive. I introduce the three stages of the process here and explain each of them below.
- Step 1: What are you saying?: This is the main argument that you are making. It is important to figure out if you actually have an argument. But I’ll come back to this point.
- Step 2: Express with an outline. You need to include additional information surrounding your argument, so the readers can answer follow-up questions and have additional details linked to your research question.
- Step 3: Develop your ideas in a draft. Once you have identified your main argument and have an outline, you need to structure the paragraphs in each section.
4.2.1 The Argument
Belcher (2019) defines an argument as: “your article’s most important idea sated in one or two sentences early and clearly in your article […], emerging from a theory and supported with evidence to convince the reader of its validity.”
This may sound trivial, but it is harder than it seems. Many times, we believe we already have an argument, but we really do not. Instead, we have sentences that are tautological or we are simply rephrasing a fact that is accepted by everyone. Therefore, Belcher proposes a set of tests to ensure that you actually have an argument (I am adapting the list for the purposes of this Guide):
Agree/disagree : Do we need evidence to agree or disagree with a particular statement? For instance, we do not need further evidence to the statement ‘The Earth is round’. But we may need evidence on the statement “Prep school is fundamental to children’s cognitive development.”
Dispute test : When a given statement can be the source of disagreement, then it seems that you may indeed have an argument. For instance, “Poorer people are less supportive of redistribution” (AEP, 2021)
Puzzle answer test : If your statement is providing a response to a question that people have about the world or their environment, you may have an argument.
Another important element is to differentiate your argument from your topic. The topic is the major issue you are interested in, whereas your argument explains the main finding (or initially, the hypothesis) of your paper.
Following the research question, an argument needs to be puzzling. It needs to provide relevant information that help us understand the world a little bit more. This is why your argument (as well as your research question) needs to go beyond the basic facts. It needs to provide enough detail as to make it interesting for a larger audience. This also entails that you need to provide more information than naming the main variables in your analysis (x causes Y). You need to specify the conditions and context that make this statement to hold.
Some other elements to consider when structuring your argument is to avoid including normative statements and speculations, More specifically, for quantitative papers:
Avoid including causal claims when the evidence does not allow you to do that . Causal analysis is key in our field, but correlations are important as well and they provide a value to understand our context a little bit more.
4.2.1.1 Finding your RAP
R : Have different versions of your research question to see what is the clearest way to introduce it to your readers.
P : This represents how you position the paper in the literature. This is constructed based on your literature review and the theory behind your question.
These three elements are interconnected. You need to find the best way to bring them all together and work with them to convey your argument.
4.2.2 Express your Ideas using an Outline
An empirical, quantitative, paper in economics (and political science) usually contains the following sections:
- Introduction
- Context (Literature Review) 4a. Theoretical papers contain mathematical models (we will not use those) 4b. Empirical Strategy
- Robustness checks and potential mechanisms (we will not focus on those)
- Final discussion (Conclusion)
We will talk more about each of these sections, but here, the main point to consider is that you need to create an outline that conveys the most important points of each section.
This is, after you have a clear argument, now you need to provide an answer to different questions that the readers may have. This is done by creating the headings and subheadings of each section. For instance, in a paper on mining in the Democratic Republic of the Congo (DRC), readers may be interested in learning why is mining important in the country and what types of mining take place in the country. This means that I need a general section on the context of mining in the DRC and then include subheadings explaining the different types of mining that I analyze.
You will do that for each section. In your outline, include the headings and subheadings, and a short paragraph indicating the main message of the section. This will then be enriched by secondary paragraphs.
Having this structure will allow you to include those sections that add value to your final paper and remove any additional information that is not key to support your main argument.
4.2.2.1 Drafting
Once you have your headings and subheadings, as well as the most important takeaways, it is time for you to start populating your paper. In the next section, I mention some of the elements that you need to include in the research paper. Here again, it is important that you plan the information that you will include and that each paragraph has a purpose, answering a question that is relevant to further your argument. Go for the general to the particular details.
The main thing to consider is that readers have very limited time and span of attention. You need to convey the main message at the beginning of the paper. Then, for each section, the main idea needs to be included in the first paragraph(s). Develop just one idea per paragraph and ensure that the main message is contained at the beginning.
Writing is an iterative process and you probably will spend more time rewriting a section than what you spent writing it for the first time. Don’t despair! We all go through the same process and you will get there. Just ensure that you structure and organize your process.
Academic research and writing
A concise introduction
Chapter 4 – Primer
Chapter 4 introduces you to the research process and its cornerstones. Every research project starts with an open-ended indirect research question, which is implicitly or explicitly accompanied by a research hypothesis. Often a research problem is substantiated by an ad-hoc hypothesis, which advances to a working hypothesis and ultimately will be developed into a scientific hypothesis. The logic and quality of hypotheses can differ and determine the success of the research process. Depending on their inner logic, scientific hypotheses can be formulated as cause-effect hypotheses, distribution hypotheses, correlation hypotheses and difference hypotheses. Based on their quality, scientific hypotheses can be differentiated into nomological hypotheses, quasi-nomological hypotheses and statistical hypotheses. The research approach has to match the research problem to be investigated. Literature-based research, theoretical research, developmental research, quantitative research, qualitative research or a mixture of the aforementioned approaches provide means to tackle a research problem at hand. Different academic disciplines favour different scientific styles that predetermine the applicable research approaches. Three general types of scientific styles are introduced and critically reflected: the theoretical solution-driven style, the empirical solution-driven style and the hypothesis-driven style.
Share this:
- Click to share on Twitter (Opens in new window)
- Click to share on Facebook (Opens in new window)
- Click to share on LinkedIn (Opens in new window)
- Click to share on Pinterest (Opens in new window)
- Click to share on Tumblr (Opens in new window)
- Click to share on Reddit (Opens in new window)
- Click to share on Pocket (Opens in new window)
- Click to email a link to a friend (Opens in new window)
- Click to print (Opens in new window)
- Welcome to Chapter 4
Quick Guides
Irb data collection closure, data collection and analysis software, chapter 4 webinars.
- Qualtrics Survey Tool
- Statistics Help This link opens in a new window
- Statistics and APA Format This link opens in a new window
- Analysis and Coding Example- Qualitative Data
- Trustworthiness of Qualitative Data
- Hypothesis Testing This link opens in a new window
Jump to DSE Guide
Need help ask us.

- Qualitative Data Analysis Tips and Strategies Students can use this short guide to get started in analyzing qualitative data.
- Quantitative Data Analysis Tips and Strategies Students can use this short guide to get started in analyzing quantitative data.
- Data Collection Verification Form The IRB Study Closure will be submitted in the Doctoral Record after approval from the student’s doctoral committee.
- Data Collection Verification Form Example The sample Data Collection Verification Form can help guide students on how to complete the form before submitting.
- Example Instruments and Tools for Data Collection Students can use this quick list of instruments and tools when considering how to collect and analyze data.
- NVivo Access Instructions for NCUOne Users Students and faculty in NCUOne - Use this job aid to guide you in accessing your free copy of NVivo for qualitative data analysis.
- NVivo FAQs Refer to the NVivo FAQs while installing the software
- SPSS Access Instructions NCUOne students - Use this job aid to guide you in accessing your free copy of SPSS for quantitative data analysis.
- SPSS License Renewal Step-by-step instructions for NCUOne students to renew their license for SPSS.
- SPSS Version Upgrade Instructions Step-by-step instructions for NCUOne students to update to Version 29, the latest version that is now available.
Note: Doctoral students taking courses in NU Brightspace can find directions on how to download NVivo and SPSS in the NU Library Connection . Find the NU Library Connection in your course list and then navigate to the Data Analysis Software for Doctoral Students sub-module within the Research Help module.
- Next: Qualtrics Survey Tool >>
- Last Updated: Apr 19, 2024 3:09 PM
- URL: https://resources.nu.edu/c.php?g=1007180

Chapter 4. Finding a Research Question and Approaches to Qualitative Research
We’ve discussed the research design process in general and ways of knowing favored by qualitative researchers. In chapter 2, I asked you to think about what interests you in terms of a focus of study, including your motivations and research purpose. It might be helpful to start this chapter with those short paragraphs you wrote about motivations and purpose in front of you. We are now going to try to develop those interests into actual research questions (first part of this chapter) and then choose among various “traditions of inquiry” that will be best suited to answering those questions. You’ve already been introduced to some of this (in chapter 1), but we will go further here.

Developing a Research Question
Research questions are different from general questions people have about the social world. They are narrowly tailored to fit a very specific issue, complete with context and time boundaries. Because we are engaged in empirical science and thus use “data” to answer our questions, the questions we ask must be answerable by data. A question is not the same as stating a problem. The point of the entire research project is to answer a particular question or set of questions. The question(s) should be interesting, relevant, practical, and ethical. Let’s say I am generally interested in the problem of student loan debt. That’s a good place to start, but we can’t simply ask,
General question: Is student loan debt really a problem today?
How could we possibly answer that question? What data could we use? Isn’t this really an axiological (values-based) question? There are no clues in the question as to what data would be appropriate here to help us get started. Students often begin with these large unanswerable questions. They are not research questions. Instead, we could ask,
Poor research question: How many people have debt?
This is still not a very good research question. Why not? It is answerable, although we would probably want to clarify the context. We could add some context to improve it so that the question now reads,
Mediocre research question: How many people in the US have debt today? And does this amount vary by age and location?
Now we have added some context, so we have a better idea of where to look and who to look at. But this is still a pretty poor or mediocre research question. Why is that? Let’s say we did answer it. What would we really know? Maybe we would find out that student loan debt has increased over time and that young people today have more of it. We probably already know this. We don’t really want to go through a lot of trouble answering a question whose answer we already have. In fact, part of the reason we are even asking this question is that we know (or think) it is a problem. Instead of asking what you already know, ask a question to which you really do not know the answer. I can’t stress this enough, so I will say it again: Ask a question to which you do not already know the answer . The point of research is not to prove or make a point but to find out something unknown. What about student loan debt is still a mystery to you? Reviewing the literature could help (see chapter 9). By reviewing the literature, you can get a good sense of what is still mysterious or unknown about student loan debt, and you won’t be reinventing the wheel when you conduct your research. Let’s say you review the literature, and you are struck by the fact that we still don’t understand the true impact of debt on how people are living their lives. A possible research question might be,
Fair research question: What impact does student debt have on the lives of debtors?
Good start, but we still need some context to help guide the project. It is not nearly specific enough.
Better research question: What impact does student debt have on young adults (ages twenty-five to thirty-five) living in the US today?
Now we’ve added context, but we can still do a little bit better in narrowing our research question so that it is both clear and doable; in other words, we want to frame it in a way that provides a very clear research program:
Optimal research question: How do young adults (ages twenty-five to thirty-five) living in the US today who have taken on $30,000 or more in student debt describe the impact of their debt on their lives in terms of finding/choosing a job, buying a house, getting married, and other major life events?
Now you have a research question that can be answered and a clear plan of how to answer it. You will talk to young adults living in the US today who have high debt loads and ask them to describe the impacts of debt on their lives. That is all now in the research question. Note how different this very specific question is from where we started with the “problem” of student debt.
Take some time practicing turning the following general questions into research questions:
- What can be done about the excessive use of force by police officers?
- Why haven’t societies taken firmer steps to address climate change?
- How do communities react to / deal with the opioid epidemic?
- Who has been the most adversely affected by COVID?
- When did political polarization get so bad?
Hint: Step back from each of the questions and try to articulate a possible underlying motivation, then formulate a research question that is specific and answerable.
It is important to take the time to come up with a research question, even if this research question changes a bit as you conduct your research (yes, research questions can change!). If you don’t have a clear question to start your research, you are likely to get very confused when designing your study because you will not be able to make coherent decisions about things like samples, sites, methods of data collection, and so on. Your research question is your anchor: “If we don’t have a question, we risk the possibility of going out into the field thinking we know what we’ll find and looking only for proof of what we expect to be there. That’s not empirical research (it’s not systematic)” ( Rubin 2021:37 ).
Researcher Note
How do you come up with ideas for what to study?
I study what surprises me. Usually, I come across a statistic that suggests something is common that I thought was rare. I tend to think it’s rare because the theories I read suggest it should be, and there’s not a lot of work in that area that helps me understand how the statistic came to be. So, for example, I learned that it’s common for Americans to marry partners who grew up in a different class than them and that about half of White kids born into the upper-middle class are downwardly mobile. I was so shocked by these facts that they naturally led to research questions. How do people come to marry someone who grew up in a different class? How do White kids born near the top of the class structure fall?
—Jessi Streib, author of The Power of the Past and Privilege Lost
What if you have literally no idea what the research question should be? How do you find a research question? Even if you have an interest in a topic before you get started, you see the problem now: topics and issues are not research questions! A research question doesn’t easily emerge; it takes a lot of time to hone one, as the practice above should demonstrate. In some research designs, the research question doesn’t even get clearly articulated until the end of data collection . More on that later. But you must start somewhere, of course. Start with your chosen discipline. This might seem obvious, but it is often overlooked. There is a reason it is called a discipline. We tend to think of “sociology,” “public health,” and “physics” as so many clusters of courses that are linked together by subject matter, but they are also disciplines in the sense that the study of each focuses the mind in a particular way and for particular ends. For example, in my own field, sociology, there is a loosely shared commitment to social justice and a general “sociological imagination” that enables its practitioners to connect personal experiences to society at large and to historical forces. It is helpful to think of issues and questions that are germane to your discipline. Within that overall field, there may be a particular course or unit of study you found most interesting. Within that course or unit of study, there may be an issue that intrigued you. And finally, within that issue, there may be an aspect or topic that you want to know more about.
When I was pursuing my dissertation research, I was asked often, “Why did you choose to study intimate partner violence among Native American women?” This question is necessary, and each time I answered, it helped shape me into a better researcher. I was interested in intimate partner violence because I am a survivor. I didn’t have intentions to work with a particular population or demographic—that came from my own deep introspection on my role as a researcher. I always questioned my positionality: What privileges do I hold as an academic? How has public health extracted information from institutionally marginalized populations? How can I build bridges between communities using my position, knowledge, and power? Public health as a field would not exist without the contributions of Indigenous people. So I started hanging out with them at community events, making friends, and engaging in self-education. Through these organic relationships built with Native women in the community, I saw that intimate partner violence was a huge issue. This led me to partner with Indigenous organizations to pursue a better understanding of how Native survivors of intimate partner violence seek support.
—Susanna Y. Park, PhD, mixed-methods researcher in public health and author of “How Native Women Seek Support as Survivors of Intimate Partner Violence: A Mixed-Methods Study”
One of the most exciting and satisfying things about doing academic research is that whatever you end up researching can become part of the body of knowledge that we have collectively created. Don’t make the mistake of thinking that you are doing this all on your own from scratch. Without even being aware of it, no matter if you are a first-year undergraduate student or a fourth-year graduate student, you have been trained to think certain questions are interesting. The very fact that you are majoring in a particular field or have signed up for years of graduate study in a program testifies to some level of commitment to a discipline. What we are looking for, ideally, is that your research builds on in some way (as extension, as critique, as lateral move) previous research and so adds to what we, collectively, understand about the social world. It is helpful to keep this in mind, as it may inspire you and also help guide you through the process. The point is, you are not meant to be doing something no one has ever thought of before, even if you are trying to find something that does not exactly duplicate previous research: “You may be trying to be too clever—aiming to come up with a topic unique in the history of the universe, something that will have people swooning with admiration at your originality and intellectual precociousness. Don’t do it. It’s safer…to settle on an ordinary, middle-of-the-road topic that will lend itself to a nicely organized process of project management. That’s the clever way of proceeding.… You can always let your cleverness shine through during the stages of design, analysis, and write-up. Don’t make things more difficult for yourself than you need to do” ( Davies 2007:20 ).
Rubin ( 2021 ) suggests four possible ways to develop a research question (there are many more, of course, but this can get you started). One way is to start with a theory that interests you and then select a topic where you can apply that theory. For example, you took a class on gender and society and learned about the “glass ceiling.” You could develop a study that tests that theory in a setting that has not yet been explored—maybe leadership at the Oregon Country Fair. The second way is to start with a topic that interests you and then go back to the books to find a theory that might explain it. This is arguably more difficult but often much more satisfying. Ask your professors for help—they might have ideas of theories or concepts that could be relevant or at least give you an idea of what books to read. The third way is to be very clever and select a question that already combines the topic and the theory. Rubin gives as one example sentencing disparities in criminology—this is both a topic and a theory or set of theories. You then just have to figure out particulars like setting and sample. I don’t know if I find this third way terribly helpful, but it might help you think through the possibilities. The fourth way involves identifying a puzzle or a problem, which can be either theoretical (something in the literature just doesn’t seem to make sense and you want to tackle addressing it) or empirical (something happened or is happening, and no one really understands why—think, for example, of mass school shootings).
Once you think you have an issue or topic that is worth exploring, you will need to (eventually) turn that into a good research question. A good research question is specific, clear, and feasible .
Specific . How specific a research question needs to be is somewhat related to the disciplinary conventions and whether the study is conceived inductively or deductively. In deductive research, one begins with a specific research question developed from the literature. You then collect data to test the theory or hypotheses accompanying your research question. In inductive research, however, one begins with data collection and analysis and builds theory from there. So naturally, the research question is a bit vaguer. In general, the more closely aligned to the natural sciences (and thus the deductive approach), the more a very tight and specific research question (along with specific, focused hypotheses) is required. This includes disciplines like psychology, geography, public health, environmental science, and marine resources management. The more one moves toward the humanities pole (and the inductive approach), the more looseness is permitted, as there is a general belief that we go into the field to find what is there, not necessarily what we imagine we are looking for (see figure 4.2). Disciplines such as sociology, anthropology, and gender and sexuality studies and some subdisciplines of public policy/public administration are closer to the humanities pole in this sense.

Regardless of discipline and approach, however, it is a good idea for beginning researchers to create a research question as specific as possible, as this will serve as your guide throughout the process. You can tweak it later if needed, but start with something specific enough that you know what it is you are doing and why. It is more difficult to deal with ambiguity when you are starting out than later in your career, when you have a better handle on what you are doing. Being under a time constraint means the more specific the question, the better. Questions should always specify contexts, geographical locations, and time frames. Go back to your practice research questions and make sure that these are included.
Clear . A clear research question doesn’t only need to be intelligible to any reader (which, of course, it should); it needs to clarify any meanings of particular words or concepts (e.g., What is excessive force?). Check all your concepts to see if there are ways you can clarify them further—for example, note that we shifted from impact of debt to impact of high debt load and specified this as beginning at $30,000. Ideally, we would use the literature to help us clarify what a high debt load is or how to define “excessive” force.
Feasible . In order to know if your question is feasible, you are going to have to think a little bit about your entire research design. For example, a question that asks about the real-time impact of COVID restrictions on learning outcomes would require a time machine. You could tweak the question to ask instead about the long-term impacts of COVID restrictions, as measured two years after their end. Or let’s say you are interested in assessing the damage of opioid abuse on small-town communities across the United States. Is it feasible to cover the entire US? You might need a team of researchers to do this if you are planning on on-the-ground observations. Perhaps a case study of one particular community might be best. Then your research question needs to be changed accordingly.
Here are some things to consider in terms of feasibility:
- Is the question too general for what you actually intend to do or examine? (Are you specifying the world when you only have time to explore a sliver of that world?)
- Is the question suitable for the time you have available? (You will need different research questions for a study that can be completed in a term than one where you have one to two years, as in a master’s program, or even three to eight years, as in a doctoral program.)
- Is the focus specific enough that you know where and how to begin?
- What are the costs involved in doing this study, including time? Will you need to travel somewhere, and if so, how will you pay for it?
- Will there be problems with “access”? (More on this in later chapters, but for now, consider how you might actually find people to interview or places to observe and whether gatekeepers exist who might keep you out.)
- Will you need to submit an application proposal for your university’s IRB (institutional review board)? If you are doing any research with live human subjects, you probably need to factor in the time and potential hassle of an IRB review (see chapter 8). If you are under severe time constraints, you might need to consider developing a research question that can be addressed with secondary sources, online content, or historical archives (see chapters 16 and 17).
In addition to these practicalities, you will also want to consider the research question in terms of what is best for you now. Are you engaged in research because you are required to be—jumping a hurdle for a course or for your degree? If so, you really do want to think about your project as training and develop a question that will allow you to practice whatever data collection and analysis techniques you want to develop. For example, if you are a grad student in a public health program who is interested in eventually doing work that requires conducting interviews with patients, develop a research question and research design that is interview based. Focus on the practicality (and practice) of the study more than the theoretical impact or academic contribution, in other words. On the other hand, if you are a PhD candidate who is seeking an academic position in the future, your research question should be pitched in a way to build theoretical knowledge as well (the phrasing is typically “original contribution to scholarship”).
The more time you have to devote to the study and the larger the project, the more important it is to reflect on your own motivations and goals when crafting a research question (remember chapter 2?). By “your own motivations and goals,” I mean what interests you about the social world and what impact you want your research to have, both academically and practically speaking. Many students have secret (or not-so-secret) plans to make the world a better place by helping address climate change, pointing out pressure points to fight inequities, or bringing awareness to an overlooked area of concern. My own work in graduate school was motivated by the last of these three—the not-so-secret goal of my research was to raise awareness about obstacles to success for first-generation and working-class college students. This underlying goal motivated me to complete my dissertation in a timely manner and then to further continue work in this area and see my research get published. I cared enough about the topic that I was not ready to put it away. I am still not ready to put it away. I encourage you to find topics that you can’t put away, ever. That will keep you going whenever things get difficult in the research process, as they inevitably will.
On the other hand, if you are an undergraduate and you really have very little time, some of the best advice I have heard is to find a study you really like and adapt it to a new context. Perhaps you read a study about how students select majors and how this differs by class ( Hurst 2019 ). You can try to replicate the study on a small scale among your classmates. Use the same research question, but revise for your context. You can probably even find the exact questions I used and ask them in the new sample. Then when you get to the analysis and write-up, you have a comparison study to guide you, and you can say interesting things about the new context and whether the original findings were confirmed (similar) or not. You can even propose reasons why you might have found differences between one and the other.
Another way of thinking about research questions is to explicitly tie them to the type of purpose of your study. Of course, this means being very clear about what your ultimate purpose is! Marshall and Rossman ( 2016 ) break down the purpose of a study into four categories: exploratory, explanatory, descriptive, and emancipatory ( 78 ). Exploratory purpose types include wanting to investigate little-understood phenomena, or identifying or discovering important new categories of meaning, or generating hypotheses for further research. For these, research questions might be fairly loose: What is going on here? How are people interacting on this site? What do people talk about when you ask them about the state of the world? You are almost (but never entirely) starting from scratch. Be careful though—just because a topic is new to you does not mean it is really new. Someone else (or many other someones) may already have done this exploratory research. Part of your job is to find this out (more on this in “What Is a ‘Literature Review’?” in chapter 9). Descriptive purposes (documenting and describing a phenomenon) are similar to exploratory purposes but with a much clearer goal (description). A good research question for a descriptive study would specify the actions, events, beliefs, attitudes, structures, and/or processes that will be described.
Most researchers find that their topic has already been explored and described, so they move to trying to explain a relationship or phenomenon. For these, you will want research questions that capture the relationships of interest. For example, how does gender influence one’s understanding of police brutality (because we already know from the literature that it does, so now we are interested in understanding how and why)? Or what is the relationship between education and climate change denialism? If you find that prior research has already provided a lot of evidence about those relationships as well as explanations for how they work, and you want to move the needle past explanation into action, you might find yourself trying to conduct an emancipatory study. You want to be even more clear in acknowledging past research if you find yourself here. Then create a research question that will allow you to “create opportunities and the will to engage in social action” ( Marshall and Rossman 2016:78 ). Research questions might ask, “How do participants problematize their circumstances and take positive social action?” If we know that some students have come together to fight against student debt, how are they doing this, and with what success? Your purpose would be to help evaluate possibilities for social change and to use your research to make recommendations for more successful emancipatory actions.
Recap: Be specific. Be clear. Be practical. And do what you love.
Choosing an Approach or Tradition
Qualitative researchers may be defined as those who are working with data that is not in numerical form, but there are actually multiple traditions or approaches that fall under this broad category. I find it useful to know a little bit about the history and development of qualitative research to better understand the differences in these approaches. The following chart provides an overview of the six phases of development identified by Denzin and Lincoln ( 2005 ):
Table 4.1. Six Phases of Development
There are other ways one could present the history as well. Feminist theory and methodologies came to the fore in the 1970s and 1980s and had a lot to do with the internal critique of more positivist approaches. Feminists were quite aware that standpoint matters—that the identity of the researcher plays a role in the research, and they were ardent supporters of dismantling unjust power systems and using qualitative methods to help advance this mission. You might note, too, that many of the internal disputes were basically epistemological disputes about how we know what we know and whether one’s social location/position delimits that knowledge. Today, we are in a bountiful world of qualitative research, one that embraces multiple forms of knowing and knowledge. This is good, but it means that you, the student, have more choice when it comes to situating your study and framing your research question, and some will expect you to signal the choices you have made in any research protocols you write or publications and presentations.
Creswell’s ( 1998 ) definition of qualitative research includes the notion of distinct traditions of inquiry: “Qualitative research is an inquiry process of understanding based on distinct methodological traditions of inquiry that explore a social or human problem. The research builds complex, holistic pictures, analyzes words, reports detailed views of informants , and conducted the study in a natural setting” (15; emphases added). I usually caution my students against taking shelter under one of these approaches, as, practically speaking, there is a lot of mixing of traditions among researchers. And yet it is useful to know something about the various histories and approaches, particularly as you are first starting out. Each tradition tends to favor a particular epistemological perspective (see chapter 3), a way of reasoning (see “ Advanced: Inductive versus Deductive Reasoning ”), and a data-collection technique.
There are anywhere from ten to twenty “traditions of inquiry,” depending on how one draws the boundaries. In my accounting, there are twelve, but three approaches tend to dominate the field.
Ethnography
Ethnography was developed from the discipline of anthropology, as the study of (other) culture(s). From a relatively positivist/objective approach to writing down the “truth” of what is observed during the colonial era (where this “truth” was then often used to help colonial administrators maintain order and exploit people and extract resources more effectively), ethnography was adopted by all kinds of social science researchers to get a better understanding of how groups of people (various subcultures and cultures) live their lives. Today, ethnographers are more likely to be seeking to dismantle power relations than to support them. They often study groups of people that are overlooked and marginalized, and sometimes they do the obverse by demonstrating how truly strange the familiar practices of the dominant group are. Ethnography is also central to organizational studies (e.g., How does this institution actually work?) and studies of education (e.g., What is it like to be a student during the COVID era?).
Ethnographers use methods of participant observation and intensive fieldwork in their studies, often living or working among the group under study for months at a time (and, in some cases, years). I’ve called this “deep ethnography,” and it is the subject of chapter 14. The data ethnographers analyze are copious “field notes” written while in the field, often supplemented by in-depth interviews and many more casual conversations. The final product of ethnographers is a “thick” description of the culture. This makes reading ethnographies enjoyable, as the goal is to write in such a way that the reader feels immersed in the culture.
There are variations on the ethnography, such as the autoethnography , where the researcher uses a systematic and rigorous study of themselves to better understand the culture in which they find themselves. Autoethnography is a relatively new approach, even though it is derived from one of the oldest approaches. One can say that it takes to heart the feminist directive to “make the personal political,” to underscore the connections between personal experiences and larger social and political structures. Introspection becomes the primary data source.
Grounded Theory
Grounded Theory holds a special place in qualitative research for a few reasons, not least of which is that nonqualitative researchers often mistakenly believe that Grounded Theory is the only qualitative research methodology . Sometimes, it is easier for students to explain what they are doing as “Grounded Theory” because it sounds “more scientific” than the alternative descriptions of qualitative research. This is definitely part of its appeal. Grounded Theory is the name given to the systematic inductive approach first developed by Glaser and Strauss in 1967, The Discovery of Grounded Theory: Strategies for Qualitative Research . Too few people actually read Glaser and Strauss’s book. It is both groundbreaking and fairly unremarkable at the same time. As a historical intervention into research methods generally, it is both a sharp critique of positivist methods in the social sciences (theory testing) and a rejection of purely descriptive accounts-building qualitative research. Glaser and Strauss argued for an approach whose goal was to construct (middle-level) theories from recursive data analysis of nonnumerical data (interviews and observations). They advocated a “constant comparative method” in which coding and analysis take place simultaneously and recursively. The demands are fairly strenuous. If done correctly, the result is the development of a new theory about the social world.
So why do I call this “fairly unremarkable”? To some extent, all qualitative research already does what Glaser and Strauss ( 1967 ) recommend, albeit without denoting the processes quite so specifically. As will be seen throughout the rest of this textbook, all qualitative research employs some “constant comparisons” through recursive data analyses. Where Grounded Theory sets itself apart from a significant number of qualitative research projects, however, is in its dedication to inductively building theory. Personally, I think it is important to understand that Glaser and Strauss were rejecting deductive theory testing in sociology when they first wrote their book. They were part of a rising cohort who rejected the positivist mathematical approaches that were taking over sociology journals in the 1950s and 1960s. Here are some of the comments and points they make against this kind of work:
Accurate description and verification are not so crucial when one’s purpose is to generate theory. ( 28 ; further arguing that sampling strategies are different when one is not trying to test a theory or generalize results)
Illuminating perspectives are too often suppressed when the main emphasis is verifying theory. ( 40 )
Testing for statistical significance can obscure from theoretical relevance. ( 201 )
Instead, they argued, sociologists should be building theories about the social world. They are not physicists who spend time testing and refining theories. And they are not journalists who report descriptions. What makes sociologists better than journalists and other professionals is that they develop theory from their work “In their driving efforts to get the facts [research sociologists] tend to forget that the distinctive offering of sociology to our society is sociological theory, not research description” ( 30–31 ).
Grounded Theory’s inductive approach can be off-putting to students who have a general research question in mind and a working hypothesis. The true Grounded Theory approach is often used in exploratory studies where there are no extant theories. After all, the promise of this approach is theory generation, not theory testing. Flying totally free at the start can be terrifying. It can also be a little disingenuous, as there are very few things under the sun that have not been considered before. Barbour ( 2008:197 ) laments that this approach is sometimes used because the researcher is too lazy to read the relevant literature.
To summarize, Glaser and Strauss justified the qualitative research project in a way that gave it standing among the social sciences, especially vis-à-vis quantitative researchers. By distinguishing the constant comparative method from journalism, Glaser and Strauss enabled qualitative research to gain legitimacy.
So what is it exactly, and how does one do it? The following stages provide a succinct and basic overview, differentiating the portions that are similar to/in accordance with qualitative research methods generally and those that are distinct from the Grounded Theory approach:
Step 1. Select a case, sample, and setting (similar—unless you begin with a theory to test!).
Step 2. Begin data collection (similar).
Step 3. Engage data analysis (similar in general but specificity of details somewhat unique to Grounded Theory): (1) emergent coding (initial followed by focused), (2) axial (a priori) coding , (3) theoretical coding , (4) creation of theoretical categories; analysis ends when “theoretical saturation ” has been achieved.
Grounded Theory’s prescriptive (i.e., it has a set of rules) framework can appeal to beginning students, but it is unnecessary to adopt the entire approach in order to make use of some of its suggestions. And if one does not exactly follow the Grounded Theory rulebook, it can mislead others if you tend to call what you are doing Grounded Theory when you are not:
Grounded theory continues to be a misunderstood method, although many researchers purport to use it. Qualitative researchers often claim to conduct grounded theory studies without fully understanding or adopting its distinctive guidelines. They may employ one or two of the strategies or mistake qualitative analysis for grounded theory. Conversely, other researchers employ grounded theory methods in reductionist, mechanistic ways. Neither approach embodies the flexible yet systematic mode of inquiry, directed but open-ended analysis, and imaginative theorizing from empirical data that grounded theory methods can foster. Subsequently, the potential of grounded theory methods for generating middle-range theory has not been fully realized ( Charmaz 2014 ).
Phenomenology
Where Grounded Theory sets itself apart for its inductive systematic approach to data analysis, phenomenologies are distinct for their focus on what is studied—in this case, the meanings of “lived experiences” of a group of persons sharing a particular event or circumstance. There are phenomenologies of being working class ( Charlesworth 2000 ), of the tourist experience ( Cohen 1979 ), of Whiteness ( Ahmed 2007 ). The phenomenon of interest may also be an emotion or circumstance. One can study the phenomenon of “White rage,” for example, or the phenomenon of arranged marriage.
The roots of phenomenology lie in philosophy (Husserl, Heidegger, Merleau-Ponty, Sartre) but have been adapted by sociologists in particular. Phenomenologists explore “how human beings make sense of experience and transform experience into consciousness, both individually and as shared meaning” ( Patton 2002:104 ).
One of the most important aspects of conducting a good phenomenological study is getting the sample exactly right so that each person can speak to the phenomenon in question. Because the researcher is interested in the meanings of an experience, in-depth interviews are the preferred method of data collection. Observations are not nearly as helpful here because people may do a great number of things without meaning to or without being conscious of their implications. This is important to note because phenomenologists are studying not “the reality” of what happens at all but an articulated understanding of a lived experience. When reading a phenomenological study, it is important to keep this straight—too often I have heard students critique a study because the interviewer didn’t actually see how people’s behavior might conflict with what they say (which is, at heart, an epistemological issue!).
In addition to the “big three,” there are many other approaches; some are variations, and some are distinct approaches in their own right. Case studies focus explicitly on context and dynamic interactions over time and can be accomplished with quantitative or qualitative methods or a mixture of both (for this reason, I am not considering it as one of the big three qualitative methods, even though it is a very common approach). Whatever methods are used, a contextualized deep understanding of the case (or cases) is central.
Critical inquiry is a loose collection of techniques held together by a core argument that understanding issues of power should be the focus of much social science research or, to put this another way, that it is impossible to understand society (its people and institutions) without paying attention to the ways that power relations and power dynamics inform and deform those people and institutions. This attention to power dynamics includes how research is conducted too. All research fundamentally involves issues of power. For this reason, many critical inquiry traditions include a place for collaboration between researcher and researched. Examples include (1) critical narrative analysis, which seeks to describe the meaning of experience for marginalized or oppressed persons or groups through storytelling; (2) participatory action research, which requires collaboration between the researcher and the research subjects or community of interest; and (3) critical race analysis, a methodological application of Critical Race Theory (CRT), which posits that racial oppression is endemic (if not always throughout time and place, at least now and here).
Do you follow a particular tradition of inquiry? Why?
Shawn Wilson’s book, Research Is Ceremony: Indigenous Research Methods , is my holy grail. It really flipped my understanding of research and relationships. Rather than thinking linearly and approaching research in a more canonical sense, Wilson shook my world view by drawing me into a pattern of inquiry that emphasized transparency and relational accountability. The Indigenous research paradigm is applicable in all research settings, and I follow it because it pushes me to constantly evaluate my position as a knowledge seeker and knowledge sharer.
Autoethnography takes the researcher as the subject. This is one approach that is difficult to explain to more quantitatively minded researchers, as it seems to violate many of the norms of “scientific research” as understood by them. First, the sample size is quite small—the n is 1, the researcher. Two, the researcher is not a neutral observer—indeed, the subjectivity of the researcher is the main strength of this approach. Autoethnographies can be extremely powerful for their depth of understanding and reflexivity, but they need to be conducted in their own version of rigor to stand up to scrutiny by skeptics. If you are skeptical, read one of the excellent published examples out there—I bet you will be impressed with what you take away. As they say, the proof is in the pudding on this approach.
Advanced: Inductive versus Deductive Reasoning
There has been a great deal of ink shed in the discussion of inductive versus deductive approaches, not all of it very instructive. Although there is a huge conceptual difference between them, in practical terms, most researchers cycle between the two, even within the same research project. The simplest way to explain the difference between the two is that we are using deductive reasoning when we test an existing theory (move from general to particular), and we are using inductive reasoning when we are generating theory (move from particular to general). Figure 4.2 provides a schematic of the deductive approach. From the literature, we select a theory about the impact of student loan debt: student loan debt will delay homeownership among young adults. We then formulate a hypothesis based on this theory: adults in their thirties with high debt loads will be less likely to own homes than their peers who do not have high debt loads. We then collect data to test the hypothesis and analyze the results. We find that homeownership is substantially lower among persons of color and those who were the first in their families to graduate from college. Notably, high debt loads did not affect homeownership among White adults whose parents held college degrees. We thus refine the theory to match the new findings: student debt loads delay homeownership among some young adults, thereby increasing inequalities in this generation. We have now contributed new knowledge to our collective corpus.
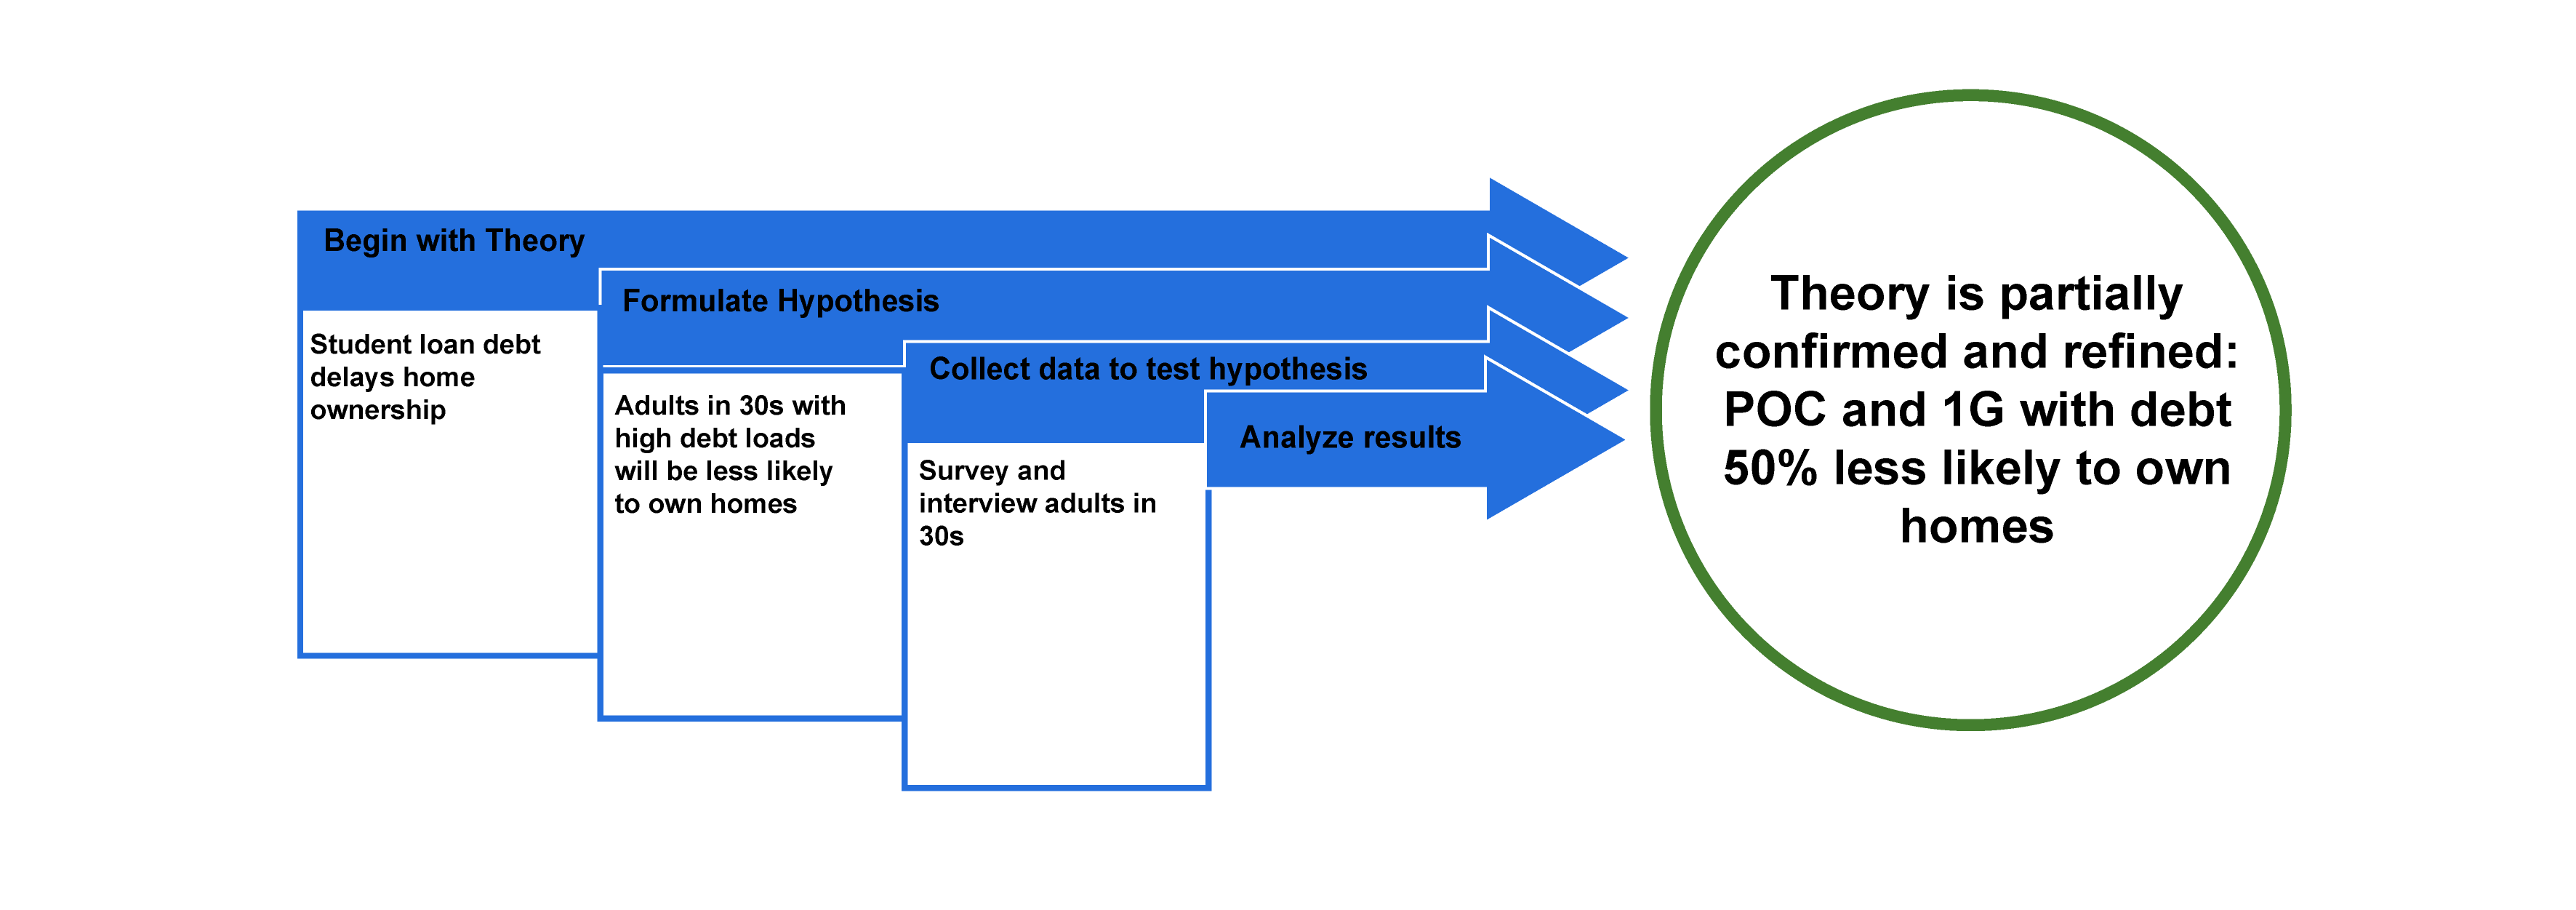
The inductive approach is contrasted in figure 4.3. Here, we did not begin with a preexisting theory or previous literature but instead began with an observation. Perhaps we were conducting interviews with young adults who held high amounts of debt and stumbled across this observation, struck by how many were renting apartments or small houses. We then noted a pattern—not all the young adults we were talking to were renting; race and class seemed to play a role here. We would then probably expand our study in a way to be able to further test this developing theory, ensuring that we were not seeing anomalous patterns. Once we were confident about our observations and analyses, we would then develop a theory, coming to the same place as our deductive approach, but in reverse.
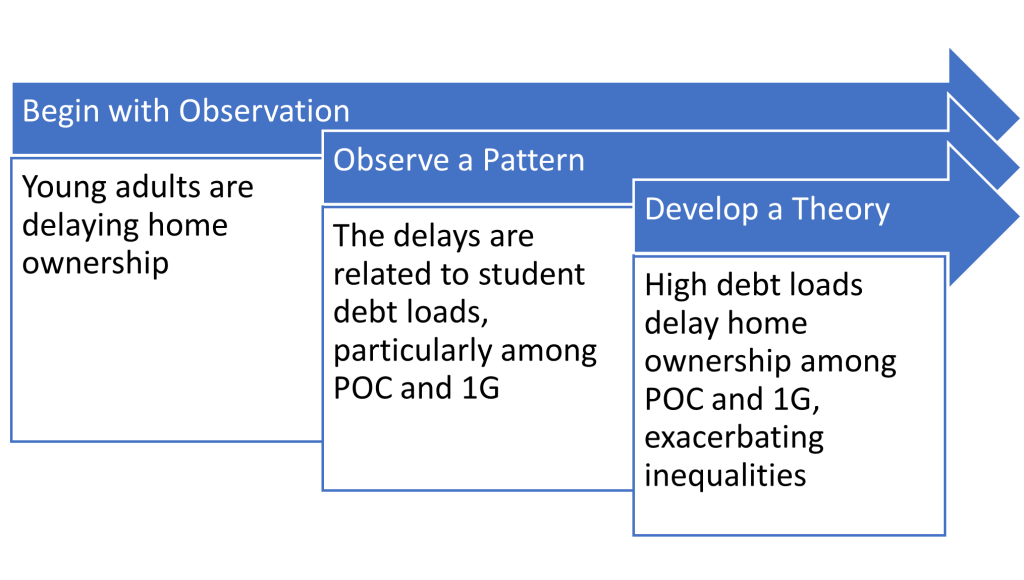
A third form of reasoning, abductive (sometimes referred to as probabilistic reasoning) was developed in the late nineteenth century by American philosopher Charles Sanders Peirce. I have included some articles for further reading for those interested.
Among social scientists, the deductive approach is often relaxed so that a research question is set based on the existing literature rather than creating a hypothesis or set of hypotheses to test. Some journals still require researchers to articulate hypotheses, however. If you have in mind a publication, it is probably a good idea to take a look at how most articles are organized and whether specific hypotheses statements are included.
Table 4.2. Twelve Approaches. Adapted from Patton 2002:132-133.
Further Readings
The following readings have been examples of various approaches or traditions of inquiry:
Ahmed, Sara. 2007. “A Phenomenology of Whiteness.” Feminist Theory 8(2):149–168.
Charlesworth, Simon. 2000. A Phenomenology of Working-Class Experience . Cambridge: Cambridge University Press.*
Clandinin, D. Jean, and F. Michael Connelly. 2000. Narrative Inquiry: Experience and Story in Qualitative Research . San Francisco: Jossey-Bass.
Cohen, E. 1979. “A Phenomenology of Tourist Experiences.” Sociology 13(2):179–201.
Cooke, Bill, and Uma Kothari, eds. 2001. Participation: The New Tyranny? London: Zed Books. A critique of participatory action.
Corbin, Juliet, and Anselm Strauss. 2008. Basics of Qualitative Research: Techniques and Procedures for Developing Grounded Theory . 3rd ed. Thousand Oaks, CA: SAGE.
Crabtree, B. F., and W. L. Miller, eds. 1999. Doing Qualitative Research: Multiple Strategies . Thousand Oaks, CA: SAGE.
Creswell, John W. 1997. Qualitative Inquiry and Research Design: Choosing among Five Approaches. Thousand Oaks, CA: SAGE.
Glaser, Barney G., and Anselm Strauss. 1967. The Discovery of Grounded Theory: Strategies for Qualitative Research . New York: Aldine.
Gobo, Giampetro, and Andrea Molle. 2008. Doing Ethnography . Thousand Oaks, CA: SAGE.
Hancock, Dawson B., and Bob Algozzine. 2016. Doing Case Study Research: A Practical Guide for Beginning Research . 3rd ed. New York: Teachers College Press.
Harding, Sandra. 1987. Feminism and Methodology . Bloomington: Indiana University Press.
Husserl, Edmund. (1913) 2017. Ideas: Introduction to Pure Phenomenology . Eastford, CT: Martino Fine Books.
Rose, Gillian. 2012. Visual Methodologies . 3rd ed. London: SAGE.
Van der Riet, M. 2009. “Participatory Research and the Philosophy of Social Science: Beyond the Moral Imperative.” Qualitative Inquiry 14(4):546–565.
Van Manen, Max. 1990. Researching Lived Experience: Human Science for an Action Sensitive Pedagogy . Albany: State University of New York.
Wortham, Stanton. 2001. Narratives in Action: A Strategy for Research and Analysis . New York: Teachers College Press.
Inductive, Deductive, and Abductive Reasoning and Nomothetic Science in General
Aliseda, Atocha. 2003. “Mathematical Reasoning vs. Abductive Reasoning: A Structural Approach.” Synthese 134(1/2):25–44.
Bonk, Thomas. 1997. “Newtonian Gravity, Quantum Discontinuity and the Determination of Theory by Evidence.” Synthese 112(1):53–73. A (natural) scientific discussion of inductive reasoning.
Bonnell, Victoria E. 1980. “The Uses of Theory, Concepts and Comparison in Historical Sociology.” C omparative Studies in Society and History 22(2):156–173.
Crane, Mark, and Michael C. Newman. 1996. “Scientific Method in Environmental Toxicology.” Environmental Reviews 4(2):112–122.
Huang, Philip C. C., and Yuan Gao. 2015. “Should Social Science and Jurisprudence Imitate Natural Science?” Modern China 41(2):131–167.
Mingers, J. 2012. “Abduction: The Missing Link between Deduction and Induction. A Comment on Ormerod’s ‘Rational Inference: Deductive, Inductive and Probabilistic Thinking.’” Journal of the Operational Research Society 63(6):860–861.
Ormerod, Richard J. 2010. “Rational Inference: Deductive, Inductive and Probabilistic Thinking.” Journal of the Operational Research Society 61(8):1207–1223.
Perry, Charner P. 1927. “Inductive vs. Deductive Method in Social Science Research.” Southwestern Political and Social Science Quarterly 8(1):66–74.
Plutynski, Anya. 2011. “Four Problems of Abduction: A Brief History.” HOPOS: The Journal of the International Society for the History of Philosophy of Science 1(2):227–248.
Thompson, Bruce, and Gloria M. Borrello. 1992. “Different Views of Love: Deductive and Inductive Lines of Inquiry.” Current Directions in Psychological Science 1(5):154–156.
Tracy, Sarah J. 2012. “The Toxic and Mythical Combination of a Deductive Writing Logic for Inductive Qualitative Research.” Qualitative Communication Research 1(1):109–141.
A place or collection containing records, documents, or other materials of historical interest; most universities have an archive of material related to the university’s history, as well as other “special collections” that may be of interest to members of the community.
A person who introduces the researcher to a field site’s culture and population. Also referred to as guides. Used in ethnography .
A form of research and a methodological tradition of inquiry in which the researcher uses self-reflection and writing to explore personal experiences and connect this autobiographical story to wider cultural, political, and social meanings and understandings. “Autoethnography is a research method that uses a researcher's personal experience to describe and critique cultural beliefs, practices, and experiences” ( Adams, Jones, and Ellis 2015 ).
The philosophical framework in which research is conducted; the approach to “research” (what practices this entails, etc.). Inevitably, one’s epistemological perspective will also guide one’s methodological choices, as in the case of a constructivist who employs a Grounded Theory approach to observations and interviews, or an objectivist who surveys key figures in an organization to find out how that organization is run. One of the key methodological distinctions in social science research is that between quantitative and qualitative research.
The process of labeling and organizing qualitative data to identify different themes and the relationships between them; a way of simplifying data to allow better management and retrieval of key themes and illustrative passages. See coding frame and codebook.
A later stage coding process used in Grounded Theory in which data is reassembled around a category, or axis.
A later stage-coding process used in Grounded Theory in which key words or key phrases capture the emergent theory.
The point at which you can conclude data collection because every person you are interviewing, the interaction you are observing, or content you are analyzing merely confirms what you have already noted. Achieving saturation is often used as the justification for the final sample size.
A methodological tradition of inquiry that focuses on the meanings held by individuals and/or groups about a particular phenomenon (e.g., a “phenomenology of whiteness” or a “phenomenology of first-generation college students”). Sometimes this is referred to as understanding “the lived experience” of a particular group or culture. Interviews form the primary tool of data collection for phenomenological studies. Derived from the German philosophy of phenomenology (Husserl 1913; 2017).
The number of individuals (or units) included in your sample
A form of reasoning which employs a “top-down” approach to drawing conclusions: it begins with a premise or hypothesis and seeks to verify it (or disconfirm it) with newly collected data. Inferences are made based on widely accepted facts or premises. Deduction is idea-first, followed by observations and a conclusion. This form of reasoning is often used in quantitative research and less often in qualitative research. Compare to inductive reasoning . See also abductive reasoning .
A form of reasoning that employs a “bottom-up” approach to drawing conclusions: it begins with the collection of data relevant to a particular question and then seeks to build an argument or theory based on an analysis of that data. Induction is observation first, followed by an idea that could explain what has been observed. This form of reasoning is often used in qualitative research and seldom used in qualitative research. Compare to deductive reasoning . See also abductive reasoning .
An “interpretivist” form of reasoning in which “most likely” conclusions are drawn, based on inference. This approach is often used by qualitative researchers who stress the recursive nature of qualitative data analysis. Compare with deductive reasoning and inductive reasoning .
A form of social science research that generally follows the scientific method as established in the natural sciences. In contrast to idiographic research , the nomothetic researcher looks for general patterns and “laws” of human behavior and social relationships. Once discovered, these patterns and laws will be expected to be widely applicable. Quantitative social science research is nomothetic because it seeks to generalize findings from samples to larger populations. Most qualitative social science research is also nomothetic, although generalizability is here understood to be theoretical in nature rather than statistical . Some qualitative researchers, however, espouse the idiographic research paradigm instead.
Introduction to Qualitative Research Methods Copyright © 2023 by Allison Hurst is licensed under a Creative Commons Attribution-ShareAlike 4.0 International License , except where otherwise noted.
- U.S. Locations
- UMGC Europe
- Learn Online
- Find Answers
- 855-655-8682
- Current Students
Online Guide to Writing and Research
The research process, explore more of umgc.
- Online Guide to Writing
Structuring the Research Paper
Formal research structure.
These are the primary purposes for formal research:
enter the discourse, or conversation, of other writers and scholars in your field
learn how others in your field use primary and secondary resources
find and understand raw data and information

For the formal academic research assignment, consider an organizational pattern typically used for primary academic research. The pattern includes the following: introduction, methods, results, discussion, and conclusions/recommendations.
Usually, research papers flow from the general to the specific and back to the general in their organization. The introduction uses a general-to-specific movement in its organization, establishing the thesis and setting the context for the conversation. The methods and results sections are more detailed and specific, providing support for the generalizations made in the introduction. The discussion section moves toward an increasingly more general discussion of the subject, leading to the conclusions and recommendations, which then generalize the conversation again.
Sections of a Formal Structure
The introduction section.
Many students will find that writing a structured introduction gets them started and gives them the focus needed to significantly improve their entire paper.
Introductions usually have three parts:
presentation of the problem statement, the topic, or the research inquiry
purpose and focus of your paper
summary or overview of the writer’s position or arguments
In the first part of the introduction—the presentation of the problem or the research inquiry—state the problem or express it so that the question is implied. Then, sketch the background on the problem and review the literature on it to give your readers a context that shows them how your research inquiry fits into the conversation currently ongoing in your subject area.
In the second part of the introduction, state your purpose and focus. Here, you may even present your actual thesis. Sometimes your purpose statement can take the place of the thesis by letting your reader know your intentions.
The third part of the introduction, the summary or overview of the paper, briefly leads readers through the discussion, forecasting the main ideas and giving readers a blueprint for the paper.
The following example provides a blueprint for a well-organized introduction.
Example of an Introduction
Entrepreneurial Marketing: The Critical Difference
In an article in the Harvard Business Review, John A. Welsh and Jerry F. White remind us that “a small business is not a little big business.” An entrepreneur is not a multinational conglomerate but a profit-seeking individual. To survive, he must have a different outlook and must apply different principles to his endeavors than does the president of a large or even medium-sized corporation. Not only does the scale of small and big businesses differ, but small businesses also suffer from what the Harvard Business Review article calls “resource poverty.” This is a problem and opportunity that requires an entirely different approach to marketing. Where large ad budgets are not necessary or feasible, where expensive ad production squanders limited capital, where every marketing dollar must do the work of two dollars, if not five dollars or even ten, where a person’s company, capital, and material well-being are all on the line—that is, where guerrilla marketing can save the day and secure the bottom line (Levinson, 1984, p. 9).
By reviewing the introductions to research articles in the discipline in which you are writing your research paper, you can get an idea of what is considered the norm for that discipline. Study several of these before you begin your paper so that you know what may be expected. If you are unsure of the kind of introduction your paper needs, ask your professor for more information. The introduction is normally written in present tense.
THE METHODS SECTION
The methods section of your research paper should describe in detail what methodology and special materials if any, you used to think through or perform your research. You should include any materials you used or designed for yourself, such as questionnaires or interview questions, to generate data or information for your research paper. You want to include any methodologies that are specific to your particular field of study, such as lab procedures for a lab experiment or data-gathering instruments for field research. The methods section is usually written in the past tense.
THE RESULTS SECTION
How you present the results of your research depends on what kind of research you did, your subject matter, and your readers’ expectations.
Quantitative information —data that can be measured—can be presented systematically and economically in tables, charts, and graphs. Quantitative information includes quantities and comparisons of sets of data.
Qualitative information , which includes brief descriptions, explanations, or instructions, can also be presented in prose tables. This kind of descriptive or explanatory information, however, is often presented in essay-like prose or even lists.
There are specific conventions for creating tables, charts, and graphs and organizing the information they contain. In general, you should use them only when you are sure they will enlighten your readers rather than confuse them. In the accompanying explanation and discussion, always refer to the graphic by number and explain specifically what you are referring to; you can also provide a caption for the graphic. The rule of thumb for presenting a graphic is first to introduce it by name, show it, and then interpret it. The results section is usually written in the past tense.
THE DISCUSSION SECTION
Your discussion section should generalize what you have learned from your research. One way to generalize is to explain the consequences or meaning of your results and then make your points that support and refer back to the statements you made in your introduction. Your discussion should be organized so that it relates directly to your thesis. You want to avoid introducing new ideas here or discussing tangential issues not directly related to the exploration and discovery of your thesis. The discussion section, along with the introduction, is usually written in the present tense.
THE CONCLUSIONS AND RECOMMENDATIONS SECTION
Your conclusion ties your research to your thesis, binding together all the main ideas in your thinking and writing. By presenting the logical outcome of your research and thinking, your conclusion answers your research inquiry for your reader. Your conclusions should relate directly to the ideas presented in your introduction section and should not present any new ideas.
You may be asked to present your recommendations separately in your research assignment. If so, you will want to add some elements to your conclusion section. For example, you may be asked to recommend a course of action, make a prediction, propose a solution to a problem, offer a judgment, or speculate on the implications and consequences of your ideas. The conclusions and recommendations section is usually written in the present tense.
Key Takeaways
- For the formal academic research assignment, consider an organizational pattern typically used for primary academic research.
- The pattern includes the following: introduction, methods, results, discussion, and conclusions/recommendations.
Mailing Address: 3501 University Blvd. East, Adelphi, MD 20783 This work is licensed under a Creative Commons Attribution-NonCommercial-ShareAlike 4.0 International License . © 2022 UMGC. All links to external sites were verified at the time of publication. UMGC is not responsible for the validity or integrity of information located at external sites.
Table of Contents: Online Guide to Writing
Chapter 1: College Writing
How Does College Writing Differ from Workplace Writing?
What Is College Writing?
Why So Much Emphasis on Writing?
Chapter 2: The Writing Process
Doing Exploratory Research
Getting from Notes to Your Draft
Introduction
Prewriting - Techniques to Get Started - Mining Your Intuition
Prewriting: Targeting Your Audience
Prewriting: Techniques to Get Started
Prewriting: Understanding Your Assignment
Rewriting: Being Your Own Critic
Rewriting: Creating a Revision Strategy
Rewriting: Getting Feedback
Rewriting: The Final Draft
Techniques to Get Started - Outlining
Techniques to Get Started - Using Systematic Techniques
Thesis Statement and Controlling Idea
Writing: Getting from Notes to Your Draft - Freewriting
Writing: Getting from Notes to Your Draft - Summarizing Your Ideas
Writing: Outlining What You Will Write
Chapter 3: Thinking Strategies
A Word About Style, Voice, and Tone
A Word About Style, Voice, and Tone: Style Through Vocabulary and Diction
Critical Strategies and Writing
Critical Strategies and Writing: Analysis
Critical Strategies and Writing: Evaluation
Critical Strategies and Writing: Persuasion
Critical Strategies and Writing: Synthesis
Developing a Paper Using Strategies
Kinds of Assignments You Will Write
Patterns for Presenting Information
Patterns for Presenting Information: Critiques
Patterns for Presenting Information: Discussing Raw Data
Patterns for Presenting Information: General-to-Specific Pattern
Patterns for Presenting Information: Problem-Cause-Solution Pattern
Patterns for Presenting Information: Specific-to-General Pattern
Patterns for Presenting Information: Summaries and Abstracts
Supporting with Research and Examples
Writing Essay Examinations
Writing Essay Examinations: Make Your Answer Relevant and Complete
Writing Essay Examinations: Organize Thinking Before Writing
Writing Essay Examinations: Read and Understand the Question
Chapter 4: The Research Process
Planning and Writing a Research Paper
Planning and Writing a Research Paper: Ask a Research Question
Planning and Writing a Research Paper: Cite Sources
Planning and Writing a Research Paper: Collect Evidence
Planning and Writing a Research Paper: Decide Your Point of View, or Role, for Your Research
Planning and Writing a Research Paper: Draw Conclusions
Planning and Writing a Research Paper: Find a Topic and Get an Overview
Planning and Writing a Research Paper: Manage Your Resources
Planning and Writing a Research Paper: Outline
Planning and Writing a Research Paper: Survey the Literature
Planning and Writing a Research Paper: Work Your Sources into Your Research Writing
Research Resources: Where Are Research Resources Found? - Human Resources
Research Resources: What Are Research Resources?
Research Resources: Where Are Research Resources Found?
Research Resources: Where Are Research Resources Found? - Electronic Resources
Research Resources: Where Are Research Resources Found? - Print Resources
Structuring the Research Paper: Formal Research Structure
Structuring the Research Paper: Informal Research Structure
The Nature of Research
The Research Assignment: How Should Research Sources Be Evaluated?
The Research Assignment: When Is Research Needed?
The Research Assignment: Why Perform Research?
Chapter 5: Academic Integrity
Academic Integrity
Giving Credit to Sources
Giving Credit to Sources: Copyright Laws
Giving Credit to Sources: Documentation
Giving Credit to Sources: Style Guides
Integrating Sources
Practicing Academic Integrity
Practicing Academic Integrity: Keeping Accurate Records
Practicing Academic Integrity: Managing Source Material
Practicing Academic Integrity: Managing Source Material - Paraphrasing Your Source
Practicing Academic Integrity: Managing Source Material - Quoting Your Source
Practicing Academic Integrity: Managing Source Material - Summarizing Your Sources
Types of Documentation
Types of Documentation: Bibliographies and Source Lists
Types of Documentation: Citing World Wide Web Sources
Types of Documentation: In-Text or Parenthetical Citations
Types of Documentation: In-Text or Parenthetical Citations - APA Style
Types of Documentation: In-Text or Parenthetical Citations - CSE/CBE Style
Types of Documentation: In-Text or Parenthetical Citations - Chicago Style
Types of Documentation: In-Text or Parenthetical Citations - MLA Style
Types of Documentation: Note Citations
Chapter 6: Using Library Resources
Finding Library Resources
Chapter 7: Assessing Your Writing
How Is Writing Graded?
How Is Writing Graded?: A General Assessment Tool
The Draft Stage
The Draft Stage: The First Draft
The Draft Stage: The Revision Process and the Final Draft
The Draft Stage: Using Feedback
The Research Stage
Using Assessment to Improve Your Writing
Chapter 8: Other Frequently Assigned Papers
Reviews and Reaction Papers: Article and Book Reviews
Reviews and Reaction Papers: Reaction Papers
Writing Arguments
Writing Arguments: Adapting the Argument Structure
Writing Arguments: Purposes of Argument
Writing Arguments: References to Consult for Writing Arguments
Writing Arguments: Steps to Writing an Argument - Anticipate Active Opposition
Writing Arguments: Steps to Writing an Argument - Determine Your Organization
Writing Arguments: Steps to Writing an Argument - Develop Your Argument
Writing Arguments: Steps to Writing an Argument - Introduce Your Argument
Writing Arguments: Steps to Writing an Argument - State Your Thesis or Proposition
Writing Arguments: Steps to Writing an Argument - Write Your Conclusion
Writing Arguments: Types of Argument
Appendix A: Books to Help Improve Your Writing
Dictionaries
General Style Manuals
Researching on the Internet
Special Style Manuals
Writing Handbooks
Appendix B: Collaborative Writing and Peer Reviewing
Collaborative Writing: Assignments to Accompany the Group Project
Collaborative Writing: Informal Progress Report
Collaborative Writing: Issues to Resolve
Collaborative Writing: Methodology
Collaborative Writing: Peer Evaluation
Collaborative Writing: Tasks of Collaborative Writing Group Members
Collaborative Writing: Writing Plan
General Introduction
Peer Reviewing
Appendix C: Developing an Improvement Plan
Working with Your Instructor’s Comments and Grades
Appendix D: Writing Plan and Project Schedule
Devising a Writing Project Plan and Schedule
Reviewing Your Plan with Others
By using our website you agree to our use of cookies. Learn more about how we use cookies by reading our Privacy Policy .
Research Approach
- First Online: 01 January 2014
Cite this chapter

- Patrick Planing 2
2114 Accesses
The present chapter is aimed at specifying the methods and procedures for collecting and analysing data within the empirical part of the research project. In a first step, this chapter will discuss the author’s philosophical approach towards the research questions. Based on the author’s epistemology in alignment with the research problem, appropriate methodologies for data collection will be discussed. Finally, a research design will be proposed and justified, including multiple research steps and incorporating different methodological approaches.
This is a preview of subscription content, log in via an institution to check access.
Access this chapter
- Available as PDF
- Read on any device
- Instant download
- Own it forever
- Compact, lightweight edition
- Dispatched in 3 to 5 business days
- Free shipping worldwide - see info
Tax calculation will be finalised at checkout
Purchases are for personal use only
Institutional subscriptions
Unable to display preview. Download preview PDF.
Author information
Authors and affiliations.
Business Innovation, Daimler AG, Stuttgart, Germany
Patrick Planing
You can also search for this author in PubMed Google Scholar
Corresponding author
Correspondence to Patrick Planing .
Rights and permissions
Reprints and permissions
Copyright information
© 2014 Springer Fachmedien Wiesbaden
About this chapter
Planing, P. (2014). Research Approach. In: Innovation Acceptance. Springer Gabler, Wiesbaden. https://doi.org/10.1007/978-3-658-05005-4_4
Download citation
DOI : https://doi.org/10.1007/978-3-658-05005-4_4
Published : 08 February 2014
Publisher Name : Springer Gabler, Wiesbaden
Print ISBN : 978-3-658-05004-7
Online ISBN : 978-3-658-05005-4
eBook Packages : Business and Economics Business and Management (R0)
Share this chapter
Anyone you share the following link with will be able to read this content:
Sorry, a shareable link is not currently available for this article.
Provided by the Springer Nature SharedIt content-sharing initiative
- Publish with us
Policies and ethics
- Find a journal
- Track your research

- 76,583 Views
How To Write Chapter Four Of Your Final Year Project (Data Analysis And Presentation) | ResearchWap Blog
- Posted: Monday, 06 July 2020
- By: ResearchWap Admin
Easiest steps to write chapter four of your final year project effectively and perfectly with ease.
In writing the final year project, Students at times find it difficult to document their findings properly. In every research project, chapter four is the heart of the research work and sometimes, supervisors do not even start the reading of the research work from chapter one, but they jump to chapter four because that is the chapter that tells the reader all that was done, the instrument you used, how you analyzed your data and finally your findings.
The purpose of this chapter four in your final year project is to summarize the collected data and the statistical treatment, and or mechanics of analysis. The first paragraph should briefly restate the problem, taken from Chapter one, and explain the object of each experiment, question, or objective, point out salient results, and present those results by the table, figure, or other forms of summarized data. Select tables and figures carefully. Some studies are easier to defend if all the raw data is in this chapter; some are better if the bulk of the raw data is in an appendix.
Also, read this article - Step By Step Guide To Write A Good Research Proposal
Chapter four of a Qualitative Research work carries different titles such as ‘Analysis of Data’, ‘Results of Study’, ‘Analysis and Results’ and so forth but the keywords are ‘analysis’ and ‘results’ which implies that you have ‘analyzed’ the raw data and presenting the ‘results’ or what you discovered in the fieldwork carried out, in this Chapter.
Studies have shown that a greater number of students always find it difficult to document their findings correctly. You may have done a good job writing Chapter one (Introduction), Chapter two (Literature Review), and Chapter three (Methodology) with such clarity and end up making a mess of Chapter four (Findings and Data Analysis).
Since chapter four is the heart of your research work and if your supervisor does not start the reading of your work from chapter one, but jump to chapter four which you have spent so much time collecting and analyzing data but do a poor job of reporting the results of the findings.
Also, read this article - Step By Step Instructions To Design And Develop A Questionnaire For A Final Year Project
Alternatively, after collecting all the data and your presentation of your results lack organization and clarity, your reader would struggle by trying to figure out what you have written, and by this, you’ve just wasted your precious time and possibly the cost of compiling the chapter.
Chapter four should ‘stand-alone:
what does this mean?
This means that you could ask a friend to read it and he or she would understand what you discovered in your study without having to read Chapters one to three.
For you to achieve this, your chapter four should be aligned to the purpose of the study, the research questions, why the study was important, how it connects to the underlying theories, literature review, and reflective of the conceptual framework. Chapter four is the culmination of your study and represents your best thinking and how you answered the research question you had formulated and stated in chapter one of the research project.
Also, Read This Article – How To Write Effective Research Project Abstract
A good researcher should begin this chapter with two or three introductory paragraphs. A transition from chapter three is very important too. The researcher should also provide a very brief review of the overall research design. It is not necessary to list all of the secondary questions and hypotheses at the beginning of the chapter, but the introductory section of the chapter should focus the reader’s attention on the primary research question and hypothesis.
Don’t border detailing everything, the bulk of the chapter will consist of the presentation of findings for the secondary questions and hypotheses set forth in Chapter three.
In quantitative research, the results usually begin with a description of the sample, For example, the sample size, description of participants who were excluded, and why the handling of missing data.
Also, the descriptive statistics. For example, frequencies and percentages for categorical variables, means, standard deviations, and ranges for continuously measured variables are presented, and the normality of continuously measured variables is usually presented.
Address each hypothesis in turn, presenting a description of the analysis that was computed to address each hypothesis and the results of that analysis. State whether the null hypothesis was rejected.
Also, Read This Article - Trending Project Topics For Final Year Students At A Glance
Do not repeat in tedious prose that it is obvious for a knowledgeable peer to see at a glance. The dissertation advisor usually has an opinion about the level of detail needed in this chapter. Table titles and figure captions should be understandable without reading the chapter text.
Note all relevant results, even those that were contrary to the alternative hypotheses, or those that tend to distract from clear determinations.
Chapter Four Table Of Content
- Introduction to the Chapter.
- A transition from chapter three. (Very important)
- Provide a brief overview of the research project: as I stated earlier, chapter four should be able to stand alone, this means it should be presented in such a way that one can read it and understand everything about your study, this means that a BRIEF overview of the research project is very important in this chapter.
- Describe the purpose of the chapter.
- Explain the organization of the chapter.
- Data Analyses and Presentation of the Findings: this is the heart of this chapter, the presentation of the findings should be very concise and clear, make sure that you present it in such a way that even a layman can understand it.
- State null hypothesis.
- Present the statistical results in a table.
- Draw statistical conclusions for accepted and rejected hypotheses.
- Draw a preliminary research conclusion
- Conclusion and Transition to Chapter Five
Also, Read This Article - How To Develop Effective And Unique Project Topics
Tags: chapter four, data analysis and presentation, research analysis, data analysis,
Project Categories
- AFRICAN LANGUAGES AND LINGUISTIC
- ACCOUNTING EDUCATION
- ACTUARIAL SCIENCE
- ADULT EDUCATION
- AGRICULTURAL ECONOMICS
- AGRICULTURAL EXTENSION
- ANIMAL SCIENCE
- ARCHITECTURE
- BANKING AND FINANCE
- BIBLICAL AND THEOLOGY
- BIOCHEMISTRY
- BREWING SCIENCE AND TECHNOLOGY
- BUILDING TECHNOLOGY
- BUSINESS ADMINISTRATION
- BUSINESS EDUCATION
SEE MORE PROJECT CATEGORIES
Copyright © 2024. All rights reserved researchwap.com - Free Project Topics, Research Materials, and Academic Resources
IMAGES
VIDEO
COMMENTS
CHAPTER 4: ANALYSIS AND INTERPRETATION OF RESULTS 4.1 INTRODUCTION To complete this study properly, it is necessary to analyse the data collected in order to test the hypothesis and answer the research questions. As already indicated in the preceding chapter, data is interpreted in a descriptive form. This chapter comprises the analysis ...
PDF | On Feb 19, 2020, Teddy Kinyongo published CHAPTER FOUR DATA PRESENTATION, ANALYSIS AND INTERPRETATION 4.0 Introduction | Find, read and cite all the research you need on ResearchGate
Chapter 4. What needs to be included in the chapter? The topics below are typically included in this chapter, and often in this order (check with your Chair): Introduction. Remind the reader what your research questions were. In a qualitative study you will restate the research questions. In a quantitative study you will present the hypotheses.
Chapter Four: Quantitative Methods (Part 1) Once you have chosen a topic to investigate, you need to decide which type of method is best to study it. This is one of the most important choices you will make on your research journey. Understanding the value of each of the methods described in this textbook to answer different questions allows you ...
Sharing an outline of chapter four and five general sections enables dissertation. online mentors teach how to write chapter four and five to dissertation students. Gathering and analyzing data should be fun; the student's passion clearly present in the. last two chapters of the dissertation.
Step 2: Express with an outline. You need to include additional information surrounding your argument, so the readers can answer follow-up questions and have additional details linked to your research question. Step 3: Develop your ideas in a draft. Once you have identified your main argument and have an outline, you need to structure the ...
The chapter represents the best thinking of the student and the advising committee about how to answer the research questions being posed. So you can see that an incomplete understanding of the role of Chapter 3 can lead to a methodology full of gaps, creating the potential for the study to go off track, and not answer the research questions.
Chapter 4 - Primer. Chapter 4 introduces you to the research process and its cornerstones. Every research project starts with an open-ended indirect research question, which is implicitly or explicitly accompanied by a research hypothesis. Often a research problem is substantiated by an ad-hoc hypothesis, which advances to a working ...
Chapter 4 Research Papers: Discussion, Conclusions, Review Papers. Chapter. First Online: 17 July 2020. pp 31-38. Cite this chapter. Download book PDF. Download book EPUB. 100 Tips to Avoid Mistakes in Academic Writing and Presenting. Adrian Wallwork &.
Chapter 4 presents the study findings. It is an overview of the purpose of the research study. This chapter conveys the trustworthiness/validity and reliability of data. It includes the factors impacting the interpretation of data collection or analysis. Students conducting qualitative studies can use NVivo software to analyze data, and SPSS is ...
Chapter 4. Finding a Research Question and Approaches to Qualitative Research We've discussed the research design process in general and ways of knowing favored by qualitative researchers. In chapter 2, I asked you to think about what interests you in terms of a focus of study, including your motivations and research purpose. ...
Chapter 4 Research Papers: Discussion, Conclusions, Review Papers THE DISCUSSION The Discussion is generally the hardest part of the paper to write. It is often subject to the most mistakes by the author. Most of these mistakes relate to i) not highlight-ing your key ndings, ii) not differentiating your work from others, iii) writing long
Chapter 4 Considerations. Topic 1: Chapter 4. How do you organize your chapter? Your chapter needs to be organized in a way that answers your research questions. The information must be organized in a way that is logical and easy to follow for your reader. You may describe your sample here if this is something that emerged from your data ...
Formal Research Structure. These are the primary purposes for formal research: enter the discourse, or conversation, of other writers and scholars in your field. learn how others in your field use primary and secondary resources. find and understand raw data and information. For the formal academic research assignment, consider an ...
Present Demographics. Present the descriptive data: explaining the age, gender, or relevant related information on the population (describe the sample). Summarize the demographics of the sample, and present in a table format after the narration (Simon, 2006). Otherwise, the table is included as an Appendix and referred to in the narrative of ...
Chapter 4: Research Approach 4.1 Chapter Objectives The present chapter is aimed at specifying the methods and procedures for col- lecting and analysing data within the empirical part of the research project. In a first step, this chapter will discuss the author's philosophical approach towards the research questions.
CHAPTER FOUR Qualitative Research 39 R esearch methods that delve deeply into experiences, social processes, and subcultures are referred to as qualitative research. As a group, qualitative research methods: Recognize that ever y individual is situated in an unfolding life context, that is, a set of circumstances, values, and influences
In every research project, chapter four is the heart of the research work and sometimes, supervisors do not even start the reading of the research work from chapter one, but they jump to chapter four because that is the chapter that tells the reader all that was done, the instrument you used, how you analyzed your data and finally your findings
The measuring instrument was discussed and an indication was given of the method of statistical analysis. Chapter 4 investigates the inherent meaning of the research data obtained from the empirical study. Learnership perspectives, as the focal point of this study, have to be evaluated against critical elements, such as organisational culture ...
CHAPTER FOUR. DATA ANALYSIS AND PRESENTATION OF RES EARCH FINDINGS 4.1 Introduction. The chapter contains presentation, analysis and dis cussion of the data collected by the researcher. during the ...
University of Pretoria
Chapter 1 summarize your Chapters 2 and 3, and because of that, Chapter 1 normally should be written after Chapters 2 and 3. Dissertation committee chairs often want students to provide a 5-10 page overview of their proposed "dissertation research" before undertaking a full literature review and detailed development of the methodology.
Section 12-21-9-4. The therapeutic psilocybin research fund is established for the purpose of providing financial assistance to research institutions in Indiana to study, in accordance with the requirements established in section 7 of this chapter, the use of psilocybin to treat mental health and other medical conditions.
Research at UNC Charlotte. With the new criteria, universities must spend at least $50 million on research and have at least 70 research-based doctoral programs to be an R1 school.