It’s completely free, but we’d like to stay in contact. Would you give us your email address?
We’ll send you an email and ask for permission (opt-in) to send you some information occasionally.
You can also download the complete book here .

Building a research wall
Data visualization, synthesis, and analysis.
Synthesizing and analyzing research data through a visual arrangement of research data on a wall – a practical approach.
01 See #TiSDD 8.3, Service design and software development , for an example of how a research wall is used to connect different service design activities of research, ideation, prototyping, and implementation. There are many similar approaches with different names; for example, the “Saturate and Group” method from IDEO/d.school.
02 See the octopus clustering method in #TiSDD 6.4, Ideation methods , for a detailed description.
You can imagine a research wall [01] as a more complex version of how detectives structure their crime scene data in many thrillers (think of any CSI episode). You’ll find many types of data on these walls (quotes, photos, screenshots of websites or videos, statistics, artifacts, etc.).
A research wall enables you to identify patterns within your data, while also providing a place to share your research with others as it develops. Often, you start synthesizing data by simply clustering it according to specific categories or by creating a simple mind map of your dataset. Using an interactive convergent method, such as octopus clustering, is usually a good start. [02]
You can consider the various patterns you identify as intermediate research outcomes. These can be then further explored, visualized, or condensed with tools like personas, journey maps, system maps, key insights, jobs to be done, user stories, or research reports. However, before researchers start working with these tools, they usually create some form of intermediate-level outputs – perhaps visual representations that describe patterns in the data. Often these patterns also lead to new or modified assumptions that need further research. Look for contradictions to your initial hypothesis, and start “building your case” with the support of user verbatims, photos, and audio and/or video recordings. Many of these intermediate insights can be illustrated with simple diagrams and sketches that will be useful when presenting them to your team and beyond.

Step-by-step guide
- Prepare and print out data You’ll need wall space or large cardboard sheets or foam boards to hang up your research data. Prepare your research data by printing out your most important photos, writing out great quotes visualizing audio recordings or videos as quotes, or screenshots, and putting out your collected artifacts and all other data that might be useful. Prepare the room with the essential material you’ll need, such as paper, sticky notes, pens, and of course your research data. Also, think about who should join you to create a research wall.
- Create a data inventory Make an asset catalog of your data, such as “5 video interviews of families, 25 customer quotes on common problems, 15 photos of critical situations …” to make sure nothing gets lost. This might be a simple list or a mind map based on your data index.
- Build research wall Hang the material on the wall and start clustering it in a way that seems meaningful to you. You could start with topics like certain customer segments, interview contexts, or common problems, or with steps along the journey map, etc. Name these clusters and look for connections between clusters as well as connections between single materials. You can repeat clustering and connecting several times with different initial topics.
- Follow-up Document your research wall with photos and write a summary of your key findings. You can also give the same material to different groups for cross-checking and researcher triangulation. You can build a research wall right at the beginning of your data collection and iterate it with new data coming in from your research.
Method notes
- During clustering, you will notice that you are already starting to make connections (often subconsciously) while you are building the wall. Try to avoid confirmation bias, where you start looking for evidence that supports your assumptions while ignoring other input.
- Keep your research wall visible throughout the project so that team members can always come back and review the data when making design decisions later on.
Stickdorn Service Design GmbH
Burgstall 42b 6162 Mutters, Austria VAT ID: ATU78590614

- Set up your Design System Workshop
- Tečaj: oblikovalski sistem
- UI tečaj: od ideje do prototipa
- DSG Newsletter
- The Design Strategy Cards
- The Ultimate Design Strategy e-book
- Free Design Strategy Crash Course
No products in the cart.
How to conduct user research: A step-by-step guide

This is part one of a guide to User research.
Continue with part two: How to conduct user research: A Step-by-step guide
Continue with part three: What is exploratory research and why is it so exciting?
What user research did you conduct to reveal your ideal user?
Uh-oh. Not this question again. We both know the most common answer and it’s not great.
“Uhm, we talked to some users and had a brainstorming session with our team. It’s not much, but we don’t have time to do anything more right now. It’s better than nothing.”
Let’s be brutally honest about the meaning of that answer and rephrase it:
“ We don’t have time to get to know our actual user and maximize our chances of success. We’ll just assume that we know what they want and then wonder why the product fails at a later stage.”
If that sounds super bad, it’s because IT IS. You don’t want to end up in this situation. And you won’t.
After reading this guide, you’ll know exactly how to carry out the user research that will become your guiding star during product development.
On this page
Why is user research so important?
Step #1: define research objectives.
Go ahead – create that fake persona
Step #2: Pick your methods
Qualitative methods – the why, quantitative methods – the what, behavioral and attitudinal methods, step #3: find your participants, how to recruit participants, how many participants, step #4: conduct user research.
Focus groups
Competitive analysis
Field studies
What’s next?
User research can be a scary word. It may sound like money you don’t have, time you can’t spare, and expertise you need to find. That’s why some people convince themselves that it’s not that important.
Which is a HUGE mistake.
User research is crucial – without it, you’ll spend your energy, time and money on a product that is based around false assumptions that won’t work in the real world.
Let’s take a look at Segway, a technologically brilliant product with incredible introductory publicity. Although it’s still around, it simply didn’t reach initial expectations. Here are some of the reasons why:
- It brought mockery, not admiration. The user was always “that guy”, who often felt fat or lazy.
- Cities were not prepared for it. Neither users nor policemen knew if it should be used on the road or on the sidewalk.
- A large segment of the target market comprised of postal and security workers. However, postal workers need both hands while walking, and security workers prefer bikes that don’t have a limited range.
Segway mainly fell short because of issues that could’ve been foreseen and solved by better user research.
Tim Brown, the CEO of the innovation and design firm IDEO, sums it up nicely:
“Empathy is at the heart of design. Without the understanding of what others see, feel, and experience, design is a pointless task.”
? Bonus material Download User research checklist and a comparison table
Never forget – you are not your user.
You require proper user research to understand your user’s problems, pain points, needs, desires, feelings and behaviours.
Let’s start with the process!
Before you get in touch with your target users, you need to define why you are doing the research in the first place.
Establish clear objectives and agree with your team on your exact goals – this will make it much easier to gain valuable insights. Otherwise, your findings will be all over the place.
Here are some sample questions that will help you to define your objectives:
- What do you want to uncover?
- What are the knowledge gaps that you need to fill?
- What is already working and what isn’t?
- Is there a problem that needs to be fixed? What is that problem?
- What will the research bring to the business and/or your customers?
Once you start answering questions like these, it’s time to make a list of objectives. These should be specific and concise .
Let’s say you are making a travel recommendation app. Your research goals could be:
- Understand the end-to-end process of how participants are currently making travel decisions.
- Uncover the different tools that participants are using to make travel decisions.
- Identify problems or barriers that they encounter when making travel decisions.
I suggest that you prioritize your objectives and create an Excel table. It will come in handy later.
Go ahead, create that fake persona
A useful exercise for you to do at this stage is to write down some hypotheses about your target users.
Ask yourself:
What do we think we understand about our users that is relevant to our business or product?
Yes, brainstorm the heck out of this persona, but keep it relevant to the topic at hand.
Here’s my empathy map and empathy map canvas to really help you flesh out your imaginary user.
Once you’re finished, research any and every statement , need and desire with real people.
It’s a simple yet effective way to create questions for some of the research methods that you’ll be using.
However, you need to be prepared to throw some of your assumptions out of the window. If you think this persona may affect your bias, don’t bother with hypotheses and dive straight into research with a completely open mind.
Alright, you have your research goals. Now let’s see how you can reach them.
Here’s the main question you should be asking yourself at this step in the process:
Based on our time and manpower, what methods should we select?
It’s essential to pick the right method at the right time . I’ll delve into more details on specific methods in Step #4. For now, let’s take a quick look at what categories you can choose from.
Qualitative research tells you ‘why’ something occurs. It tells you the reasons behind the behavior, the problem or the desire. It answers questions like: “ Why do you prefer using app X instead of other similar apps?” or “What’s the hardest part about being a sales manager? Why?” .
Qualitative data comes in the form of actual insights and it’s fairly easy to understand.
Most of the methods we’ll look at in Step #4 are qualitative methods.
Quantitative research helps you to understand what is happening by providing different metrics.
It answers questions such as “What percentage of users left their shopping cart without completing the purchase?” or “Is it better to have a big or small subscription button?”.
Most quantitative methods come in handy when testing your product, but not so much when you’re researching your users. This is because they don’t tell you why particular trends or patterns occur.
There is a big difference between “what people do” and “what people say”.
As their names imply, attitudinal research is used to understand or measure attitudes and beliefs, whereas behavioral research is used to measure and observe behaviors.
Here’s a practical landscape that will help you choose the best methods for you. If it doesn’t make sense now, return to it once you’ve finished the guide and you’ll have a much better understanding.
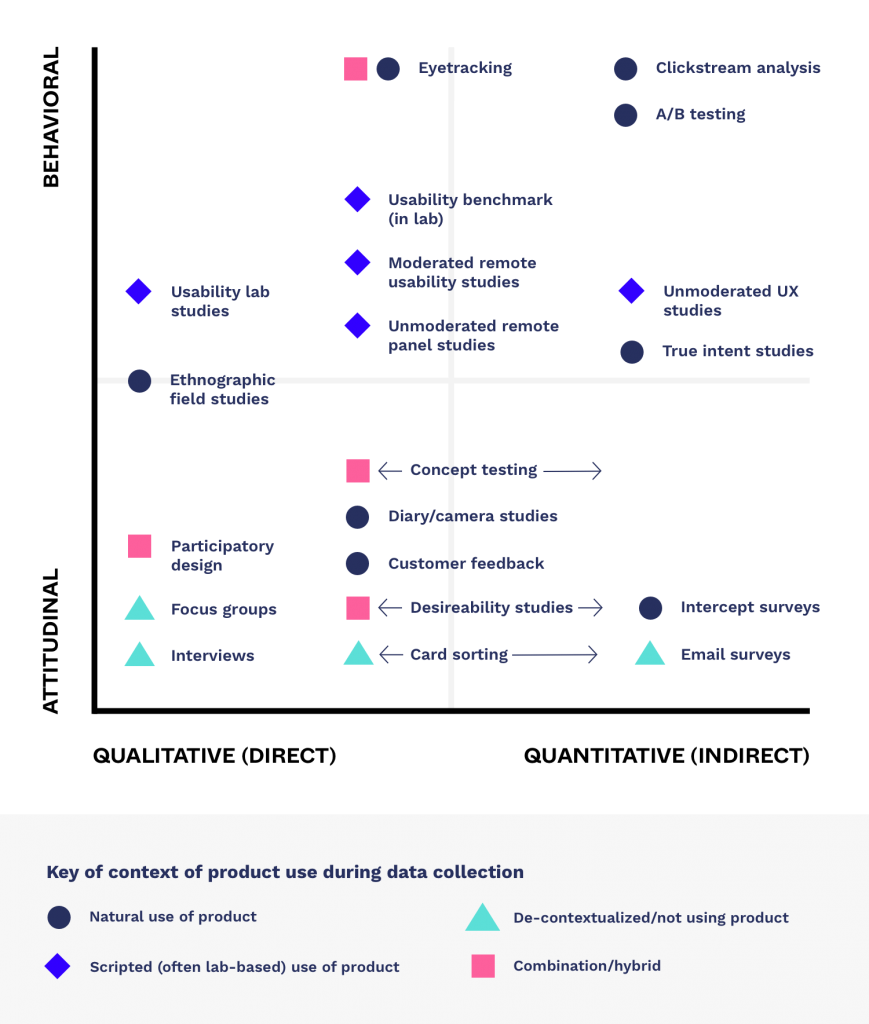
Source: Nielsen Norman Group
I’ll give you my own suggestions and tips about the most common and useful methods in Step #4 – Conducting research.
In general, if your objectives are specific enough, it shouldn’t be too hard to see which methods will help you achieve them.
Remember that Excel table? Choose a method or two that will fulfill each objective and type it in the column beside it.
It won’t always be possible to carry out everything you’ve written down. If this is the case, go with the method(s) that will give you most of the answers. With your table, it will be easy to pick and choose the most effective options for you.
Onto the next step!

This stage is all about channeling your inner Sherlock and finding the people with the secret intel for your product’s success.
Consider your niche, your objectives and your methods – this should give you a general idea of the group or groups you want to talk to and research further.
Here’s my advice for most cases.
If you’re building something from the ground up, the best participants might be:
- People you assume face the problem that your product aims to solve
- Your competitors’ customers
If you are developing something or solving a problem for an existing product, you should also take a look at:
- Advocates and super-users
- Customers who have recently churned
- Users who tried to sign up or buy but decided not to commit

There are plenty of ways to bring on participants, and you can get creative so long as you keep your desired target group in mind.
You can recruit them online – via social media, online forums or niche community sites.
You can publish an ad with requirements and offer some kind of incentive.
You can always use a recruitment agency, too. This can be costly, but it’s also efficient.
If you have a user database and are changing or improving your product, you can find your participants in there. Make sure that you contact plenty of your existing users, as most of them won’t respond.
You can even ask your friends to recommend the right kind of people who you wouldn’t otherwise know.
With that said, you should always be wary of including friends in your research . Sure, they’re the easiest people to reach, but your friendship can (and probably will) get in the way of obtaining honest answers. There are plenty of horror stories about people validating their “brilliant” ideas with their friends, only to lose a fortune in the future. Only consider them if you are 100% sure that they will speak their mind no matter what.
That depends on the method. If you’re not holding a massive online survey, you can usually start with 5 people in each segment . That’s enough to get the most important unique insights. You can then assess the situation and decide whether or not you need to expand your research.
Finally! Let’s go through some of the more common methods you’ll be using, including their pros and cons, some pro tips, and when you should use them.
Engaging in one-on-one discussions with users enables you to acquire detailed information about a user’s attitudes, desires, and experiences. Individual concerns and misunderstandings can be directly addressed and cleared up on the spot.
Interviews are time-consuming, especially on a per participant basis. You have to prepare for them, conduct them, analyze them and sometimes even transcribe them. They also limit your sample size, which can be problematic. The quality of your data will depend on the ability of your interviewer, and hiring an expert can be expensive.
- Prepare questions that stick to your main topics. Include follow-up questions for when you want to dig deeper into certain areas.
- Record the interview . Don’t rely on your notes. You don’t want to interrupt the flow of the interview by furiously scribbling down your answers, and you’ll need the recording for any potential in-depth analysis later on.
- Conduct at least one trial run of the interview to see if everything flows and feels right. Create a “playbook” on how the interview should move along and update it with your findings.
- If you are not comfortable with interviewing people, let someone else do it or hire an expert interviewer. You want to make people feel like they are talking to someone they know, rather than actually being interviewed. In my experience, psychologists are a great choice for an interviewer.
Interviews are not really time-sensitive, as long as you do them before the development process.
However, they can be a great supplement to online surveys and vice-versa. Conducting an interview beforehand helps you to create a more focused and relevant survey, while conducting an interview afterwards helps you to explain the survey answers.
Surveys are generally conducted online, which means that it’s possible to gather a lot of data in a very short time for a very low price . Surveys are usually anonymous, so users are often more honest in their responses.
It’s more difficult to get a representative sample because it’s tough to control who takes part in the survey – especially if you post it across social media channels or general forums. Surveys are quite rigid and if you don’t account for all possible answers, you might be missing out on valuable data. You have to be very careful when choosing your questions – poorly worded or leading ones can negatively influence how users respond. Length can also be an issue, as many people hate taking long surveys.
- Keep your surveys brief , particularly if participants won’t be compensated for their time. Only focus on what is truly important.
- Make sure that the questions can be easily understood. Unclear or ambiguous questions result in data on which you can’t depend. Keep the wording as simple as possible.
- Avoid using leading questions. Don’t ask questions that assume something, such as “What do you dislike about X?”. Replace this with “What’s your experience with X?”.
- Find engaged, niche online communities that fit your user profile. You’ll get more relevant data from these.
Similar to interviews. It depends on whether you want to use the survey as a preliminary method, or if you want a lot of answers to a few, very focused questions.

Focus Groups
Focus groups are moderated discussions with around 5 to 10 participants, the intention of which is to gain insight into the individuals’ attitudes, ideas and desires.
As focus groups include multiple people, they can quickly reveal the desires, experiences, and attitudes of your target audience . They are helpful when you require a lot of specific information in a short amount of time. When conducted correctly, they can act like interviews on steroids.
Focus groups can be tough to schedule and manage. If the moderator isn’t experienced, the discussion can quickly go off-topic. There might be an alpha participant that dictates the general opinion, and because it’s not one-on-one, people won’t always speak their mind.
- Find an experienced moderator who will lead the discussion. Having another person observing and taking notes is also highly recommended, as he or she can emphasize actionable insights and catch non-verbal clues that would otherwise be missed.
- Define the scope of your research . What questions will you ask? How in-depth do you want to go with the answers? How long do you want each discussion to last? This will determine how many people and groups should be tested.
- If possible, recruit potential or existing users who are likely to provide good feedback, yet will still allow others to speak their mind. You won’t know the participants most of the time, so having an experienced moderator is crucial.
Focus groups work best when you have a few clear topics that you want to focus on.
Competitive Analysis
A competitive analysis highlights the strengths and weaknesses of existing products . It explores how successful competitors act on the market. It gives you a solid basis for other user research methods and can also uncover business opportunities. It helps you to define your competitive advantage , as well as identify different user types.
A competitive analysis can tell you what exists, but not why it exists. You may collect a long feature list, but you won’t know which features are valued most by users and which they don’t use at all. In many cases, it’s impossible to tell how well a product is doing, which makes the data less useful. It also has limited use if you’re creating something that’s relatively new to the market.
- Create a list or table of information that you want to gather – market share, prices, features, visual design language, content, etc.
- Don’t let it go stale. Update it as the market changes so that you include new competitors.
- If you find something really interesting but don’t know the reason behind it, conduct research among your competitor’s users .
- After concluding your initial user research, go over the findings of your competitive analysis to see if you’ve discovered anything that’s missing on the market .
It can be a great first method, especially if you’re likely to talk to users of your competitors’ products

Field Studies
Field studies are research activities that take place in the user’s context, rather than at your company or office. Some are purely observational (the researcher is a “fly on the wall”), others are field interviews, and some act as a demonstration of pain points in existing systems.
You really get to see the big picture – field studies allow you to gain insights that will fundamentally change your product design . You see what people actually do instead of what they say they do. A field study can explain problems and behaviours that you don’t understand better than any other method.
It’s the most time-consuming and expensive method. The results rely on the observer more than any of the other options. It’s not appropriate for products that are used in rare and specific situations.
- Establish clear objectives. Always remember why you are doing the research. Field studies can provide a variety of insights and sometimes it can be hard to stay focused. This is especially true if you are participating in the observed activity.
- Be patient. Observation might take some time. If you rush, you might end up with biased results.
- Keep an open mind and don’t ask leading questions. Be prepared to abandon your preconceptions, assumptions and beliefs. When interviewing people, try to leave any predispositions or biases at the door.
- Be warm but professional. If you conduct interviews or participate in an activity, you won’t want people around you to feel awkward or tense. Instead, you’ll want to observe how they act naturally.
Use a field study when no other method will do or if it becomes clear that you don’t really understand your user. If needed, you should conduct this as soon as possible – it can lead to monumental changes.
We started with a user persona and we’ll finish on this topic, too. But yours will be backed by research 😉
A persona outlines your ideal user in a concise and understandable way. It includes the most important insights that you’ve discovered. It makes it easier to design products around your actual users and speak their language. It’s a great way to familiarize new people on your team with your target market.
A persona is only as good as the user research behind it. Many companies create a “should be” persona instead of an actual one. Not only can such a persona be useless, it can also be misleading.
- Keep personas brief. Avoid adding unnecessary details and omit information that does not aid your decision making. If a persona document is too long, it simply won’t be used.
- Make personas specific and realistic. Avoid exaggerating and include enough detail to help you find real people that represent your ideal user.
Create these after you’ve carried out all of the initial user research. Compile your findings and create a persona that will guide your development process.
Now you know who you are creating your product for – you’ve identified their problems, needs and desires. You’ve laid the groundwork, so now it’s time to design a product that will blow your target user away! But that’s a topic for a whole separate guide, one that will take you through the process of product development and testing 😉
PS. Don’t forget -> Here is your ? User Research Checklist and comparison table
About the author

Oh hey, I’m Romina Kavcic
I am a Design Strategist who holds a Master of Business Administration. I have 14+ years of career experience in design work and consulting across both tech startups and several marquee tech unicorns such as Stellar.org, Outfit7, Databox, Xamarin, Chipolo, Singularity.NET, etc. I currently advise, coach and consult with companies on design strategy & management, visual design and user experience. My work has been published on Forbes, Hackernoon, Blockgeeks, Newsbtc, Bizjournals, and featured on Apple iTunes Store.
More about me * Let’s connect on Linkedin * Let’s connect on Twitter

Explore more
Username or email address *
Password *
Remember me Log in
Lost your password?
Insert/edit link
Enter the destination URL
Or link to existing content
Effective user research analysis
Using a Research Wall to make sense of data from multiple sources, in mixed formats

As a UX designer, understanding the needs, goals, behaviours, and attitudes of users is crucial to creating successful products and services. User research is a fundamental part of the UX design process and involves gathering insights from users to inform design decisions.
The primary aim of user research is to gain deep understanding of the needs, goals, behaviours, and attitudes of the people who will use a product or service. One of the most popular methods of gathering user insights is through user interviews.
But let's be real: just conducting user interviews won't magically create a successful (UX) design. It's what you do with the insights that matter.
Analysing your data can be hard, especially as user interviews should not be your only source of information, and you should be ideally looking at a mix of qualitative and quantitative data.
So, in this post, we'll explore how to bring together all the data you collect, not just from user interviews but from various sources. We'll also discuss how these insights can be transformed into meaningful decisions to create better user experiences and increase organisational UX maturity.
But first, as user interviews are one of the most commonly used methods to gather in-depth data, a quick overview of how to ensure your research interviews produce rich, useful data…
Conducting data-rich user interviews
To make sure that your user interviews are effective, you need to speak to the right people, and the process of picking these people is usually a collaborative decision between the stakeholders and the design researcher.
The number of participants for user interviews can vary depending on the project. There's no hard and fast rule, but generally, you want to think about the variables or subgroups that can influence how people think and behave.
You want to make sure that you include people from all of these subgroups in your sample. This way, you can gain insights from a diverse range of perspectives and ensure that you're not missing any crucial information.
Before conducting your user interviews, it's a good practice to write and then agree on a discussion guide with your stakeholders. This guide should cover all the important aspects and key questions that you need to explore during your interviews.
And don't be afraid to get creative! You can include different type of exercises to get the information you need.
For example, use card sorting to uncover the participants’ mental models or introduce projective techniques (using unstructured tasks to uncover subjective beliefs), especially if you are working on a complex topic, as it can help you obtain more in-depth answers from your participants.
Two research heads are better than one
During the interviews, it's essential to have an interviewer (researcher) and an interviewee (participant). But, ideally, you should also have a second researcher observing the session and taking notes, as it helps the interviewer focus on the participant
Plus, it also speeds up the process of analysis as the researchers do not necessarily need to watch back all videos and recordings as the notes and discussions between the two researchers serve as a base which is reinforced by watching back the videos.
Additional benefits to having a second person involved in some of the sessions include:
The observer usually notices a possibility for follow-up questions that have been missed by the interviewer. I stop several times during the interview, usually after each bigger section, and ask if anyone has questions about that topic before we move on. This short stop after each section is a great way to provide a timeframe not only for our internal follow-up questions but for any stakeholder present to let me know if they have any additional questions, which they texted in a chat to me privately, and I can pick them up in this time.
I personally like to change the roles and not keep any researcher to strictly ask the questions or observe. The variety of roles gives the design researchers the potential to gain a fresh perspective, reflect and learn.
Speaking of learning, having two researchers present is a great learning opportunity for a less experienced design researcher to get comfortable in an interview setup.
In terms of who should attend your interviews, you should consider inviting stakeholders to the sessions. This way, they can increase ownership and better understand the reasoning behind the decisions that your design team is about to propose or make.
One final tip for conducting user interviews is to view the first session as an opportunity to test your discussion guide. Give yourself some breathing space after that first session to make any necessary iterations.
Now, on to the data analysis part…
Better user research analysis, better user experiences.
After conducting the user interviews, it's essential to capture and organise the information gained from these sessions in a meaningful way. A Research Wall helps you with that.
What is a Research Wall?
On a basic level, a Research Wall is a table of data organised into a series of rows and columns. Each column relates to a different aspect of the interview - like facts or key themes you want to know more about or an activity (for example, a projective task, card sorting, etc.) - and each row relates to a separate participant or research activity (for example: reports you looked at through the desk research)

Example Research Wall
How to populate the research wall with data.
One method that I find effective for getting the information onto the Research Wall is an iterated version of IDEO's ‘download your learnings’ exercise , which involves putting key information - such as who was interviewed, what was said, and any facts or impressions gained during the session - on to Post-it notes.
While it's best done as a group exercise, in reality, it is often just the two design researchers who were present in the session. If there was only the interviewer present, or you are unsure about some aspects, or maybe you would like to quote a participant, this is time to watch back the recordings.
A bonus tip for getting extra (layer of) information on the Research Wall
If a stakeholder was present during an interview, it can be helpful to ask them to share their top three takeaways from the session. These can be noted in a separate column on the Research Wall.
Doing so helps you understand what struck their interests, sparking some great conversations that ensure that you don't miss out on crucial aspects of the interview.
Using a Research Wall to analyse user research data
In my personal experience, Research Walls support a thematic analysis of user interviews (and most types of qualitative data), as organising all your information in this way naturally fosters the discovery of common themes, ideas and patterns. Further input can also be included to help build a more diverse understanding.
So when you have lots of information from different sources that you need to consider as a whole in order to really gain insight and understanding of the overarching themes and patterns, a Research Wall can be the place where you bring all the information together.
For example, rather than (usually the first) column relating only to “who” (i.e. a specific participant), it could also cover “what” - such as an industry report, previous in-house research findings, statistical data or workshop outputs.
A more engaging, organised way to display research data
A Research Wall is where all the information gathered during research can be organised and displayed in a visually engaging and easily accessible way.
By putting everything in one place, it becomes easier to spot patterns and connections that might not have been apparent before. For example, you might notice that a behaviour discovered through interviews aligns with a quantitative insight from an industry report (or that they completely contradict it).
Having it in the same place allows you and your team to have an initial sense check on the insights that emerge from the research.
An example:
To illustrate, let's assume that we discovered a significant trend among our research participants who use bikes during some part of their morning commute as a means of saving money and maintaining good health. However, our digital ticket-selling app for buses and trains lacks the functionality to check whether bikes are permitted on board or to purchase bike-specific tickets.
While based on the sample of 12 regular commuters we interviewed, this is a pain point for our user group, we cannot accurately determine the problem's magnitude or relevance without additional data since our qualitative interviews are not representative.
Therefore, we could match this data with an industry report on transportation trends, look at our own statistics, etc., to obtain a rough estimate of the issue's size before committing resources to measure it quantitatively or developing a new feature.
Increasing the value and reach of user research projects
Additionally, research activities usually end with a deliverable. A report and its presentation are always in scope, and there is potentially a design suggestion and (ideally) the design itself included, too.
These research reports contain (carefully) curated insights and suggestions based on the aims and objectives of the project, meaning not all information gathered will make it into the final report.
But sometimes, those final presentations spark interest among other teams as they would like to know more or have further questions - and again, this is where Research Walls can also be particularly useful.
For example: even if the research didn't have a marketing objective, some of the insights could be useful for marketing purposes. As though it may be unlikely for the marketing team to go through the interview recordings or transcripts, the researcher(s) who conducted the research can walk them through the Research Wall and highlight relevant pieces of information.
Research Walls:
Provide a single source of raw data that can be referred back to by anyone at any time;
Bring the voice of users to things where it may otherwise be missed;
Open up the work UX teams do to other departments - which can help raise organisational UX maturity.
It is quite often in organisations - especially those without a dedicated research or insight team - that product information gets siloed, with lots of information sitting in lots of different places that different people know about and have access to.
But by allowing different teams to access the findings, Research Walls give insights a place to be stored whilst also providing a relatively easy, searchable archive of information - meaning the impact of the project can be extended.
For example, UX Design information may not be accessible to other departments, and marketing research may not be seen by the UX team.
Hence, a Research Wall can be a step towards in-house knowledge being shared and used across different departments. This not only helps to reduce the duplicating of in-house knowledge but can also foster more collaborative, cross-team working.
Ready to start analysing your user research data?
If you want to have a bit more of a read-up on effective user research first, check out our other articles on running user interviews and conducting user research remotely .

About the author
Eszter Hegymegi
A UX aficionado, Eszter is an experienced UX and Service Designer. She's got her MA in design and is currently pursuing a part-time PhD at Loughborough University. She has lived in Berlin, Sheffield and Budapest and worked in various UX design roles. She brings valuable first-hand knowledge combined with real-life project experience.
Liked this post? Share it with your network...
More posts .

Market vs User Research
One of the most common questions we get asked by product teams is “ we’ve already done market research; do we really need to do user research, too?" . If you’re designing a digital product or service, most likely, the answer would be: Yes - you do need both market research and UX research!

Running remote user research
In this webinar, we'll show how to run remote user interviews and usability tests. We'll show how we've been doing here at Fruto and talk about the best tools, practices and potential pitfalls.

Strategic vs Tactical UX
Not sure what the difference is between tactical and strategic UX approaches, or which would be best for your next project? This post is for you.
How can we help?
If you have a project in mind, any questions or if you just want to say hello, get in touch! We'd love to hear from you.
Synthesis Wall
Use a physical wall and post-it notes to debrief the research sessions and cluster important insights, applied for, also called.
Insight Mapping, Affinity Mapping, Clustering Map
related content
Observation Notes
Journey Map
The synthesis wall is a key support in the moment of debriefing and analysis of the research outcomes. The team writes down all the relevant notes from the research on single post-it notes, and organize them on the wall in order to start identifying clusters, relevant themes, important insights that can inform and inspire the design process. The wall could be set in a structured way, listing all the notes under each interviewee (helpful to identify personas and transversal patterns), or under each step of the journey (helpful to analyse an experience and its pain points).
Collaboratively discuss insights and analyse user profiles or experience journeys.
remember to
Define a structure to place the notes on the wall before starting the analysis.
case studies

Example by Government Digital Service (GDS)
Vertical Campfires
User research walls as places to connect, gather insights and take inspiration
description
Creating a synthesis wall with data, materials and observations from user research is a huge contribution to the design process. The wall allows to develop a shared understanding of the research process and outcomes, and it’s beneficial to both team members directly involved in the project and other colleagues just passing by. An example provided by GDS illustrates how they have been using user research walls in many projects, included the design process of Carer’s Allowance. The Carer’s Allowance is a service that enables individuals to claim the caregiver’s allowance online. The research team managed to get to a quicker and easier request process by removing 170 questions (49%) out of the entire form. The wall helped map out all the feedback collected during the research and testing, and reach consensus internally, meeting after meeting.
what is interesting
When working in large teams, it’s very important that the analysis and synthesis process are managed in a way that allows everyone to be on the same page. The user research wall plays a key role in both leading to the identification of patterns and findings, and sharing them with others as insights and ideas develop.
Grow with us! Share your case studies
The collection is always evolving, following the development of our practice. If you have any interesting tools or example of application to share, please get in touch.
This website uses cookies to collect anonymized usage statistics so that we can improve the overall user experience. If you want to know more or change your preferences, read our Cookie Policy . By clicking Accept you are giving consent to the use of cookies.
No, thank you.
Integrations
What's new?
Prototype Testing
Live Website Testing
Feedback Surveys
Interview Studies
Card Sorting
Tree Testing
In-Product Prompts
Participant Management
Automated Reports
Templates Gallery
Choose from our library of pre-built mazes to copy, customize, and share with your own users
Browse all templates
Financial Services
Tech & Software
Product Designers
Product Managers
User Researchers
By use case
Concept & Idea Validation
Wireframe & Usability Test
Content & Copy Testing
Feedback & Satisfaction
Content Hub
Educational resources for product, research and design teams
Explore all resources
Question Bank
Research Maturity Model
Guides & Reports
Help Center
Future of User Research Report
The Optimal Path Podcast
Maze Guides | Resources Hub
What is UX Research: The Ultimate Guide for UX Researchers
0% complete
The UX researcher’s toolkit: 11 UX research methods and when to use them
After defining your objectives and planning your research framework, it’s time to choose the research technique that will best serve your project's goals and yield the right insights. While user research is often treated as an afterthought, it should inform every design decision. In this chapter, we walk you through the most common research methods and help you choose the right one for you.

What are UX research methods?
A UX research method is a way of generating insights about your users, their behavior, motivations, and needs.
These methods help:
- Learn about user behavior and attitudes
- Identify key pain points and challenges in the user interface
- Develop user personas to identify user needs and drive solutions
- Test user interface designs to see what works and what doesn’t
You can use research methodologies like user interviews, surveys, focus groups, card sorting, usability testing to identify user challenges and turn them into opportunities to improve the user experience.
More of a visual learner? Check out this video for a speedy rundown. If you’re ready to get stuck in, jump straight to our full breakdown .
The most common types of user research
First, let’s talk about the types of UX research. Every individual research method falls under these types, which reflect different goals and objectives for conducting research.
Here’s a quick overview:

Qualitative vs. quantitative
All research methods are either quantitative or qualitative . Qualitative research focuses on capturing subjective insights into users' experiences. It aims to understand the underlying reasons, motivations, and behaviors of individuals.
Quantitative research, on the other hand, involves collecting and analyzing numerical data to identify patterns, trends, and significance. It aims to quantify user behaviors, preferences, and attitudes, allowing for generalizations and statistical insights.

Qualitative research also typically involves a smaller sample size than quantitative research. Nielsen Norman Group recommends 40 participants—see our full rundown of how many user testers you need for different research methods .
Attitudinal vs. behavioral
Attitudinal research is about understanding users' attitudes, perceptions, and beliefs. It delves into the 'why' behind user decisions and actions. It often involves surveys or interviews where users are asked about their feelings, preferences, or perceptions towards a product or service. It's subjective in nature, aiming to capture people's emotions and opinions.
Behavioral research is about what users do rather than what they say they do or would do. This kind of research is often based on observation methods like usability testing, eye-tracking, or heat maps to understand user behavior.

Generative vs. evaluative
Generative research is all about generating new ideas, concepts, and insights to fuel the design process. You might run brainstorming sessions with groups of users, card sorting, and co-design sessions to inspire creativity and guide the development of user-centered solutions.
On the other hand, evaluative research focuses on assessing the usability, effectiveness, and overall quality of existing designs or prototypes. Once you’ve developed a prototype of your product, it's time to evaluate its strengths and weaknesses. You can compare different versions of a product design or feature through A/B testing—ensuring your UX design meets user needs and expectations.

Remove the guesswork from product decisions
Collect both quantitative and qualitative insights from your customers and build truly user-centric products with Maze.

11 Best UX research methods and when to use them
There are various UX research techniques—each method serves a specific purpose and can provide unique insights into user behaviors and preferences. In this section, we’ll highlight the most common research techniques you need to know.
Read on for an at-a-glance table, and full breakdown of each method.
1. User interviews
Tl;dr: user interviews.
Directly ask users about their experiences with a product to understand their thoughts, feelings, and problems
✅ Provides detailed insights that survey may miss ❌ May not represent the wider user base; depends on user’s memory and honesty
User interviews are a qualitative research method that involves having open-ended and guided discussions with users to gather in-depth insights about their experiences, needs, motivations, and behaviors.
Typically, you would ask a few questions on a specific topic during a user interview and analyze participants' answers. The results you get will depend on how well you form and ask questions, as well as follow up on participants’ answers.
“As a researcher, it's our responsibility to drive the user to their actual problems,” says Yuliya Martinavichene , User Experience Researcher at Zinio. She adds, “The narration of incidents can help you analyze a lot of hidden details with regard to user behavior.”
That’s why you should:
- Start with a wide context : Make sure that your questions don’t start with your product
- Ask questions: Always ask questions that focus on the tasks that users are trying to complete
- Invest in analysis : Get transcripts done and share the findings with your team
Tanya Nativ , Design Researcher at Sketch recommends defining the goals and assumptions internally. “Our beliefs about our users’ behavior really help to structure good questions and get to the root of the problem and its solution,” she explains.
It's easy to be misunderstood if you don't have experience writing interview questions. You can get someone to review them for you or use our Question Bank of 350+ research questions .
When to conduct user interviews
This method is typically used at the start and end of your project. At the start of a project, you can establish a strong understanding of your target users, their perspectives, and the context in which they’ll interact with your product. By the end of your project, new user interviews—often with a different set of individuals—offer a litmus test for your product's usability and appeal, providing firsthand accounts of experiences, perceived strengths, and potential areas for refinement.
2. Field studies
Tl;dr: field studies.
Observe users in their natural environment to inform design decisions with real-world context
✅ Provides contextual insights into user behavior in real-world situations ✅ Helps identify external factors and conditions that influence user experience ❌ Can be time-consuming and resource-intensive to conduct ❌ Participants may behave differently when they know they are being observed (Hawthorne effect)
Field studies—also known as ethnographic research—are research activities that take place in the user’s environment rather than in your lab or office. They’re a great method for uncovering context, unknown motivations, or constraints that affect the user experience.
An advantage of field studies is observing people in their natural environment, giving you a glimpse at the context in which your product is used. It’s useful to understand the context in which users complete tasks, learn about their needs, and collect in-depth user stories.
When to conduct field studies
This method can be used at all stages of your project—two key times you may want to conduct field studies are:
- As part of the discovery and exploration stage to define direction and understand the context around when and how users interact with the product
- During usability testing, once you have a prototype, to evaluate the effectiveness of the solution or validate design assumptions in real-world contexts
3. Focus groups
Tl;dr: focus groups.
Gather qualitative data from a group of users discussing their experiences and opinions about a product
✅ Allows for diverse perspectives to be shared and discussed ❌ Group dynamics may influence individual opinions
A focus group is a qualitative research method that includes the study of a group of people, their beliefs, and opinions. It’s typically used for market research or gathering feedback on products and messaging.
Focus groups can help you better grasp:
- How users perceive your product
- What users believe are a product’s most important features
- What problems do users experience with the product
As with any qualitative research method, the quality of the data collected through focus groups is only as robust as the preparation. So, it’s important to prepare a UX research plan you can refer to during the discussion.
Here’s some things to consider:
- Write a script to guide the conversation
- Ask clear, open-ended questions focused on the topics you’re trying to learn about
- Include around five to ten participants to keep the sessions focused and organized
When to conduct focus groups
It’s easier to use this research technique when you're still formulating your concept, product, or service—to explore user preferences, gather initial reactions, and generate ideas. This is because, in the early stages, you have flexibility and can make significant changes without incurring high costs.
Another way some researchers employ focus groups is post-launch to gather feedback and identify potential improvements. However, you can also use other methods here which may be more effective for identifying usability issues. For example, a platform like Maze can provide detailed, actionable data about how users interact with your product. These quantitative results are a great accompaniment to the qualitative data gathered from your focus group.
4. Diary studies
Tl;dr: diary studies.
Get deep insights into user thoughts and feelings by having them keep a product-related diary over a set period of time, typically a couple of weeks
✅ Gives you a peak into how users interact with your product in their day-to-day ❌ Depends on how motivated and dedicated the users are
Diary studies involve asking users to track their usage and thoughts on your product by keeping logs or diaries, taking photos, explaining their activities, and highlighting things that stood out to them.
“Diary studies are one of the few ways you can get a peek into how users interact with our product in a real-world scenario,” says Tanya.
A diary study helps you tell the story of how products and services fit into people’s daily lives, and the touch-points and channels they choose to complete their tasks.
There’s several key questions to consider before conducting diary research, from what kind of diary you want—freeform or structured, and digital or paper—to how often you want participants to log their thoughts.
- Open, ‘freeform’ diary: Users have more freedom to record what and when they like, but can also lead to missed opportunities to capture data users might overlook
- Closed, ‘structured; diary: Users follow a stricter entry-logging process and answer pre-set questions
Remember to determine the trigger: a signal that lets the participants know when they should log their feedback. Tanya breaks these triggers down into the following:
- Interval-contingent trigger : Participants fill out the diary at specific intervals such as one entry per day, or one entry per week
- Signal-contingent trigger : You tell the participant when to make an entry and how you would prefer them to communicate it to you as well as your preferred type of communication
- Event-contingent trigger : The participant makes an entry whenever a defined event occurs
When to conduct diary studies
Diary studies are often valuable when you need to deeply understand users' behaviors, routines, and pain points in real-life contexts. This could be when you're:
- Conceptualizing a new product or feature: Gain insights into user habits, needs, and frustrations to inspire your design
- Trying to enhance an existing product: Identify areas where users are having difficulties or where there are opportunities for better user engagement
TL;DR: Surveys
Collect quantitative data from a large sample of users about their experiences, preferences, and satisfaction with a product
✅ Provides a broad overview of user opinions and trends ❌ May lack in-depth insights and context behind user responses
Although surveys are primarily used for quantitative research, they can also provided qualitative data, depending on whether you use closed or open-ended questions:
- Closed-ended questions come with a predefined set of answers to choose from using formats like rating scales, rankings, or multiple choice. This results in quantitative data.
- Open-ended question s are typically open-text questions where test participants give their responses in a free-form style. This results in qualitative data.
Matthieu Dixte , Product Researcher at Maze, explains the benefit of surveys: “With open-ended questions, researchers get insight into respondents' opinions, experiences, and explanations in their own words. This helps explore nuances that quantitative data alone may not capture.”
So, how do you make sure you’re asking the right survey questions? Gregg Bernstein , UX Researcher at Signal, says that when planning online surveys, it’s best to avoid questions that begin with “How likely are you to…?” Instead, Gregg says asking questions that start with “Have you ever… ?” will prompt users to give more specific and measurable answers.
Make sure your questions:
- Are easy to understand
- Don't guide participants towards a particular answer
- Include both closed-ended and open-ended questions
- Respect users and their privacy
- Are consistent in terms of format
To learn more about survey design, check out this guide .
When to conduct surveys
While surveys can be used at all stages of project development, and are ideal for continuous product discovery , the specific timing and purpose may vary depending on the research goals. For example, you can run surveys at:
- Conceptualization phase to gather preliminary data, and identify patterns, trends, or potential user segments
- Post-launch or during iterative design cycles to gather feedback on user satisfaction, feature usage, or suggestions for improvements
6. Card sorting
Tl;dr: card sorting.
Understand how users categorize and prioritize information within a product or service to structure your information in line with user expectations
✅ Helps create intuitive information architecture and navigation ❌ May not accurately reflect real-world user behavior and decision-making
Card sorting is an important step in creating an intuitive information architecture (IA) and user experience. It’s also a great technique to generate ideas, naming conventions, or simply see how users understand topics.
In this UX research method, participants are presented with cards featuring different topics or information, and tasked with grouping the cards into categories that make sense to them.
There are three types of card sorting:
- Open card sorting: Participants organize topics into categories that make sense to them and name those categories, thus generating new ideas and names
- Hybrid card sorting: Participants can sort cards into predefined categories, but also have the option to create their own categories
- Closed card sorting: Participants are given predefined categories and asked to sort the items into the available groups

Card sorting type comparison table
You can run a card sorting session using physical index cards or digitally with a UX research tool like Maze to simulate the drag-and-drop activity of dividing cards into groups. Running digital card sorting is ideal for any type of card sort, and moderated or unmoderated sessions .
Read more about card sorting and learn how to run a card sorting session here .
When to conduct card sorting
Card sorting isn’t limited to a single stage of design or development—it can be employed anytime you need to explore how users categorize or perceive information. For example, you may want to use card sorting if you need to:
- Understand how users perceive ideas
- Evaluate and prioritize potential solutions
- Generate name ideas and understand naming conventions
- Learn how users expect navigation to work
- Decide how to group content on a new or existing site
- Restructure information architecture
7. Tree testing
Tl;dr: tree testing.
Evaluate the findability of existing information within a product's hierarchical structure or navigation
✅ Identifies potential issues in the information architecture ❌ Focuses on navigation structure, not visual design or content
During tree testing a text-only version of the site is given to your participants, who are asked to complete a series of tasks requiring them to locate items on the app or website.
The data collected from a tree test helps you understand where users intuitively navigate first, and is an effective way to assess the findability, labeling, and information architecture of a product.
We recommend keeping these sessions short, ranging from 15 to 20 minutes, and asking participants to complete no more than ten tasks. This helps ensure participants remain focused and engaged, leading to more reliable and accurate data, and avoiding fatigue.
If you’re using a platform like Maze to run remote testing, you can easily recruit participants based on various demographic filters, including industry and country. This way, you can uncover a broader range of user preferences, ensuring a more comprehensive understanding of your target audience.
To learn more about tree testing, check out this chapter .
When to conduct tree testing
Tree testing is often done at an early stage in the design or redesign process. That’s because it’s more cost-effective to address errors at the start of a project—rather than making changes later in the development process or after launch.
However, it can be helpful to employ tree testing as a method when adding new features, particularly alongside card sorting.
While tree testing and card sorting can both help you with categorizing the content on a website, it’s important to note that they each approach this from a different angle and are used at different stages during the research process. Ideally, you should use the two in tandem: card sorting is recommended when defining and testing a new website architecture, while tree testing is meant to help you test how the navigation performs with users.
8. Usability testing
Tl;dr: usability testing.
Observe users completing specific tasks with a product to identify usability issues and potential improvements
✅ Provides direct insights into user behavior and reveals pain points ❌ Conducted in a controlled environment, may not fully represent real-world usage
Usability testing evaluates your product with people by getting them to complete tasks while you observe and note their interactions (either during or after the test). The goal of conducting usability testing is to understand if your design is intuitive and easy to use. A sign of success is if users can easily accomplish their goals and complete tasks with your product.
There are various usability testing methods that you can use, such as moderated vs. unmoderated or qualitative vs. quantitative —and selecting the right one depends on your research goals, resources, and timeline.
Usability testing is usually performed with functional mid or hi-fi prototypes . If you have a Figma, InVision, Sketch, or prototype ready, you can import it into a platform like Maze and start testing your design with users immediately.
The tasks you create for usability tests should be:
- Realistic, and describe a scenario
- Actionable, and use action verbs (create, sign up, buy, etc)
Be mindful of using leading words such as ‘click here’ or ‘go to that page’ in your tasks. These instructions bias the results by helping users complete their tasks—something that doesn’t happen in real life.
✨ Product tip
With Maze, you can test your prototype and live website with real users to filter out cognitive biases, and gather actionable insights that fuel product decisions.
When to conduct usability testing
To inform your design decisions, you should do usability testing early and often in the process . Here are some guidelines to help you decide when to do usability testing:
- Before you start designing
- Once you have a wireframe or prototype
- Prior to the launch of the product
- At regular intervals after launch
To learn more about usability testing, check out our complete guide to usability testing .
9. Five-second testing
Tl;dr: five-second testing.
Gauge users' first impressions and understanding of a design or layout
✅ Provides insights into the instant clarity and effectiveness of visual communication ❌ Limited to first impressions, does not assess full user experience or interaction
In five-second testing , participants are (unsurprisingly) given five seconds to view an image like a design or web page, and then they’re asked questions about the design to gauge their first impressions.
Why five seconds? According to data , 55% of visitors spend less than 15 seconds on a website, so it;s essential to grab someone’s attention in the first few seconds of their visit. With a five-second test, you can quickly determine what information users perceive and their impressions during the first five seconds of viewing a design.
Product tip 💡
And if you’re using Maze, you can simply upload an image of the screen you want to test, or browse your prototype and select a screen. Plus, you can star individual comments and automatically add them to your report to share with stakeholders.
When to conduct five-second testing
Five-second testing is typically conducted in the early stages of the design process, specifically during initial concept testing or prototype development. This way, you can evaluate your design's initial impact and make early refinements or adjustments to ensure its effectiveness, before putting design to development.
To learn more, check out our chapter on five-second testing .
10. A/B testing
Tl;dr: a/b testing.
Compare two versions of a design or feature to determine which performs better based on user engagement
✅ Provides data-driven insights to guide design decisions and optimize user experience ❌ Requires a large sample size and may not account for long-term effects or complex interactions
A/B testing , also known as split testing, compares two or more versions of a webpage, interface, or feature to determine which performs better regarding engagement, conversions, or other predefined metrics.
It involves randomly dividing users into different groups and giving each group a different version of the design element being tested. For example, let's say the primary call-to-action on the page is a button that says ‘buy now’.
You're considering making changes to its design to see if it can lead to higher conversions, so you create two versions:
- Version A : The original design with the ‘buy now’ button positioned below the product description—shown to group A
- Version B : A variation with the ‘buy now’ button now prominently displayed above the product description—shown to group B
Over a planned period, you measure metrics like click-through rates, add-to-cart rates, and actual purchases to assess the performance of each variation. You find that Group B had significantly higher click-through and conversion rates than Group A. This indicates that showing the button above the product description drove higher user engagement and conversions.
Check out our A/B testing guide for more in-depth examples and guidance on how to run these tests.
When to conduct A/B testing
A/B testing can be used at all stages of the design and development process—whenever you want to collect direct, quantitative data and confirm a suspicion, or settle a design debate. This iterative testing approach allows you to continually improve your website's performance and user experience based on data-driven insights.
11. Concept testing
Tl;dr: concept testing.
Evaluate users' reception and understanding of a new product, feature, or design idea before moving on to development
✅ Helps validate and refine concepts based on user feedback ❌ Relies on users' perception and imagination, may not reflect actual use
Concept testing is a type of research that evaluates the feasibility, appeal, and potential success of a new product before you build it. It centers the user in the ideation process, using UX research methods like A/B testing, surveys, and customer interviews.
There’s no one way to run a concept test—you can opt for concept testing surveys, interviews, focus groups, or any other method that gets qualitative data on your concept.
*Dive into our complete guide to concept testing for more tips and tricks on getting started. *
When to conduct concept testing
Concept testing helps gauge your audience’s interest, understanding, and likelihood-to-purchase, before committing time and resources to a concept. However, it can also be useful further down the product development line—such as when defining marketing messaging or just before launching.
Which is the best UX research type?
The best research type varies depending on your project; what your objectives are, and what stage you’re in. Ultimately, the ideal type of research is one which provides the insights required, using the available resources.
For example, if you're at the early ideation or product discovery stage, generative research methods can help you generate new ideas, understand user needs, and explore possibilities. As you move to the design and development phase, evaluative research methods and quantitative data become crucial.
Discover the UX research trends shaping the future of the industry and why the best results come from a combination of different research methods.
How to choose the right user experience research method
In an ideal world, a combination of all the insights you gain from multiple types of user research methods would guide every design decision. In practice, this can be hard to execute due to resources.
Sometimes the right methodology is the one you can get buy-in, budget, and time for.

Gregg Bernstein , UX Researcher at Signal
UX research tools can help streamline the research process, making regular testing and application of diverse methods more accessible—so you always keep the user at the center of your design process. Some other key tips to remember when choosing your method are:
Define the goals and problems
A good way to inform your choice of user experience research method is to start by considering your goals. You might want to browse UX research templates or read about examples of research.
Michael Margolis , UX Research Partner at Google Ventures, recommends answering questions like:
- “What do your users need?”
- “What are your users struggling with?”
- “How can you help your users?”
Understand the design process stage
If your team is very early in product development, generative research —like field studies—make sense. If you need to test design mockups or a prototype, evaluative research methods—such as usability testing—will work best.
This is something they’re big on at Sketch, as we heard from Design Researcher, Tanya Nativ. She says, “In the discovery phase, we focus on user interviews and contextual inquiries. The testing phase is more about dogfooding, concept testing, and usability testing. Once a feature has been launched, it’s about ongoing listening.”
Consider the type of insights required
If you're looking for rich, qualitative data that delves into user behaviors, motivations, and emotions, then methods like user interviews or field studies are ideal. They’ll help you uncover the ‘why’ behind user actions.
On the other hand, if you need to gather quantitative data to measure user satisfaction or compare different design variations, methods like surveys or A/B testing are more suitable. These methods will help you get hard numbers and concrete data on preferences and behavior.
*Discover the UX research trends shaping the future of the industry and why the best results come from a combination of different research methods. *
Build a deeper understanding of your users with UX research
Think of UX research methods as building blocks that work together to create a well-rounded understanding of your users. Each method brings its own unique strengths, whether it's human empathy from user interviews or the vast data from surveys.
But it's not just about choosing the right UX research methods; the research platform you use is equally important. You need a platform that empowers your team to collect data, analyze, and collaborate seamlessly.
Simplifying product research is simple with Maze. From tree testing to card sorting, prototype testing to user interview analysis—Maze makes getting actionable insights easy, whatever method you opt for.
Meanwhile, if you want to know more about testing methods, head on to the next chapter all about tree testing .
Get valuable insights from real users
Conduct impactful UX research with Maze and improve your product experience and customer satisfaction.

Frequently asked questions
How do you choose the right UX research method?
Choosing the right research method depends on your goals. Some key things to consider are:
- The feature/product you’re testing
- The type of data you’re looking for
- The design stage
- The time and resources you have available
What is the best UX research method?
The best research method is the one you have the time, resources, and budget for that meets your specific needs and goals. Most research tools, like Maze, will accommodate a variety of UX research and testing techniques.
When to use which user experience research method?
Selecting which user research method to use—if budget and resources aren’t a factor—depends on your goals. UX research methods provide different types of data:
- Qualitative vs quantitative
- Attitudinal vs behavioral
- Generative vs evaluative
Identify your goals, then choose a research method that gathers the user data you need.
What results can I expect from UX research?
Here are some of the key results you can expect from actioning the insights uncovered during UX research:
- Improved user satisfaction
- Increased usability
- Better product fit
- Informed design decisions
- Reduced development costs
- Higher conversion rates
- Increased customer loyalty and retention
Tree Testing: Your Guide to Improve Navigation and UX
Blog User research in government
https://userresearch.blog.gov.uk/2015/07/15/how-to-make-a-research-wall-when-you-dont-have-a-wall/
How to make a research wall when you don't have a wall
I love walls. I love them so much I once gave a talk about them , using a wall. And I know you love them too.
Only recently, my colleague Kate Towsey wrote about the way we use walls covered with research findings as 'vertical campfires' .
But what if you don't have a wall handy? Or you're not allowed to stick anything on your walls?
One solution is to have something portable, which you can pull out and use when you need it. My friend Harry Brignull collected some great ideas for creating portable wall spaces .
Another solution is to create something more fixed, the way I did recently at the Passport Office. We were short of wall space, so I built a temporary research wall on a balcony rail.
In the rest of this post I'll explain how I did it.

How to build a research wall
My wall was made of 6 sheets of 8 x 4 foot x 10mm foam board. If you shop around you can get 12 sheets for less than £250.
To hold it together I used a reel of white duct (gaffer) tape and a pack of cheap glue sticks.
Large sized and 10mm thick foam board sheets are quite fragile, so I started by gluing pairs of sheets together with the glue sticks. I then sealed the edges with duct tape. Two 10mm sheets glued together and taped are much stronger than a 20mm board. Think plywood.
To fix the sheets to the balcony, I simply taped them to the top and bottom balcony rails.
In a few hours I had stuck up prints of our prototype and research findings, and we were up and running.

Have you built your own wall?
If you've built your own temporary or portable research wall, or improvised a research wall in some other way, let us know. We'd love to see it.
Keep in touch. Sign up to email updates from this blog . Follow John Twitter.
Feature photograph by Allan Harris and called ' Hadrian's Wall walk - turret '. Used under a Creative Commons license.
You may also be interested in:
- Vertical campfires: our user research walls
Sharing and comments
Share this page.
Comment by Ranae posted on 10 June 2016
This is awesome! We are using a rolling marker board for a scrum board, parked without permission in an aisle, but we need more space for UI and UX content.
Related content and links
User research in government.
This blog showcases the projects user researchers are working on across government in the UK.
It's what we're learning and thinking about and a place for us to share case studies and project updates.
Government Service Design Manual: resources for user researchers
Events and training in the user-centred design community
Sign up and manage updates
Recent posts.
- What I learned as a user research course facilitator and what you can gain from it too
- Lessons from the field: an ethnographic approach to understand people’s lived experience
- Lessons from setting up a user research operations function
- Conducting ethical internal research
- Tips for communicating across a language barrier
Comments and moderation policy
- Reviews / Why join our community?
- For companies
- Frequently asked questions

User Research: What It Is and Why You Should Do It
User research is an essential part of UX design. Unless we understand who we are designing for and why, how can we even know what to create or where to begin? Depending on your project, requirements and constraints, you can choose different types of research methods, from surveys and tests to interviews and the most common method — usability testing. Here, we’ll look at what user research is, and the three most common reasons for doing user research — namely, to create designs that are truly relevant, to create designs that are easy and pleasurable to use, and to understand the return on investment of your user experience (UX) design .
What is User Research?
User research, or “design research,” as it’s sometimes called, covers a wide range of methods. It can mean anything from doing ethnographic interviews with your target group, to classical usability studies, to quantitative measurements of return on investment (ROI) on your user experience design. What all user research has in common is that it helps place people at the center of your design process and your products . You use user research to inspire your design, to evaluate your solutions, and to measure your impact. User research (and other kinds of research) is often divided into quantitative and qualitative methods.
Surveys and formal experiments such as A/B testing and tree testing are examples of quantitative research tools. Quantitative user research methods seek to measure user behavior in a way that can be quantified and used for statistical analysis.
Interviews and (to some degree) usability tests are examples of qualitative research tools. These are often more exploratory and seek to get an in-depth understanding of the experiences and everyday lives of individual users or user groups.
Each research method has benefits and drawbacks. As such, each can be used for achieving different goals. Which method you choose depends on what you want to achieve as well as a number of practical concerns, such as what type of project you are working on, your budget and your time constraints. With that in mind, let’s look at some different reasons for why you should involve users in your design process.
Three Good Reasons for Doing User Research
“ Empathy is at the heart of design. Without the understanding of what others see, feel, and experience, design is a pointless task.” — Tim Brown, CEO of the innovation and design firm IDEO
The type of user research you should do depends on your work process as well as your reason for doing user research in the first place. Here are three excellent reasons for doing user research:
1. To Create Designs That are Truly Relevant
If you understand your users, you can make designs that are relevant for them. If you don’t have a clear understanding of your users, you have no way of knowing whether your design will be relevant. A design that is not relevant to its target audience will never be a success .
The first step and core of the design thinking process is to empathize with your users. User research is one of the best ways to do that. Conducting different types of interviews and observing people in the contexts where they will use your design is a common method of doing this type of user research. We often place this type of research at the very beginning of a project to ensure that the overall direction for the project is relevant to potential customers and users. In order to ensure that your design continues to be relevant as your project progresses, validating your ideas with prospective users on a continuous basis is a vital habit to stick to. Talk to them about how they perceive your design and how they could imagine using it, or involve them directly in your design process, to ensure that you are still on the right track.
Let’s look at an example: In 2005, Korean consumer electronics giant Samsung did a number of ethnographic user studies that completely changed the way it thought about designing TVs. Together with the innovation and strategy consultancy ReD Associates, Samsung representatives visited people in different countries to observe how they live and to talk to them about their homes and the TV’s role in their homes. What they found surprised them. At the time, Samsung and most other TV manufacturers primarily designed their TVs with technical specs such as high-quality picture and sound in mind. The TVs were designed to show off their technical capabilities, but what Samsung found when visiting people was that they viewed a TV more like a piece of furniture . As a TV is turned off most of the time, people do not want it to dominate their living room. So, rather than show off their expensive TV with all its technological capabilities, they tried to hide it away as much as possible.
Following this insight, Samsung changed its design strategy radically, moving the inbuilt speakers to make the TV slimmer and creating a subtler, minimalistic design that would fit more seamlessly into people’s living rooms. Technical capabilities were still important, but they had to be balanced with design choices that made the TVs fit into people’s homes. “Home” was the watchword here, and Samsung got hard to work on the transformation. The challenge involved getting away from treating a living room like a showroom or sports bar, and going for “harmony” instead. By 2007, Samsung had doubled its share in the global TV market because it had proven to understand how to make its TVs relevant to its customers.

User research made Samsung change its TV design strategy to focus on making more minimalistic designs that fit into the customer’s home. Although TVs have not become smaller, everything extraneous has been removed. As we see here, the TV functions as a gallery-sized moving picture — with all the “bells and whistles” discreetly housed — light-years away from the old notion of “peacocking” its technical prowess as if it were a James Bond gadget.
2. To Create Designs That are Easy and Pleasurable to Use
“If the user is having a problem, it’s our problem.” — Steve Jobs, co-founder of Apple Computers
All products should have a high level of usability (i.e., be easy to use ), and usability tests can be a big help in achieving that. The days when programmed technology was a tool only to be used by experts are long gone. People expect products to be easy to learn and easy to use. They expect to pick them up and do things with them while only thinking about what they hope to achieve, not having to think about the products themselves. If your user experience is not good, chances are that people will move on to another product . Unless you work in a field with no competitors, a high level of usability (and a matching high-quality user experience) is essential in making any product a commercial success. Not to mention that your users will love you for creating a great user experience. Even if you are designing products for — e.g. — a highly specialized work environment where the users have no alternatives, products with a high level of usability will make work processes faster, safer and more efficient.
Wikiwand is a good example of a company that operates solely on providing a great user experience. Their product is a browser plugin which changes the design of Wikipedia articles to make them more appealing and user-friendly. Wikiwand does not provide different content from the classic Wikipedia webpage, but the company has thousands of users who praise it for the awesome user experience it delivers.
To the left is the classic Wikipedia interface; to the right is the Wikiwand version of the same article. The content is the same, but the experience is different.
When you are designing or developing a product, you become the primary expert on how to use it and what functionalities it has. Because you know your own product so well, however, you can become blind to functionality in your product that is difficult to use. As designers, we need that level of understanding of our products, but it also means that we can all too easily shift far away from the same perspective as our users. The author has personally participated in many projects where the designers know the ideas behind the interface and functionality of a product so well that separating the understandable from the not-so understandable is really difficult for them. This tendency of seeing things from the point of view of one’s profession — what we call “déformation professionnelle” — and not stepping back to catch the reality of what’s going on from a fresh, generalist angle is a natural one, incidentally.
Happily, though, you can avoid a lot of usability issues by following various guidelines and rules of thumb, but there will always be situations that the guidelines don’t cover, or where different guidelines tell you different things. You might also be designing for a target group such as seniors or children where the regular guidelines do not apply. That means testing the user experience of your product is always a good idea. Usability tests work best when they are an integrated part of your work process so that you test your product iteratively and from an early stage of development onward. Early tests are what we can do on primitive prototypes — e.g., using paper; from there, we progress to more refined prototypes until we have something that resembles the final product. If you only start testing when you have an almost-finished product, you run a very serious risk in that your findings might come too late for you to make larger changes to the product. For instance, if all the software is done or if you can’t push your release date, you’ll have your back against the wall. So, stay fluid with your design until the very end of the process — it’s amazing what insights can come from an eleventh-hour test of the ‘last’ version you have planned for rollout.
3. To Understand the Return on Investment of Your UX Design
Although the importance of good design has become widely recognized, UX designers and researchers still experience having to fight for resources to enable them to do their work. Executives and shareholders sometimes fail to see the value in investing in user research and UX design. UX design and user research is not as tangible as new features or fixing software bugs; so, overlooking their value can happen all the more easily. If resources become scarce, UX is also often one of the first areas to experience cuts; the reason is that consequences are not as immediately felt as when you save on development or similar areas. If you make cuts in say, software development, you can immediately see that the consequences involve cutting back on features or having buggy software; however, if you make cuts in UX, you don’t experience the consequences until your product reaches your users, and when your competitors attract your users towards them.
We can easily argue for the value of great UX; it is much more effective if we can show it. This is where studies to show the return on investment (ROI) on UX efforts are worth their weight in gold (or the weight, at least, of the printouts). If you can show that the changes you made in the design generated more sales, resulted in a larger number of customers, or made work processes more efficient, you have a much stronger case for investing in UX. User studies to measure the effect of your design are mostly quantitative and can take different forms. You can do A/B tests during development that compare different versions of your design, or you can do studies after your product is released to measure differences in use patterns. With apps and webpages, you often build in different types of analytics to inform you of different user patterns.
The global online marketplace Etsy is a good example of a company that has built its success on a focus on customer experience throughout the entire customer journey and that continuously measures the user experience.
For example , Etsy routinely tests different versions of user interfaces to constantly improve the platform’s usability as well as business metrics. Etsy's continued position as one of the largest online marketplaces is a result of its rigorous focus on usability, research and testing.

The world’s most successful companies continually test and iterate their products, as is evident in their A/B tests. Here is one of several that GoodUI has been tracking. You can see more such “leaked” tests from AirBnb, Amazon, Booking, Netflix and others on their website.
The Take Away
Here, we have shown three good reasons for doing user research and we have touched on when in your design process you can integrate user research. Here are the three reasons again:
Do user research to ensure that you create products that are truly relevant to your target group.
Do user research to ensure that your products deliver a great user experience.
Do user research to show the ROI of your design efforts.
You can — and should — do user studies at all stages of the design process. You do studies before you start designing so as to get an understanding of what your target group needs ; you carry out iterative tests during development to ensure that the user experience is on track, and you can measure the effect of your design after your product is released. This “holy trinity” approach can keep you three steps ahead as every dimension of your release will have been considered, analyzed, and tested before you sit down to see the results of the ultimate test (the ROI), more confident that you’ve got a winning design.
References and Where to Learn More
For an in-depth coverage of different user research methods, take the following courses:
User Research – Methods and Best Practices
Data-Driven Design: Quantitative Research for UX
In this interview, founder of Wikiwand, Lior Grossman explains the company’s approach to designing a more usable encyclopedia.
© Interaction Design Foundation, CC BY-SA 3.0

Get Weekly Design Tips
Topics in this article, what you should read next, the 5 stages in the design thinking process.

- 1.8k shares
What is Design Thinking and Why Is It So Popular?

- 1.6k shares
A Simple Introduction to Lean UX

- 1.3k shares
- 3 years ago
How to Do a Thematic Analysis of User Interviews

- 1.2k shares
How to Conduct User Interviews

- 2 years ago
7 Great, Tried and Tested UX Research Techniques

Make Your UX Design Process Agile Using Google’s Methodology

- 1.1k shares
Design Thinking: Get Started with Prototyping

Test Your Prototypes: How to Gather Feedback and Maximize Learning

Stage 5 in the Design Thinking Process: Test

Open Access—Link to us!
We believe in Open Access and the democratization of knowledge . Unfortunately, world-class educational materials such as this page are normally hidden behind paywalls or in expensive textbooks.
If you want this to change , cite this article , link to us, or join us to help us democratize design knowledge !
Privacy Settings
Our digital services use necessary tracking technologies, including third-party cookies, for security, functionality, and to uphold user rights. Optional cookies offer enhanced features, and analytics.
Experience the full potential of our site that remembers your preferences and supports secure sign-in.
Governs the storage of data necessary for maintaining website security, user authentication, and fraud prevention mechanisms.
Enhanced Functionality
Saves your settings and preferences, like your location, for a more personalized experience.
Referral Program
We use cookies to enable our referral program, giving you and your friends discounts.
Error Reporting
We share user ID with Bugsnag and NewRelic to help us track errors and fix issues.
Optimize your experience by allowing us to monitor site usage. You’ll enjoy a smoother, more personalized journey without compromising your privacy.
Analytics Storage
Collects anonymous data on how you navigate and interact, helping us make informed improvements.
Differentiates real visitors from automated bots, ensuring accurate usage data and improving your website experience.
Lets us tailor your digital ads to match your interests, making them more relevant and useful to you.
Advertising Storage
Stores information for better-targeted advertising, enhancing your online ad experience.
Personalization Storage
Permits storing data to personalize content and ads across Google services based on user behavior, enhancing overall user experience.
Advertising Personalization
Allows for content and ad personalization across Google services based on user behavior. This consent enhances user experiences.
Enables personalizing ads based on user data and interactions, allowing for more relevant advertising experiences across Google services.
Receive more relevant advertisements by sharing your interests and behavior with our trusted advertising partners.
Enables better ad targeting and measurement on Meta platforms, making ads you see more relevant.
Allows for improved ad effectiveness and measurement through Meta’s Conversions API, ensuring privacy-compliant data sharing.
LinkedIn Insights
Tracks conversions, retargeting, and web analytics for LinkedIn ad campaigns, enhancing ad relevance and performance.
LinkedIn CAPI
Enhances LinkedIn advertising through server-side event tracking, offering more accurate measurement and personalization.
Google Ads Tag
Tracks ad performance and user engagement, helping deliver ads that are most useful to you.
Share Knowledge, Get Respect!
or copy link
Cite according to academic standards
Simply copy and paste the text below into your bibliographic reference list, onto your blog, or anywhere else. You can also just hyperlink to this article.
New to UX Design? We’re giving you a free ebook!

Download our free ebook The Basics of User Experience Design to learn about core concepts of UX design.
In 9 chapters, we’ll cover: conducting user interviews, design thinking, interaction design, mobile UX design, usability, UX research, and many more!
New to UX Design? We’re Giving You a Free ebook!
A Guide to User Research Analysis

When designers perform user interviews, field observations, or usability tests, they gather tons of notes and data to help inform design decisions and recommendations. But how do they make sense of so much qualitative data? Talking to customers is great, but most people walk away feeling overwhelmed by the sense of more information than they know what to do with. Learning how to properly analyze UX research helps turn raw data into insights and action.
What Is User Research Analysis?
User research analysis is a vital part of any research process because it is the very act of making sense of what was learned so that informed recommendations can be made on behalf of customers or users.
As researchers conduct analysis, they’re spending time categorizing, classifying, and organizing the data they’ve gathered to directly inform what they’ll share as outcomes of the research and the key findings.
Why Should Researchers Spend Time on Analysis?
Our natural instinct is to believe we can remember everything we heard or saw in an interview. But following impulsive decisions made from raw notes and data can be misleading and dangerous. Recommendations based on a single data point can lead a team down the path of solving the wrong problem.
Further, doing so is simply reacting to data, not making sense of it. This can cause companies to focus on incremental improvements only and miss important opportunities to serve customers in more meaningful, innovative ways.
A great example of this is when we see teams sharing research findings like, “6 out of 10 people had difficulty signing in to our application.” On the surface, a reasonable recommendation could be to redesign the sign-in form. However, proper research analysis and finding the meaning behind what that data represents is when the real magic happens. Perhaps the reason people had trouble signing in was due to forgotten passwords. In this case, redesigning the sign in form wouldn’t necessarily solve this problem.
Performing the necessary analysis of user research data is an act of asking “why” the “6 out of 10 people had difficulty signing into the application.” Analysis transforms the research from raw data into insights and meaning.
Consider what Slack did with their sign-in process. Slack allows a user to sign in by manually typing their password or having a “magic link” sent to their email which the person simply needs to click from their inbox. They get signed in to their Slack team and get started.

Slack offers a magic link instead of asking users to type their password.

Slack emails a magic link within seconds that saves the user typing their password.
This decision wasn’t an accident; it came from a deep understanding of a customer pain point. That deep understanding came from making sense of user research data and not simply jumping to a conclusion. Slack’s example demonstrates the power of spending time in analyzing user research data to go beyond reacting to a single observation and instead understanding why those observations occurred.
When to Do Research Analysis
Before the research begins.
Great analysis starts before research even begins. This happens by creating well-defined goals for the project, research, and product. Creating clear goals allows researchers to collect data in predefined themes to answer questions about how to meet those goals. This also allows them to create a set of tags (sometimes known as “codes”) to assign to notes and data as they conduct their research, speeding up analysis dramatically.
Before any research session begins, craft clear goals and questions that need to be answered by the research. Then brainstorm a list of tags or descriptors for each goal that will help identify notes and data that align to the goals of the research.
During the Research
Researchers often tag or code data they gather in real time. This can be done multiple ways using spreadsheets, document highlighting or even a specialized research tool like Aurelius.
When taking notes in a spreadsheet, tags can be added to individual notes in an adjacent column and later turned into a “ rainbow spreadsheet .”
For teams physically located in the same space, an affinity diagram with sticky notes on the wall works well. Here, each note can be added to an individual sticky note with top level tags or themes grouped physically together.

A student stands in front of an affinity exercise on a whiteboard. Photo via Wikimedia
There are also software tools like Aurelius that help researchers tag and organize notes as they’re taken which also makes for quick viewing and analysis of those tags later.

View of analyzing notes and tags in Aurelius.
It’s also useful for teams to have a short debrief after each research participant or session to discuss what they learned. This keeps knowledge fresh, allows the team members to summarize what they’ve learned up to that point, and often exposes new themes or tags to use in collecting data from the remaining research sessions.
When the Research Is Done
This is where most of the analysis happens. At this point researchers are reviewing all the notes they’ve taken to really figure out what patterns and insights exist. Most researchers will have a good idea of which tags, groups, and themes to focus on, especially if they’ve done a debrief after each session. It then becomes a matter of determining why those patterns and themes exist in order to create new knowledge and insight about their customers.
How to Analyze User Research
Tag notes and data as you collect it.
Tagging notes and data as they’re collected is a process of connecting those tags to research questions and the research questions back to the project or research goals. This way you can be confident in the tags and themes being created in real time. Here’s how to make the connection between tags, research questions and project goals.
Imagine the research goals for the project are:
- Increase the number of people signing up for our product free trial
- Increase the number of people going from free trial to a paid account
- Educate trial customers about the value of our product prior to signing up for a paid account
From there, research questions can be formed such as:
- “Does the website communicate the right message to share the value of a free trial?”
- “Is it easy for a new customer to sign up?”
- “Are new customers easily able to start a free trial and begin using the product?”
From those questions, we can extract topics and themes. Since we’re researching the free trial, sign up process and general usability of that process, they become clear choices for tags. Also, since the research is meant to answer a question about whether or not potential customers understand the value of our product and free trial, this too provides a clear topic and tag we can use. So, useful tags based on those questions would be:
- #free-trial
- #value-prop
- #signup-reason
- #signup-process
- #onboarding
As the team conducts the research, they can tag notes and observations according to those themes that align to the high level goals and questions for the project. All of this highly increases the ease and effectiveness of research analysis later.
Analysis After Each Session
A common user research practice is for the team to debrief after each interview, usability test, or field study to discuss what was learned or observed. Doing this while also reviewing the notes and observations helps researchers hear the same information from a new perspective.
Let’s imagine the team found the following patterns while conducting their research:
- Potential customers visited the product page, free trial sign-up page, and went back to the product page several times prior to starting a free trial.
- Some people had multiple browsers open with competitor sites pulled up while signing up for the free trial.
- Potential customers mentioned waiting for the “right time” to start their free trial on several occasions.
This may help the researchers create new tags (or codes) for remaining sessions, such as:
- #right-time
- #competitor-review
- #feature-comparison
Using these new tags adds another dimension to analysis and provides deeper meaning to patterns the team is finding. You can see how the combination of these tags and themes already begin to paint a picture of customer needs without any detailed notes!
Here are some good tips for knowing when to tag or code a note:
- It aligns directly to a project/research goal.
- The participant specifically said or implied that something is very important.
- Repetition – a thing is said or heard multiple times.
- Patterns – when certain observations are related or important to other tags and themes already established in the project goals or research.
Steps for Analyzing Research Once It’s Done
Once all the research is done, it’s time to dig in to find patterns and frequency across all the data gathered .
Step 1 – Review the notes, transcripts, and data for any relevant phrases, statements, and concepts that align to the research goals and questions.
Step 2 – Tag and code any remaining data that represents key activities, actions, concepts, statements, ideas and needs or desires from the customers who participated in the research.
Step 3 – Review those tags and codes to find relationships between them. A useful tip for this is to pay close attention to tags that have notes with multiple other tags. This often indicates a relationship between themes. Create new tags and groups where appropriate to review more specific subsets of the data. Continue this process until meaningful themes are exposed. Once that happens, ask questions like:
- Why do these patterns or themes exist?
- Why did participants say this so many times?
- Does the data help answer the research questions?
- Does the data inform ways to meet the research goals?
- Does one tag group or theme relate to another? How? Why?
Sharing Key Insights from User Research
A key insight should answer one or more of your research questions and directly inform how to meet one or more of the established business goals. When sharing key insights, be sure to make a clear connection between one of the business goals, research questions and why the key insight is relevant to both. The most effective way of turning research into action is by helping teams make a connection between key insights and business outcomes.
3 Parts to a Key Insight
There are three parts to creating a key insight from user research :
- Statement of what you learned
- Tags that describe the insight (often used from the analysis, but can also be new tags entirely)
- Supporting notes, data, and evidence that give further context to the key insight and support the statement of what was learned
A key insight from the example project might be:
“Prospective customers are worried they might not have enough time to review our product during the free trial.” #right-time #signup-process #free-trial
This represents the pattern observed of customers mentioning the “right time” to sign up for a free trial and comparing the product to competitors. It also goes beyond sharing the quantitative data that those things occurred and offers a qualitative explanation of why they happened. All of this leads to clearer recommendations and the ability for other teams to take action on the research findings.
Creating key insights from the research in this way allows for the most effective sharing and reuse later. By providing supporting notes to each insight, stakeholders and others consuming the research findings can learn more detail about each key insight if they so choose.
Next Steps for User Research Analysis
Conducting detailed analysis of user research data helps teams clearly share what was learned to provide more actionable recommendations in design and product development.
Here are some tips for making user research analysis faster and easier on upcoming projects:
- Begin the user research by creating well defined questions and goals.
- Create tags based on each goal.
- Tag research notes and data as it’s collected to speed up analysis later.
- Debrief after each research session.
- Review the data once research is finished to find patterns, frequency, and themes.
- Make statements about each pattern or theme that was uncovered, describing what it means and why it’s important (aka: create key insights).
- Share the key insights!
- An Analytics-First Approach to UX, Part 1
- Putting Big Data in Context
- 4 Quick Tips for Getting the Most out of Google Analytics
Analytics is more than just a numbers game. It's a way of tracking and analyzing user behavior over time. In this article, we explore this intersection of user experience and data, so that budding designers can add productive web analytics to their process.
UX Booth is trusted by over 100,000 user experience professionals. Start your subscription today for free.
🗺 The ultimate user research template set

Use these templates to conduct user research and product discovery projects, from research planning to research delivery.
What you will find here :
💥 Guidelines to frame, conduct and debrief qualitative user research
💥 Methodologies to turn your findings into actionable insights
💥 Templates for collaborative workshops and product discovery assets.

What Is User Research, and What Is Its Purpose?
User research, or UX research, is an absolutely vital part of the user experience design process.
Typically done at the start of a project, it encompasses different types of research methodologies to gather valuable data and feedback. When conducting user research, you’ll engage with and observe your target users, getting to know their needs, behaviors, and pain points in relation to the product or service you’re designing.
Ultimately, user research means the difference between designing based on guesswork and assumptions, and actually creating something that solves a real user problem. In other words: Do not skip the research phase!
If you’re new to user research, fear not. We’re going to explain exactly what UX research is and why it’s so important. We’ll also show you how to plan your user research and introduce you to some key user research methods .
We’ve divided this rather comprehensive guide into the following sections. Feel free to skip ahead using the menu below:
- What is user research?
- What is the purpose of user research?
- How to plan your user research.
- An introduction to different research methods—and when to use them.
Ready? Let’s jump in.
1. What is user research?
User experience research is the systematic investigation of your users in order to gather insights that will inform the design process. With the help of various user research techniques, you’ll set out to understand your users’ needs, attitudes, pain points, and behaviors (processes like task analyses look at how users actually navigate the product experience —not just how they should or how they say they do).
Typically done at the start of a project—but also extremely valuable throughout—it encompasses different types of research methodology to gather both qualitative and quantitative data in relation to your product or service.
Before we continue, let’s consider the difference between qualitative and quantitative data .
Qualitative vs. Quantitative data: What’s the difference?
Qualitative UX research results in descriptive data which looks more at how people think and feel. It helps to find your users’ opinions, problems, reasons, and motivations. You can learn all about in-depth in this video by professional UX designer Maureen Herben:
Quantitative UX research , on the other hand, generally produces numerical data that can be measured and analyzed, looking more at the statistics. Quantitative data is used to quantify the opinions and behaviors of your users.
User research rarely relies on just one form of data collection and often uses both qualitative and quantitative research methods together to form a bigger picture. The data can be applied to an existing product to gain insight to help improve the product experiences, or it can be applied to an entirely new product or service, providing a baseline for UX, design, and development.
From the data gathered during your user research phase, you should be able to understand the following areas within the context of your product or service:
- Who your users are
- What their needs are
- What they want
- How they currently do things
- How they’d like to do them
As you consider the why of user research, remember that it’s easier than you might realize to overlook entire groups of users. It’s important to ensure that you’re conducting inclusive UX research and that starts in the earliest stages!
2. What is the purpose of user research?
The purpose of user research is to put your design project into context. It helps you understand the problem you’re trying to solve; it tells you who your users are, in what context they’ll be using your product or service, and ultimately, what they need from you, the designer! UX research ensures that you are designing with the user in mind, which is key if you want to create a successful product.
Throughout the design process, your UX research will aid you in many ways. It’ll help you identify problems and challenges, validate or invalidate your assumptions, find patterns and commonalities across your target user groups, and shed plenty of light on your users’ needs, goals, and mental models.
Why is this so important? Let’s find out.
Why is it so important to conduct user research?
Without UX research, you are essentially basing your designs on assumptions. If you don’t take the time to engage with real users, it’s virtually impossible to know what needs and pain-points your design should address.
Here’s why conducting user research is absolutely crucial:
User research helps you to design better products!
There’s a misconception that it’s ok to just do a bit of research and testing at the end of your project. The truth is that you need UX research first, followed by usability testing and iteration throughout.
This is because research makes the design better. The end goal is to create products and services that people want to use. The mantra in UX design is that some user research is always better than none .
It’s likely at some point in your UX career that you will come across the first challenge of any UX designer—convincing a client or your team to include user research in a project.
User research keeps user stories at the center of your design process.
All too often, the user research phase is seen as optional or merely “nice-to-have”—but in reality, it’s crucial from both a design and a business perspective. This brings us to our next point…
User research saves time and money!
If you (or your client) decide to skip the research phase altogether, the chances are you’ll end up spending time and money developing a product that, when launched, has loads of usability issues and design flaws, or simply doesn’t meet a real user need. Through UX research, you’ll uncover such issues early on—saving time, money, and lots of frustration!
The research phase ensures you’re designing with real insights and facts — not guesswork! Imagine you release a product that has the potential to fill a gap in the market but, due to a lack of user research, is full of bugs and usability issues. At best, you’ll have a lot of unnecessary work to do to get the product up to scratch. At worst, the brand’s reputation will suffer.
UX research gives the product a competitive edge. Research shows you how your product will perform in a real-world context, highlighting any issues that need to be ironed out before you go ahead and develop it.
User research can be done on a budget
There are ways that you can conduct faster and less costly user research , utilizing Guerrilla research outlined later on in this article (also handy if budget and time are an issue). Even the smallest amount of user research will save time and money in the long run.
The second challenge is how often businesses think they know their users without having done any research. You’ll be surprised at how often a client will tell you that user research is not necessary because they know their users!
In a 2005 survey completed by Bain, a large global management consulting firm, they found some startling results. 80% of businesses thought they knew best about what they were delivering. Only 8% of those businesses’ customers agreed.
The survey may be getting old, but the principle and misperception still persist.
In some cases, businesses genuinely do know their customers and there may be previous data on hand to utilize. However, more often than not, ‘knowing the users’ comes down to personal assumptions and opinions.
“It’s only natural to assume that everyone uses the Web the same way we do, and—like everyone else—we tend to think that our own behavior is much more orderly and sensible than it really is.” (Don’t Make Me Think ‘Revisited’, Steve Krug, 2014.) A must on every UX Designer’s bookshelf!
What we think a user wants is not the same as what a user thinks they want. Without research, we inadvertently make decisions for ourselves instead of for our target audience. To summarize, the purpose of user research is to help us design to fulfill the user’s actual needs, rather than our own assumptions of their needs.
In a nutshell, UX research informs and opens up the realm of design possibilities. It saves time and money, ensures a competitive edge, and helps you to be a more effective, efficient, user-centric designer.
3. How to plan your user research
When planning your user research , it’s good to have a mix of both qualitative and quantitative data to draw from so you don’t run into issues from the value-action gap, which can at times make qualitative data unreliable.
The value-action gap is a well-known psychology principle outlining that people genuinely don’t do what they say they would do, and is commonly referred to as what people say vs. what people do.
More than 60% of participants said they were “likely” or “very likely” to buy a kitchen appliance in the next 3 months. 8 months later, only 12% had. How Customers Think, Gerald Zaltman, 2003
When planning your user research, you need to do more than just User Focus Groups—observation of your users really is the key. You need to watch what your users do.
Part of being a great user researcher is to be an expert at setting up the right questions and getting unbiased answers from your users.
To do this we need to think like the user.
Put yourself in your user’s shoes without your own preconceptions and assumptions on how it should work and what it should be. For this, we need empathy (and good listening skills) allowing you to observe and challenge assumptions of what you already think you know about your users.
Be open to some surprises!
4. When to use different user research methods
There’s a variety of different qualitative and quantitative research methods out there. If you’ve been doing the CareerFoundry UX Design course , you may have already covered some of the list below in your course.
It isn’t an exhaustive list, but covers some of the more popular methods of research. Our student team lead runs through many of them in the video below.
Qualitative Methods:
- Guerrilla testing: Fast and low-cost testing methods such as on-the-street videos, field observations, reviews of paper sketches, or online tools for remote usability testing.
- Interviews: One-on-one interviews that follow a preset selection of questions prompting the user to describe their interactions, thoughts, and feelings in relation to a product or service, or even the environment of the product/service.
- Focus groups: Participatory groups that are led through a discussion and activities to gather data on a particular product or service. If you’ve ever watched Mad Men you’ll be familiar with the Ponds’ cold cream Focus Group !
- Field Studies: Heading into the user’s environment and observing while taking notes (and photographs or videos if possible).
- In-lab testing: Observations of users completing particular tasks in a controlled environment. Users are often asked to describe out loud their actions, thoughts, and feelings and are videoed for later analysis
- Card sorting : Used to help understand Information Architecture and naming conventions better. Can be really handy to sort large amounts of content into logical groupings for users.
Quantitative Methods:
- User surveys: Questionnaires with a structured format, targeting your specific user personas. These can be a great way to get a large amount of data. Surveymonkey is a popular online tool.
- First click testing: A test set up to analyse what a user would click on first in order to complete their intended task. This can be done with paper prototypes, interactive wireframes or an existing website.
- Eye tracking: Measures the gaze of the eye, allowing the observer to ‘see’ what the user sees. This can be an expensive test and heatmapping is a good cheaper alternative.
- Heatmapping: Visual mapping of data showing how users click and scroll through your prototype or website. The most well-known online tool to integrate would be Crazyegg.
- Web analytics: Data that is gathered from a website or prototype it is integrated with, allowing you to see the demographics of users, page views, and funnels of how users move through your site and where they drop off. The most well-known online tool to integrate would be Google Analytics .
- A/B testing: Comparing two versions of a web page to see which one converts users more. This is a great way to test button placements, colors, banners, and other elements in your UI.
Further reading
Now you know what user research is and why it’s so important. If you’re looking for a way to get trained in this particular discipline, there’s good news—owing to demand and popularity, there’s a growing number of UX research bootcamps out there.
If you’d like to learn more about UX research, you may find the following articles useful:
- What Does A UX Researcher Actually Do? The Ultimate Career Guide
- How to Conduct User Research Like a Professional
- How to Build a UX Research Portfolio (Step-by-Step Guide)
User research is the process of understanding the needs, behaviors, and attitudes of users to inform the design and development of products or services. It involves collecting and analyzing data about users through various methods such as surveys, interviews, and usability testing.
2. How to conduct user research?
User research can be conducted through various methods such as surveys, interviews, observations, and usability testing. The method chosen depends on the research goals and the resources available. Typically, user research involves defining research objectives, recruiting participants, creating research protocols, conducting research activities, analyzing data, and reporting findings.
3. Is user research the same as UX?
User research is a part of the broader UX (User Experience) field, but they are not the same. UX encompasses a wide range of activities such as design, testing, and evaluation, while user research specifically focuses on understanding user needs and behaviors to inform UX decisions.
4. What makes good user research?
Good user research is characterized by clear research goals, well-defined research protocols, appropriate sampling methods, unbiased data collection, and rigorous data analysis. It also involves effective communication of research findings to stakeholders, as well as using the findings to inform design and development decisions.
5. Is user research a good career?
User research is a growing field with many opportunities for career growth and development. With the increasing importance of user-centered design, there is a high demand for skilled user researchers in various industries such as tech, healthcare, and finance. A career in user research can be fulfilling for those interested in understanding human behavior and designing products that meet user needs.
Skip navigation
World Leaders in Research-Based User Experience
UX Research Cheat Sheet

February 12, 2017 2017-02-12
- Email article
- Share on LinkedIn
- Share on Twitter
User-experience research methods are great at producing data and insights, while ongoing activities help get the right things done. Alongside R&D, ongoing UX activities can make everyone’s efforts more effective and valuable. At every stage in the design process, different UX methods can keep product-development efforts on the right track, in agreement with true user needs and not imaginary ones.
In This Article:
When to conduct user research.
One of the questions we get the most is, “When should I do user research on my project?” There are three different answers:
- Do user research at whatever stage you’re in right now . The earlier the research, the more impact the findings will have on your product, and by definition, the earliest you can do something on your current project (absent a time machine) is today.
- Do user research at all the stages . As we show below, there’s something useful to learn in every single stage of any reasonable project plan, and each research step will increase the value of your product by more than the cost of the research.
- Do most user research early in the project (when it’ll have the most impact), but conserve some budget for a smaller amount of supplementary research later in the project. This advice applies in the common case that you can’t get budget for all the research steps that would be useful.
The chart below describes UX methods and activities available in various project stages.

Each project is different, so the stages are not always neatly compartmentalized. The end of one cycle is the beginning of the next.
The important thing is not to execute a giant list of activities in rigid order, but to start somewhere and learn more and more as you go along.
When deciding where to start or what to focus on first, use some of these top UX methods. Some methods may be more appropriate than others, depending on time constraints, system maturity, type of product or service, and the current top concerns. It’s a good idea to use different or alternating methods each product cycle because they are aimed at different goals and types of insight. The chart below shows how often UX practitioners reported engaging in these methods in our survey on UX careers.

If you can do only one activity and aim to improve an existing system, do qualitative (think-aloud) usability testing , which is the most effective method to improve usability . If you are unable to test with users, analyze as much user data as you can. Data (obtained, for instance, from call logs, searches, or analytics) is not a great substitute for people, however, because data usually tells you what , but you often need to know why . So use the questions your data brings up to continue to push for usability testing.
The discovery stage is when you try to illuminate what you don’t know and better understand what people need. It’s especially important to do discovery activities before making a new product or feature, so you can find out whether it makes sense to do the project at all .
An important goal at this stage is to validate and discard assumptions, and then bring the data and insights to the team. Ideally this research should be done before effort is wasted on building the wrong things or on building things for the wrong people, but it can also be used to get back on track when you’re working with an existing product or service.
Good things to do during discovery:
- Conduct field studies and interview users : Go where the users are, watch, ask, and listen. Observe people in context interacting with the system or solving the problems you’re trying to provide solutions for.
- Run diary studies to understand your users’ information needs and behaviors.
- Interview stakeholders to gather and understand business requirements and constraints.
- Interview sales, support, and training staff. What are the most frequent problems and questions they hear from users? What are the worst problems people have? What makes people angry?
- Listen to sales and support calls. What do people ask about? What do they have problems understanding? How do the sales and support staff explain and help? What is the vocabulary mismatch between users and staff?
- Do competitive testing . Find the strengths and weaknesses in your competitors’ products. Discover what users like best.
Exploration methods are for understanding the problem space and design scope and addressing user needs appropriately.
- Compare features against competitors.
- Do design reviews.
- Use research to build user personas and write user stories.
- Analyze user tasks to find ways to save people time and effort.
- Show stakeholders the user journey and where the risky areas are for losing customers along the way. Decide together what an ideal user journey would look like.
- Explore design possibilities by imagining many different approaches, brainstorming, and testing the best ideas in order to identify best-of-breed design components to retain.
- Obtain feedback on early-stage task flows by walking through designs with stakeholders and subject-matter experts. Ask for written reactions and questions (silent brainstorming), to avoid groupthink and to enable people who might not speak up in a group to tell you what concerns them.
- Iterate designs by testing paper prototypes with target users, and then test interactive prototypes by watching people use them. Don’t gather opinions. Instead, note how well designs work to help people complete tasks and avoid errors. Let people show you where the problem areas are, then redesign and test again.
- Use card sorting to find out how people group your information, to help inform your navigation and information organization scheme.
Testing and validation methods are for checking designs during development and beyond, to make sure systems work well for the people who use them.
- Do qualitative usability testing . Test early and often with a diverse range of people, alone and in groups. Conduct an accessibility evaluation to ensure universal access.
- Ask people to self-report their interactions and any interesting incidents while using the system over time, for example with diary studies .
- Audit training classes and note the topics, questions people ask, and answers given. Test instructions and help systems.
- Talk with user groups.
- Staff social-media accounts and talk with users online. Monitor social media for kudos and complaints.
- Analyze user-forum posts. User forums are sources for important questions to address and answers that solve problems. Bring that learning back to the design and development team.
- Do benchmark testing: If you’re planning a major redesign or measuring improvement, test to determine time on task, task completion, and error rates of your current system, so you can gauge progress over time.
Listen throughout the research and design cycle to help understand existing problems and to look for new issues. Analyze gathered data and monitor incoming information for patterns and trends.
- Survey customers and prospective users.
- Monitor analytics and metrics to discover trends and anomalies and to gauge your progress.
- Analyze search queries: What do people look for and what do they call it? Search logs are often overlooked, but they contain important information.
- Make it easy to send in comments, bug reports, and questions. Analyze incoming feedback channels periodically for top usability issues and trouble areas. Look for clues about what people can’t find, their misunderstandings, and any unintended effects.
- Collect frequently asked questions and try to solve the problems they represent.
- Run booths at conferences that your customers and users attend so that they can volunteer information and talk with you directly.
- Give talks and demos: capture questions and concerns.
Ongoing and strategic activities can help you get ahead of problems and make systemic improvements.
- Find allies . It takes a coordinated effort to achieve design improvement. You’ll need collaborators and champions.
- Talk with experts . Learn from others’ successes and mistakes. Get advice from people with more experience.
- Follow ethical guidelines . The UXPA Code of Professional Conduct is a good starting point.
- Involve stakeholders . Don’t just ask for opinions; get people onboard and contributing, even in small ways. Share your findings, invite them to observe and take notes during research sessions.
- Hunt for data sources . Be a UX detective. Who has the information you need, and how can you gather it?
- Determine UX metrics. Find ways to measure how well the system is working for its users.
- Follow Tog's principles of interaction design .
- Use evidence-based design guidelines , especially when you can’t conduct your own research. Usability heuristics are high-level principles to follow.
- Design for universal access . Accessibility can’t be tacked onto the end or tested in during QA. Access is becoming a legal imperative, and expert help is available. Accessibility improvements make systems easier for everyone.
- Give users control . Provide the controls people need. Choice but not infinite choice.
- Prevent errors . Whenever an error occurs, consider how it might be eliminated through design change. What may appear to be user errors are often system-design faults. Prevent errors by understanding how they occur and design to lessen their impact.
- Improve error messages . For remaining errors, don’t just report system state. Say what happened from a user standpoint and explain what to do in terms that are easy for users to understand.
- Provide helpful defaults . Be prescriptive with the default settings, because many people expect you to make the hard choices for them. Allow users to change the ones they might need or want to change.
- Check for inconsistencies . Work-alike is important for learnability. People tend to interpret differences as meaningful, so make use of that in your design intentionally rather than introducing arbitrary differences. Adhere to the principle of least astonishment . Meet expectations instead.
- Map features to needs . User research can be tied to features to show where requirements come from. Such a mapping can help preserve design rationale for the next round or the next team.
- When designing software, ensure that installation and updating is easy . Make installation quick and unobtrusive. Allow people to control updating if they want to.
- When designing devices, plan for repair and recycling . Sustainability and reuse are more important than ever. Design for conservation.
- Avoid waste . Reduce and eliminate nonessential packaging and disposable parts. Avoid wasting people’s time, also. Streamline.
- Consider system usability in different cultural contexts . You are not your user. Plan how to ensure that your systems work for people in other countries . Translation is only part of the challenge.
- Look for perverse incentives . Perverse incentives lead to negative unintended consequences. How can people game the system or exploit it? How might you be able to address that? Consider how a malicious user might use the system in unintended ways or to harm others.
- Consider social implications . How will the system be used in groups of people, by groups of people, or against groups of people? Which problems could emerge from that group activity?
- Protect personal information . Personal information is like money. You can spend it unwisely only once. Many want to rob the bank. Plan how to keep personal information secure over time. Avoid collecting information that isn’t required, and destroy older data routinely.
- Keep data safe . Limit access to both research data and the data entrusted to the company by customers. Advocate for encryption of data at rest and secure transport. A data breach is a terrible user experience.
- Deliver both good and bad news . It’s human nature to be reluctant to tell people what they don’t want to hear, but it’s essential that UX raise the tough issues. The future of the product, or even the company, may depend on decisionmakers knowing what you know or suspect.
- Track usability over time . Use indicators such as number and types of support issues, error rates and task completion in usability testing, and customer satisfaction ratings, to show the effectiveness of design improvements.
- Include diverse users . People can be very different culturally and physically. They also have a range of abilities and language skills. Personas are not enough to prevent serious problems, so be sure your testing includes as wide a variety of people as you can.
- Track usability bugs . If usability bugs don’t have a place in the bug database, start your own database to track important issues.
- Pay attention to user sentiment . Social media is a great place for monitoring user problems, successes, frustrations, and word-of-mouth advertising. When competitors emerge, social media posts may be the first indication.
- Reduce the need for training . Training is often a workaround for difficult user interfaces, and it’s expensive. Use training and help topics to look for areas ripe for design changes.
- Communicate future directions . Customers and users depend on what they are able to do and what they know how to do with the products and services they use. Change can be good, even when disruptive, but surprise changes are often poorly received because they can break things that people are already doing. Whenever possible, ask, tell, test with, and listen to the customers and users you have. Consult with them rather than just announcing changes. Discuss major changes early, so what you hear can help you do a better job, and what they hear can help them prepare for the changes needed.
- Recruit people for future research and testing . Actively encourage people to join your pool of volunteer testers. Offer incentives for participation and make signing up easy to do via your website, your newsletter, and other points of contact.
Use this cheat-sheet to choose appropriate UX methods and activities for your projects and to get the most out of those efforts. It’s not necessary to do everything on every project, but it’s often helpful to use a mix of methods and tend to some ongoing needs during each iteration.
Free Downloads
Related courses, discovery: building the right thing.
Conduct successful discovery phases to ensure you build the best solution
User Research Methods: From Strategy to Requirements to Design
Pick the best UX research method for each stage in the design process
Personas: Turn User Data Into User-Centered Design
Successfully turn user data into user interfaces. Learn how to create, maintain and utilize personas throughout the UX design process.
Related Topics
- Research Methods Research Methods
- Design Process
Learn More:
Please accept marketing cookies to view the embedded video. https://www.youtube.com/watch?v=7_sFVYfatXY

Always Pilot Test User Research Studies
Kim Salazar · 3 min

Level Up Your Focus Groups
Therese Fessenden · 5 min

Inductively Analyzing Qualitative Data
Tanner Kohler · 3 min
Related Articles:
Project Management for User Research: The Plan
Susan Farrell · 7 min
Open-Ended vs. Closed Questions in User Research
Maria Rosala · 5 min
Formative vs. Summative Evaluations
Alita Joyce · 5 min
UX Research Methods: Glossary
Raluca Budiu · 12 min
What a UX Career Looks Like Today
Rachel Krause and Maria Rosala · 5 min
Pilot Testing: Getting It Right (Before) the First Time
Amy Schade · 5 min
8 Creative Ways to Share Your User Research

“Unseen research is wasted research” — Gregg Bernstein.
As user researchers, we’re a lucky bunch.
Every day, we get to be at the forefront of the many unique and wonderful moments that occur during our user research sessions . The delight, the frustration, the a-ha moments, the uncertainty. Everything that makes us uniquely human.
It’s deeply satisfying leaving a research session with a new perspective. It helps add purpose and clarity to your work. It helps to steer projects and validate assumptions. It makes you more empathetic, more in-tune, more humble, both inside and outside of your work.
There’s a reason why bringing stakeholders and other team members closer to our research is so valuable, and why many organizations are placing more increasing importance on listening to the people who use their products and services (at last!).
Unfortunately the richness of information that comes from our research, doesn’t always translate well into bullet points, emails and brief summaries.
This got me thinking — how can we better translate our findings into compelling insights and anecdotes for others to embrace and enjoy?
Telling better stories
Here are a few ideas to kick-start thinking of new and creative ways to share our findings with others. To tell more compelling and impactful stories, and take others on same journeys we get to experience on a daily basis.
Bite-sized GIFs In this article , Brad Dalrymple shares simple and effective way GIFs can add a new dimension to our usability test findings. What could be more painful than watching someone click repeatedly in the wrong place? I personally like to use Monosnap — it’s free, easy to use and makes it look like you know what you’re doing. High 5’s all around.
Example Text: Users had no difficulty reordering the tags! (by Brad Dalrymple)
Get your infographics on (creativity optional) I’m not the most creative person around, but there are many great tools out there that can help you design polished infographics and charts quickly and easily. Rather than being held up by busy designers in your team, check out Canva , Piktochart or Infogram . They can help you create compelling visuals that nicely summarise the outcomes of your research (and are pretty to look at too). Here’s a neat of example of the team at Piktochart using their own tool to communicate their research findings.
Create mini-museums I love museums. There’s something that draws me into exploring complex stories at my own pace, giving me as much time as I need to process and absorb everything around me. Sometimes the stories we want to tell from our research are just as important, and just as complex. Here’s a great example of mini-museums from the Facebook research team.

Example of a comic by Bonny Colville-Hyde
Build a user research wall A great way to get into the habit of visually sharing your insights is creating a permanent home for research in your workspace. User research walls are a great way to get you into the habit of communicating your findings visually, and showing the rest of your coworkers the constant evolution of your work. The awesome Digital Service team at gov.uk shares some tips and tricks for building effective research walls here .

Our designer Keisuke with his creation.
It was a super simple exercise, that worked surprisingly well.
What if we all took some time to think of ways we could inject the voices of our users into new spaces through new media or remixed versions of old approaches?
Test, iterate, repeat.
Becoming better storytellers takes practice (and courage!).
Why not apply our own research methods to how we present our research? If our insights aren’t having the desired outcome, it’s time to test, experiment, and iterate our way to something we’d want to consume ourselves.
Ask your peers for feedback and don’t be afraid to trial new approaches.
Challenge yourself to make every research project the best, most compelling story you’ve ever told.
This article was originally published on Ania's Medium page .
Header illustration by Laura Leavitt .

Cześć, mam na imię Ania. User Researcher @optimalworkshop, Editor @mixedmthods // ???? + ???? enthusiast. Continuously caffeinated. ☕️
Related Posts
Best practices on why is UX research important to design a successful product.
The other day, I saw a bad prototype. It came up during a design critique. We were going to start user testing that very prototype the next day. I wrote down my notes and mentioned it to the designer. The problems I saw were: Typos. Simple design flaws (different colors for the same hierarchical information). Information that made no sense… Read More →
In short Atomic Research is the concept of breaking UX knowledge down into its constituent parts: The Atomic Research model — a funnel from data to conclusions, then around again Experiments “We did this…” Facts “…and we found out this…” Insights “…which makes us think this…” Conclusions “…so we’ll do that.” By breaking knowledge down like this allows for some extraordinary possibilities. How It… Read More →
Free prototyping and wireframing
Join over 1 million people on Marvel bringing their ideas to life.
Contribute to the blog
Got a great post you've written that would benefit our awesome community of 500,000 readers? Or maybe you've just got an idea in the works? Let us know!
Someone from our team will be in touch shortly.
Looking for the best stories in the design world?
We’ve got your back! Subscribe below and get them delivered right to your inbox every week.
Blog Government Digital Service
https://gds.blog.gov.uk/2014/09/03/vertical-campfires-our-user-research-walls/
Vertical campfires: our user research walls
A quick walk around our offices and you’ll see that vertical surfaces, whether wall or not, are both covered and coveted.
Project paraphernalia are our wallpaper. Sticky notes, images, screenshots, survey results, analytics and team photos name just a small selection of ‘stuff that should be stuck up there’.
More than rambunctious interior decorating, our walls have purpose. They’re vertical ‘campfires’; places where teams connect, stakeholders gather quick insight, and passersby take inspiration and add to them.
As user researchers, our walls are an important and constant broadcast signal. A well-tended wall keeps research insights and user needs constant in the collective ‘mind’ of the project team.
But enough of this poetic writing about walls. Here’s what you’ll find on some of ours.
Carer’s Allowance: mapping the service transaction
Many teams use their wall to map out end-to-end transactions for a service. The Carer’s Allowance team have done just that.
The team stick insights and notes to individual screens in the transaction. These are often quotes or comments from GOV.UK user satisfaction feedback and feedback captured while observing live claims.

Ben Holliday , user researcher on Carer’s Allowance says:
We try and post things up as they relate to each other and to understand relationships between insights, user needs and different parts of the transaction. Most importantly, everything is constantly discussed, pulled apart and updated by the project team, not just the user researchers.
User research is after all, a team sport .

Performance Platform: keeping users front of mind
Walls are great for creating a visual link between user needs and features being developed. Creating this link helps ensure that the things we’re making are grounded in users needs.
Researchers post user needs on their wall and the project team uses them to validate every story they’re planning or working on.
The wall should prompt the team to ask: “Why are we working on this?". The team should always be able to point and answer: “Because it’s helping us meet this user need.”
User needs are the foundation of everything the team is doing.

By posting things that represent users on the project wall we’re able to encourage a constant (and constantly refreshed) connection between the project team and its users.
User researcher, Will Roissetter says:
I produce lightweight personas and attribute real user quotes to them. I’ve also made a ‘new’ sticker, which I place on new personas or user stories. This encourages the team to notice when a new persona is up and draws fresh attention to the wall.

Identity Assurance (IDA): connecting with a big project team
The Identity Assurance team have used a high-traffic passageway as their wall. Everyone on the IDA project team passes the wall at least a couple times a day.
Pete Gale , user research for IDA says:
With a team our size, it’s almost impossible to involve everyone in the collaborative process, so the wall means that anyone can take a few minutes, at any time, to catch up on the latest findings. The fact that it’s in a really central location means people always see when it’s updated.

The wall shares what the IDA research team have been looking at and what they’ve recently learned. Most of the time, the team post an end-to-end user journey from the latest prototype, share supporting quotes from users and highlight issues they’re addressing.

In coming months, we’ll share more detailed ‘what’s on our wall’ posts on the user research blog . Make sure you’re subscribed .
Follow Kate on Twitter and don't forget to sign up for email alerts for the GDS blog .
You may also be interested in:
- The role of the agile wall at GDS
- Scaling Agile Practices to the GDS Portfolio
- What we’ve learnt about scaling agile
Sharing and comments
Share this page, related content and links, government digital service.
GDS is here to make digital government simpler, clearer and faster for everyone. Good digital services are better for users, and cheaper for the taxpayer.
Find out more .
Sign up and manage updates
Be part of the transformation.

If you’re interested in joining us, check out all open opportunities on the GDS careers site.
- GDS Podcasts
Recent Posts
- How we’re using Webinars to demonstrate how quick and easy it is to use GOV.UK Forms 28 February 2024
- How we are improving GOV.UK Pay with user satisfaction feedback 29 January 2024
- How we migrated our PostgreSQL database with 11 seconds downtime 17 January 2024
Comments and moderation
Social media house rules.
Read our guidelines
How to use an affinity diagram to organize UX research

Allison Thornton

When it comes to categorizing information, nothing is obvious. The way you perceive one bit of information can (and often will) differ from the next person. Why? Well, explaining that is difficult because it’s a bit like trying to explain how your brain works. Rather than getting to the bottom of neurons and synapses, UX researchers came up with a method for categorizing and sorting information using an affinity diagram, called affinity mapping.
What is affinity mapping?
Affinity mapping, sometimes also known as affinity diagramming, snowballing, or collaborative sorting, is the process of creating an affinity diagram. Simply, it’s when you gather qualitative information about your users and group it by category.

To get started with affinity mapping, you need to gather information about your users through usability testing , surveys, observation , or any other method for collecting feedback. Once garnered, you’ll need to write out each idea or finding on movable cards, like sticky notes. Then, you’ll need a large space (or a real-time online whiteboard ) where you can stick, organize, and rearrange the ideas.
But what exactly are you trying to create by rearranging all these sticky notes? An affinity diagram, of course.
What is an affinity diagram?
An affinity diagram, sometimes also known as a cluster map, is used to organize information and is the output of affinity mapping. Affinity diagrams help organize information into groups of similar items—particularly useful when analyzing qualitative data or observations.

When it comes to UX, understanding your users’ needs can be complicated. You have multiple sources for collecting customer insights or feedback beyond usability tests, like support tickets, customer service chats, interviews, and much more. But all of this information doesn’t reduce down to a number or statistic that can be measured against a KPI . That’s why making qualitative data actionable can be difficult, not to mention ambiguous.
With the use of an affinity diagram, design, research, and product teams are one step closer to synthesizing qualitative data—from multiple sources—into one, actionable visual.
How to use affinity diagrams for analyzing user research
User research is used to understand the needs, behaviors, and motivations of users in order to deliver an exceptional user experience . While monitoring click-paths, conversions, and other forms of quantitative data is useful, truly delighting your user requires you to pay attention to the things only uncovered during qualitative discovery. However, this information isn’t as easily synthesized as quantitative data, as mentioned earlier.
Commonly, user research is digested through thematic analysis. During thematic analysis, you aim to make sense of all the notes, observations, and discoveries you’ve documented across all your information sources, by creating themes to organize the information and build throughlines across every individual idea. If you haven’t guessed it already, an affinity diagram is an excellent tool for thematic analysis.
Depending on your role and the type of research you conduct, the themes you create for your affinity diagram can vary. Here are some examples of affinity groups that you could form from your UX research:
- User sentiment and facial expressions when completing certain tasks
- Frequently used words or phrases when describing a product or experience
- Suggestions for improving your product or experience
How to create a traditional affinity diagram in five easy steps
- Record all notes or observations on individual cards or sticky notes
- Look for patterns in notes or observations that are related and group them
- Create a group for each pattern or theme
- Give each theme or group a name
- Create a statement of what you learned about each group (provide your analysis or key insight)
Now that you’ve completed your affinity diagram, it’s likely time for you to share your findings with the larger group. This could include key stakeholders within your team or even the c-suite. So, surely, you want to make a good impression that tells a strong story. Unfortunately, the traditional method for affinity mapping isn’t very shareable—as whiteboards and office walls aren’t easily transported.
Make sense of your research remotely with a virtual affinity diagram template
We’re excited to announce that we’ve partnered with InVision to create an affinity diagram template for teams to organize ideas and data to collaborate remotely in real-time. The template is available in InVision’s online whiteboard , Freehand, and is completely free to use.
How to use the affinity diagram template
Step 1: Import your data from UX research
Bring your ideas to the table by creating a virtual sticky for each data point. If multiple people are collaborating on research, work synchronously and allow each person a place to record their observations.

Step 2: Look for patterns and sort by theme
Ask your team to help organize your stickies into groups. Watch each member of the team make their own connections between the data points.

Step 3: Name the groups
When every sticky has a spot, discuss what makes them similar and name each group.

Step 4: Speak up Use Freehand reactions (animated emojis to provide feedback in real-time) to vote on each category’s priority, value, and impact on the business.

Step 5: Add content
Drop in any video, photo, or other content that can reinforce each group’s theme. Add each piece of content to the Freehand for reference after your mapping session is complete.

At the end of your session, your team will better be able to synthesize your UX research methods into a more thorough understanding of your data with an easy-to-use affinity diagram template.
Are there any drawbacks to affinity mapping?
As we've seen, creating an affinity diagram is a robust method for organizing complex data into a visual structure, but if you want to be sure your efforts are effective, there are a few common pitfalls to be aware of. :
- Lack of preparation : Proper prep is vital. Be as clear as possible when you define your objectives, choose the right participants, and ensure all necessary materials are prepared. This helps avoid a disorganized session, which is sure to lead to poor quality results.
- Ignoring group dynamics : The session's dynamics can significantly influence the outcome. Ensure that every participant, regardless of how dominant or reserved they are, has their voice heard. This might involve breaking larger groups into smaller teams or using round-robin sessions to make sure everyone is involved.
- Inadequate categorization : Categories that are too broad or too narrow can make the diagram less insightful. Make sure they are meaningful and reflect the relationships within the data. It’s also a good idea to revisit and adjust categories as the session progresses.
- Rigidity in structure : Affinity diagrams should evolve. Being too rigid and not allowing for adjustments based on new insights can limit their utility. Be flexible and ready to rearrange, merge, or divide groups as new patterns emerge.
- Skipping iterations : The initial diagram is rarely perfect. Avoid treating any version as final without revisiting and refining it based on new data and feedback. Schedule follow-up sessions to continually refine the diagram.
- Neglecting documentation and follow-up : Without proper documentation and follow-up, insights gained during the session can be lost. Document the results thoroughly and distribute summaries to relevant stakeholders. Clearly outline next steps and assign responsibilities to ensure insights lead to actionable outcomes.
- Failing to measure impact : After implementing changes based on the diagram, establish metrics to assess their effectiveness and conduct follow-up studies to evaluate the outcomes. This confirms the value of the affinity diagram process and guides further improvements.
How to present affinity maps to stakeholders
Finally, remember that UX research is useless if no one acts on it–and affinity mapping sessions are no exception. Here's a few points to remember when you are presenting your data and findings:
- Prepare thoroughly : Know your audience's interests and goals. Prepare your affinity diagram to be neat and visually engaging, using tools theya re familiar with for digital presentations if possible. Readers will be much more engaged if they aren't spending time working out how to navigate the data. .
- Develop a narrative : It sounds obvious, but it's always worth reiterating: Tell a story. Start with the objectives, describe the data collection, and explain how you organized the information. This narrative should naturally lead to the insights and conclusions.
- Outline the big picture first : Introduce the overall structure and main themes of the diagram to set the context.
- Detail the specifics : Dive into the individual clusters. Describe how items were grouped and what these groups reveal about user behavior or project specifics.
- Highlight key insights : Point out significant or unexpected findings. Explain their implications for the project or product development.
- Facilitate interaction : Encourage stakeholders to ask questions and engage in discussions. This helps validate findings and fosters a sense of ownership.
- Offer actionable insights : Provide clear, actionable recommendations based on the diagram's insights. Discuss potential strategies to address user needs or issues highlighted by the diagram.
- Ensure continuous access and follow-up : Distribute documentation summarizing the presentation and insights. Arrange follow-up meetings to integrate the affinity diagram’s insights into the project continuously and discuss any revisions or new data.
By following these simple guidelines, you'll present your affinity diagram in a manner that maximizes its strategic value, translating complex data into actionable decisions that makes sure stakeholders are motivated.
Check out the new Freehand template gallery today, filled with inspiring templates contributed by industry leaders. And start using the UserTesting Affinity Diagram template to accelerate your qualitative research analysis, as well as other templates for brainstorming, sprint planning, and more.
In this Article
Get started now

The UX research methodology guidebook
About the author(s).
Allison is a Product Marketing Manager at UserTesting where she’s focused on go-to-market strategies for UserTesting partnerships and technical integrations. Aside from Product Marketing, she loves Boston sports and her cat, Stevie.
Human understanding. Human experiences.
Get the latest news on events, research, and product launches
Oh no! We're unable to display this form.
Please check that you’re not running an adblocker and if you are please whitelist usertesting.com.
If you’re still having problems please drop us an email .
By submitting the form, I agree to the Privacy Policy and Terms of Use .
Cookies on GOV.UK
We use some essential cookies to make this website work.
We’d like to set additional cookies to understand how you use GOV.UK, remember your settings and improve government services.
We also use cookies set by other sites to help us deliver content from their services.
You have accepted additional cookies. You can change your cookie settings at any time.
You have rejected additional cookies. You can change your cookie settings at any time.
Register to vote Register by 18 June to vote in the General Election on 4 July.
beta Contact the Service Manual team if you have feedback, questions or suggestions.
- Service manual
- User research
Sharing user research findings
Give feedback about this page
User research is only useful if your team can use what you’ve learned to improve your service.
Who you should share your research with
Whenever you do user research, you should share your findings with your team so they can use what you’ve learned to:
- make design decisions
- prioritise their work
- write new user stories
- refine existing user needs
- develop your proposition or product roadmap
Depending on how you carried out your research and what you learned, you might also want to share it with:
- stakeholders
- other researchers
- other service teams
- users of your service
- members of the public
The more you share, the more people will learn about your users and your service. They’ll also ask questions, spot gaps and comment on what you’re doing - all of which will help you design a better service.
How to share research findings
It’s important to update your team regularly, ideally at a fixed time each week or sprint. You should also look for opportunities to share findings with people outside your team.
You can share what you’ve learned by:
- presenting findings at show and tells
- updating your research wall (eg a wall in your team space where you put up journey maps, personas, insights, screenshots, analytics etc)
- presenting video clips of your research
- creating posters with quotes from participants
- blogging on a departmental blog
- putting together an empathy map , which shows what you’ve learned about your users
You should share your findings as soon as possible. The sooner the team understands what you’ve learned, the sooner they can use the findings to make informed decisions about how to design and build the service.
Find out how to build a research wall .
Presenting your findings
A simple way to present research findings is to create a group of slides (or ‘slide deck’) that includes:
- 1 or 2 slides that outline the research you did
- 5-10 slides that describe your findings
- 1 or 2 slides that show what you’re doing next (if relevant)
Slide decks in this format are easy to talk through at a show and tell. They also make sense on their own, so can be shared and understood easily by people who miss your presentation.
As sprints go by, your collection of slide decks will provide a record of what you’ve learned about your users. This is useful because researchers on an agile team won’t have time to write research reports (though they might produce brief research summaries).
Structuring research slides
When writing findings slides for a show and tell, answer the basic questions of ‘who’, ‘what’, ‘when’, ‘where’, ‘why’ and ‘how’.
Each findings slide should include:
- a headline that communicates something you’ve learned
- 1 or 2 sentences that describe the essential facts of the finding
- 1 or 2 sentences that explain its importance and any consequences
- a relevant photo or screenshot of what you were testing, or a quote from a participant
You might also want to include:
- analytics data that supports your findings
- design work or sketches for any potential solutions
- short video clips from your research (1 or 2 minutes is usually enough)
- summaries of other research which is relevant to your team’s work
Focus every finding on your users. Try to explain who they are, what they do, how they think, what they need and what happened during the session.
Examples and case studies
To find out more about sharing your research:
- get tips on presenting user research
- see how Government as a Platform involves developers in research
Related guides
You may also find these guides useful:
- Analyse a research session
- Start by learning user needs
Guidance first published
Is this page useful?
- Yes this page is useful
- No this page is not useful
Help us improve GOV.UK
Don’t include personal or financial information like your National Insurance number or credit card details.
To help us improve GOV.UK, we’d like to know more about your visit today. Please fill in this survey (opens in a new tab) .
- Get in touch
- Enterprise & IT
- Banking & Financial Services
- News media & Entertainment
- Healthcare & Lifesciences
- Networks and Smart Devices
- Education & EdTech
- Service Design
- UI UX Design
- Data Visualization & Design
- User & Design Research
- In the News
- Our Network
- Voice Experiences
- Golden grid
- Critical Thinking
- Enterprise UX
- 20 Product performance metrics
- Types of Dashboards
- Interconnectivity and iOT
- Healthcare and Lifesciences
- Airtel XStream
- Case studies
Data Design
- UCD vs. Design Thinking
User & Design Research
Fly on the wall.
Fly on the wall research is an observational technique that allows a researcher to collect data by seeing and listening. Usually researchers employ this method to gain insight into people, environment, interactions and objects in a space. It is the primary responsibility of the researcher to stay completely unnoticed during the observation so as to not bias the participants in any way.
Quick details: Fly On The Wall
Structure: Structured, Semi-structured
Preparation: Topics, Structure, Recording tools
Deliverables: Recordings, Notes
More about Fly on the wall
This method has its limitations, as it does not allow the researcher to probe or follow up with participants. Frameworks for note taking and methods such as AEIOU can help analyze observational data. Unlike in the case of unfocus groups, note-taking frameworks/structures and tools are crucial to this method. Further, determining the right documentation tools is critical and should be dependent on the environment in which you are exploring. For example, hand notes may be less obvious than documenting with your cell phone. To validate your insights, repeat your Fly On The Wall observation again and/or use other research methods to confirm your data.
Advantages of Fly on the wall
1. low cost.
Fly on the wall is a low cost/effort method to gather qualitative data.
2. Minimal researcher bias
As the researcher is only observing, not verbally probing or intervening during this data collection method, the researchers own biases do not influence the participant’s responses or behavior.
3. Flexible Design
The method places a greater level of flexibility in the hands of the participants. So, the design is flexible as the participants choose fit.
4. Flexible logistics
The observation can be done anywhere, as it is not location specific but participant-specific.
5. People-centered
The main purpose of the research is to get insights about people from observations.
Disadvantages of Fly on the wall
1. limited and subjective data.
With great emphasis placed at the participant’s end, the data gather would be subjective to the participant. Additionally, the data gathered would be difficult to generalize for a wider audience.
2. Non-adaptive
As the researcher cannot interfere, intervene or verbally probe the participants, any questions that may arise in the mind of the observer would stay with the observer.
3. Limited sensitivity and empathy
By limiting the scope for the observer to connect with participants, fly on the wall method also limits the level of sensitivity and empathy the researcher can feel for the participants.
4. Multiple Observations
To ascertain results or findings, multiple observations may be necessary to arrive at a more accurate conclusion for the research .
Think Design's recommendation
Fly on the wall should be used when you want to observe people and environment together, without your presence being felt. This is not a method to observe an individual user. Say, you want to capture how people interact with each other in a market or say, in a restaurant.
Do not use Fly on the wall as a technique when the context of environment is unimportant and when you are researching an individual user.
Was this Page helpful?
Related methods.
- Card Sorting
- Concurrent Probing
- Contextual Inquiry
- Dyads & Triads
- Extreme User Interviews
- Focus Groups
- In-depth Interviews
- Personal Inventory
- Retrospective Probing
- Unfocus Group
- User Testing/ Validation
- Word Concept Association
UI UX DESIGN
Service design.
We use cookies to ensure that we give you the best experience on our website. If you continue we'll assume that you accept this. Learn more
Recent Tweets
Sign up for our newsletter.
Subscribe to our newsletter to stay updated with the latest insights in UX, CX, Data and Research.
Get in Touch
Thank you for subscribing.
You will be receive all future issues of our newsletter.
Thank you for Downloading.
One moment….
While the report downloads, could you tell us…
The state of AI in early 2024: Gen AI adoption spikes and starts to generate value
If 2023 was the year the world discovered generative AI (gen AI) , 2024 is the year organizations truly began using—and deriving business value from—this new technology. In the latest McKinsey Global Survey on AI, 65 percent of respondents report that their organizations are regularly using gen AI, nearly double the percentage from our previous survey just ten months ago. Respondents’ expectations for gen AI’s impact remain as high as they were last year , with three-quarters predicting that gen AI will lead to significant or disruptive change in their industries in the years ahead.
About the authors
This article is a collaborative effort by Alex Singla , Alexander Sukharevsky , Lareina Yee , and Michael Chui , with Bryce Hall , representing views from QuantumBlack, AI by McKinsey, and McKinsey Digital.
Organizations are already seeing material benefits from gen AI use, reporting both cost decreases and revenue jumps in the business units deploying the technology. The survey also provides insights into the kinds of risks presented by gen AI—most notably, inaccuracy—as well as the emerging practices of top performers to mitigate those challenges and capture value.
AI adoption surges
Interest in generative AI has also brightened the spotlight on a broader set of AI capabilities. For the past six years, AI adoption by respondents’ organizations has hovered at about 50 percent. This year, the survey finds that adoption has jumped to 72 percent (Exhibit 1). And the interest is truly global in scope. Our 2023 survey found that AI adoption did not reach 66 percent in any region; however, this year more than two-thirds of respondents in nearly every region say their organizations are using AI. 1 Organizations based in Central and South America are the exception, with 58 percent of respondents working for organizations based in Central and South America reporting AI adoption. Looking by industry, the biggest increase in adoption can be found in professional services. 2 Includes respondents working for organizations focused on human resources, legal services, management consulting, market research, R&D, tax preparation, and training.
Also, responses suggest that companies are now using AI in more parts of the business. Half of respondents say their organizations have adopted AI in two or more business functions, up from less than a third of respondents in 2023 (Exhibit 2).
Gen AI adoption is most common in the functions where it can create the most value
Most respondents now report that their organizations—and they as individuals—are using gen AI. Sixty-five percent of respondents say their organizations are regularly using gen AI in at least one business function, up from one-third last year. The average organization using gen AI is doing so in two functions, most often in marketing and sales and in product and service development—two functions in which previous research determined that gen AI adoption could generate the most value 3 “ The economic potential of generative AI: The next productivity frontier ,” McKinsey, June 14, 2023. —as well as in IT (Exhibit 3). The biggest increase from 2023 is found in marketing and sales, where reported adoption has more than doubled. Yet across functions, only two use cases, both within marketing and sales, are reported by 15 percent or more of respondents.
Gen AI also is weaving its way into respondents’ personal lives. Compared with 2023, respondents are much more likely to be using gen AI at work and even more likely to be using gen AI both at work and in their personal lives (Exhibit 4). The survey finds upticks in gen AI use across all regions, with the largest increases in Asia–Pacific and Greater China. Respondents at the highest seniority levels, meanwhile, show larger jumps in the use of gen Al tools for work and outside of work compared with their midlevel-management peers. Looking at specific industries, respondents working in energy and materials and in professional services report the largest increase in gen AI use.
Investments in gen AI and analytical AI are beginning to create value
The latest survey also shows how different industries are budgeting for gen AI. Responses suggest that, in many industries, organizations are about equally as likely to be investing more than 5 percent of their digital budgets in gen AI as they are in nongenerative, analytical-AI solutions (Exhibit 5). Yet in most industries, larger shares of respondents report that their organizations spend more than 20 percent on analytical AI than on gen AI. Looking ahead, most respondents—67 percent—expect their organizations to invest more in AI over the next three years.
Where are those investments paying off? For the first time, our latest survey explored the value created by gen AI use by business function. The function in which the largest share of respondents report seeing cost decreases is human resources. Respondents most commonly report meaningful revenue increases (of more than 5 percent) in supply chain and inventory management (Exhibit 6). For analytical AI, respondents most often report seeing cost benefits in service operations—in line with what we found last year —as well as meaningful revenue increases from AI use in marketing and sales.
Inaccuracy: The most recognized and experienced risk of gen AI use
As businesses begin to see the benefits of gen AI, they’re also recognizing the diverse risks associated with the technology. These can range from data management risks such as data privacy, bias, or intellectual property (IP) infringement to model management risks, which tend to focus on inaccurate output or lack of explainability. A third big risk category is security and incorrect use.
Respondents to the latest survey are more likely than they were last year to say their organizations consider inaccuracy and IP infringement to be relevant to their use of gen AI, and about half continue to view cybersecurity as a risk (Exhibit 7).
Conversely, respondents are less likely than they were last year to say their organizations consider workforce and labor displacement to be relevant risks and are not increasing efforts to mitigate them.
In fact, inaccuracy— which can affect use cases across the gen AI value chain , ranging from customer journeys and summarization to coding and creative content—is the only risk that respondents are significantly more likely than last year to say their organizations are actively working to mitigate.
Some organizations have already experienced negative consequences from the use of gen AI, with 44 percent of respondents saying their organizations have experienced at least one consequence (Exhibit 8). Respondents most often report inaccuracy as a risk that has affected their organizations, followed by cybersecurity and explainability.
Our previous research has found that there are several elements of governance that can help in scaling gen AI use responsibly, yet few respondents report having these risk-related practices in place. 4 “ Implementing generative AI with speed and safety ,” McKinsey Quarterly , March 13, 2024. For example, just 18 percent say their organizations have an enterprise-wide council or board with the authority to make decisions involving responsible AI governance, and only one-third say gen AI risk awareness and risk mitigation controls are required skill sets for technical talent.
Bringing gen AI capabilities to bear
The latest survey also sought to understand how, and how quickly, organizations are deploying these new gen AI tools. We have found three archetypes for implementing gen AI solutions : takers use off-the-shelf, publicly available solutions; shapers customize those tools with proprietary data and systems; and makers develop their own foundation models from scratch. 5 “ Technology’s generational moment with generative AI: A CIO and CTO guide ,” McKinsey, July 11, 2023. Across most industries, the survey results suggest that organizations are finding off-the-shelf offerings applicable to their business needs—though many are pursuing opportunities to customize models or even develop their own (Exhibit 9). About half of reported gen AI uses within respondents’ business functions are utilizing off-the-shelf, publicly available models or tools, with little or no customization. Respondents in energy and materials, technology, and media and telecommunications are more likely to report significant customization or tuning of publicly available models or developing their own proprietary models to address specific business needs.
Respondents most often report that their organizations required one to four months from the start of a project to put gen AI into production, though the time it takes varies by business function (Exhibit 10). It also depends upon the approach for acquiring those capabilities. Not surprisingly, reported uses of highly customized or proprietary models are 1.5 times more likely than off-the-shelf, publicly available models to take five months or more to implement.
Gen AI high performers are excelling despite facing challenges
Gen AI is a new technology, and organizations are still early in the journey of pursuing its opportunities and scaling it across functions. So it’s little surprise that only a small subset of respondents (46 out of 876) report that a meaningful share of their organizations’ EBIT can be attributed to their deployment of gen AI. Still, these gen AI leaders are worth examining closely. These, after all, are the early movers, who already attribute more than 10 percent of their organizations’ EBIT to their use of gen AI. Forty-two percent of these high performers say more than 20 percent of their EBIT is attributable to their use of nongenerative, analytical AI, and they span industries and regions—though most are at organizations with less than $1 billion in annual revenue. The AI-related practices at these organizations can offer guidance to those looking to create value from gen AI adoption at their own organizations.
To start, gen AI high performers are using gen AI in more business functions—an average of three functions, while others average two. They, like other organizations, are most likely to use gen AI in marketing and sales and product or service development, but they’re much more likely than others to use gen AI solutions in risk, legal, and compliance; in strategy and corporate finance; and in supply chain and inventory management. They’re more than three times as likely as others to be using gen AI in activities ranging from processing of accounting documents and risk assessment to R&D testing and pricing and promotions. While, overall, about half of reported gen AI applications within business functions are utilizing publicly available models or tools, gen AI high performers are less likely to use those off-the-shelf options than to either implement significantly customized versions of those tools or to develop their own proprietary foundation models.
What else are these high performers doing differently? For one thing, they are paying more attention to gen-AI-related risks. Perhaps because they are further along on their journeys, they are more likely than others to say their organizations have experienced every negative consequence from gen AI we asked about, from cybersecurity and personal privacy to explainability and IP infringement. Given that, they are more likely than others to report that their organizations consider those risks, as well as regulatory compliance, environmental impacts, and political stability, to be relevant to their gen AI use, and they say they take steps to mitigate more risks than others do.
Gen AI high performers are also much more likely to say their organizations follow a set of risk-related best practices (Exhibit 11). For example, they are nearly twice as likely as others to involve the legal function and embed risk reviews early on in the development of gen AI solutions—that is, to “ shift left .” They’re also much more likely than others to employ a wide range of other best practices, from strategy-related practices to those related to scaling.
In addition to experiencing the risks of gen AI adoption, high performers have encountered other challenges that can serve as warnings to others (Exhibit 12). Seventy percent say they have experienced difficulties with data, including defining processes for data governance, developing the ability to quickly integrate data into AI models, and an insufficient amount of training data, highlighting the essential role that data play in capturing value. High performers are also more likely than others to report experiencing challenges with their operating models, such as implementing agile ways of working and effective sprint performance management.
About the research
The online survey was in the field from February 22 to March 5, 2024, and garnered responses from 1,363 participants representing the full range of regions, industries, company sizes, functional specialties, and tenures. Of those respondents, 981 said their organizations had adopted AI in at least one business function, and 878 said their organizations were regularly using gen AI in at least one function. To adjust for differences in response rates, the data are weighted by the contribution of each respondent’s nation to global GDP.
Alex Singla and Alexander Sukharevsky are global coleaders of QuantumBlack, AI by McKinsey, and senior partners in McKinsey’s Chicago and London offices, respectively; Lareina Yee is a senior partner in the Bay Area office, where Michael Chui , a McKinsey Global Institute partner, is a partner; and Bryce Hall is an associate partner in the Washington, DC, office.
They wish to thank Kaitlin Noe, Larry Kanter, Mallika Jhamb, and Shinjini Srivastava for their contributions to this work.
This article was edited by Heather Hanselman, a senior editor in McKinsey’s Atlanta office.
Explore a career with us
Related articles.

Moving past gen AI’s honeymoon phase: Seven hard truths for CIOs to get from pilot to scale

A generative AI reset: Rewiring to turn potential into value in 2024

Implementing generative AI with speed and safety
Wall Street Trade Failure Rate Rise in Third Day of Faster Settlement

A Wall St. sign is seen near the New York Stock Exchange (NYSE) in New York City, U.S., May 4, 2021. REUTERS/Brendan McDermid
NEW YORK (Reuters) -The U.S. trade failure rate rose on Thursday, the fourth day of the newly launched faster settlement cycle, according to data released by the Depository Trust and Clearing Corporation on Friday.
The fail settlement rate stood at 2.71% on Thursday versus an average of 1.90% in the previous two days. The average for May before the shorter settlement cycle was 2.01%.
U.S. trading of equities, corporate and municipal bonds and other securities moved on Tuesday to a one-day settlement cycle (T+1) from two days (T+2), to comply with a rule change the SEC adopted in February.
DTCC did not immediately comment on the reasons for the spike in the fail rate.
Despite a higher failure, U.S. Securities and Exchange Commission Chair Gary Gensler said on Friday he considers the overhaul of the settlement cycle for U.S. securities has gone well this week.
"The historic conversion from T+2 to T+1 has gone smoothly thus far," Gensler said in an emailed statement. "We remain in close contact with the clearinghouses and other market participants as we continue to monitor the transition ahead of increases in trading volumes expected this afternoon."
Market participants have said the transition was going smoothly, despite some expected bumps.
Research firm ValueExchange said on average market participants expected the fail rate to increase to 4.1% after T+1 implementation, from 2.9%, according to a survey released prior to the implementation of the faster settlement.
(Reporting by Carolina Mandl and Chris Prentice; Editing by Josie Kao)
Copyright 2024 Thomson Reuters .
Tags: United States , financial regulation
The Best Financial Tools for You
Credit Cards

Personal Loans

Comparative assessments and other editorial opinions are those of U.S. News and have not been previously reviewed, approved or endorsed by any other entities, such as banks, credit card issuers or travel companies. The content on this page is accurate as of the posting date; however, some of our partner offers may have expired.

Subscribe to our daily newsletter to get investing advice, rankings and stock market news.
See a newsletter example .
You May Also Like
Fidelity vs. charles schwab.
Marc Guberti May 31, 2024

7 Best Oil and Gas Stocks to Buy in 2024
Matt Whittaker May 31, 2024

Testing Dave Ramsey's Investing Advice
Wayne Duggan May 31, 2024

7 of the Best Ways to Invest $5,000
Tony Dong May 31, 2024

9 Best Growth Stocks to Buy for 2024
Wayne Duggan May 30, 2024

5 of the Best Stocks to Buy Now
Ian Bezek May 30, 2024

Recovering From a Stock Market Loss
Tony Dong May 30, 2024

How to Invest in India's Stock Market
Jeff Reeves May 30, 2024

7 Best High-Dividend ETFs for Income
Glenn Fydenkevez May 29, 2024

7 Top Women Investors
Coryanne Hicks May 29, 2024

7 Best Mid Cap Stocks to Buy Now
Jeff Reeves May 29, 2024

Best Vanguard Funds for Beginners
Tony Dong May 28, 2024

10 of the Best Stocks to Buy for 2024
John Divine May 28, 2024

9 Best Cheap Stocks to Buy Under $10
Wayne Duggan May 28, 2024
8 Stocks Warren Buffett Bought & Sold
Jeff Reeves May 28, 2024

Top-Rated ETFs to Buy Now
Marc Guberti May 28, 2024

7 Best Long-Term Stocks to Buy
Glenn Fydenkevez May 24, 2024

What Is Par Value for Stocks and Bonds?
Coryanne Hicks May 24, 2024

11 Top Sector ETFs to Buy
Jeff Reeves May 24, 2024

Stock Market Holidays in 2024
Daniel J. Lee May 24, 2024

- My View My View
- Following Following
- Saved Saved
Nvidia set to overtake Apple as world's second-most valuable company
- Medium Text

Sign up here.
Reporting by Medha Singh in Bengaluru and Saqib Iqbal Ahmed in New York
Our Standards: The Thomson Reuters Trust Principles. New Tab , opens new tab

Technology Chevron

Spotify raises U.S. prices of its premium plans in margin push
Spotify raised prices for its premium plans in the United States on Monday, the latest step by the Swedish music-streaming service in its push to increase margins.

We've detected unusual activity from your computer network
To continue, please click the box below to let us know you're not a robot.
Why did this happen?
Please make sure your browser supports JavaScript and cookies and that you are not blocking them from loading. For more information you can review our Terms of Service and Cookie Policy .
For inquiries related to this message please contact our support team and provide the reference ID below.
How to make money from medical research and donations
- You can make thousands of dollars by donating some time or body parts to science.
- But these procedures are not all painless, and not everyone can participate.
- Below is a short list, though be warned: these strategies aren't all easy money.
Get dysentery. Play cards with someone who has the flu . Or, spend 45 days trapped in a tiny apartment with three total strangers.
These are just a few of the many ways you can get paid for helping out with scientific research. If you want to aid the science community and potentially save some lives while making a little extra cash, there are some unconventional options to consider.
Below is a short list, though be warned: these strategies aren't all exactly easy money.
Sell your blood plasma
Payout (per donation): around $50
Plasma is the largest component in human blood. It's a protein-rich liquid that contains mostly water but is also filled with enzymes, antibodies, and salts. This gooey, sticky yellow-ish stuff can be used to create therapies that treat people with blood clotting disorders, autoimmune diseases, and even burn victims. Donating plasma is often called "the gift of life" since treatments for some conditions can't be made synthetically and require this kind of human contribution.
During plasma donation, blood is drawn and an automated machine separates the plasma from other blood components, which are returned to the donor. Plasma donation pay varies from site to site, but the average payout is typically around $50 per donation. You can donate safely roughly once a month, according to the American Red Cross , and a typical session takes less than two hours. Find a licensed and certified plasma center near you.
Donate your sex cells
Payout for eggs (per donation): usually $10,000 to $12,000;
Payout for sperm (per donation): typically $35-$150
Egg and sperm donation can allow couples who have trouble conceiving naturally to become parents by using a donor's sex cells. But the time commitment and risk involved in a woman's egg donation is far steeper than what a man goes through donating his sperm.
In the United States, egg donors generally net around $10,000-$12,000. Weill Cornell outlines the standard steps for egg donation , which requires about a four-week time commitment.
During the egg donation cycle, patients are injected with fertility drugs so that the ovaries make more mature eggs than normal. (Eligible women are generally between the ages of 21 and 30). The egg retrieval procedure takes about 20 minutes but may require several days of recovery. Donors should be aware of the risks involved (largely related to the hormones used) before signing up.
Related stories
Men are generally paid anywhere from $35 to $150 per sperm donation, according to The Sperm Bank of California , but sperm donation can really start to add up if you regularly donate samples (many programs require a six-month or one-year donation commitment).
Donors should bear in mind that even if they choose to donate anonymously, sperm and egg donation is never really 100% incognito. Your DNA always knows who you are.
Spend 45 days on a fake spaceship
Payout: $160/day
NASA will pay you to spend 45 days traveling in space. Well, sort of.
You'll actually be on the ground the whole time in Houston, Texas, but you'll be locked inside a model space capsule (650 square feet) along with three strangers. This simulation is designed to study what being cooped up for a very long time inside a spaceship might do to a person, both physically and mentally. NASA wants to check this out thoroughly before they start sending astronauts on missions to Mars, or to explore faraway asteroids.
Participants in NASA's human research program share a capsule with each other that includes some workspace for doing lab experiments, a little kitchen table for eating meals that are just like what's served aboard the International Space Station, plus an exercise bike and some free weights. There's no internet, but you do get your own little cozy sleeping pod on the top floor.
The fake astronauts "on board" the capsule in May and June of 2024 include an aerospace engineering professor, a US Air Force Reserve member, a commercial pilot, and a biomedical engineer.
And that mission is nothing compared to NASA's CHAPEA Mars simulation , which keeps recruits in a simulated habitat of the red planet for 378 days. (NASA declined to comment on how much CHAPEA pays).
Take part in a clinical trial
Payout: Varies by program
The National Institutes of Health run a searchable database, ClincalTrials.gov , that rounds up human clinical studies ongoing around the world. Participants may be guinea pigs for new medical products, like drugs to treat high blood pressure, or they take part in observational research, like a study that records the effects of different lifestyles on heart health.
Subjects are generally paid to participate in such clinical trials, and most of the time, the bigger the risk, the bigger the reward. For example, a participant in one study in which participants were exposed to dysentery-causing bacteria was paid over $7,000, while a single blood draw or lab visit for a more straightforward study may only be worth $100 or so.
If you do decide to enroll in a study, choose wisely and carefully because not all of the studies on the site are regulated or evaluated for safety by the US Food and Drug Administration.
Enroll in a psychological study
Paid psychological studies, such as those that examine human behavior and brain function, may not generate as high of a return as clinical trials, but they are generally lower risk and require a shorter time commitment.
Most research universities keep an online database of studies so people can easily sign up. For example, here's a list of the most recent paid research studies offered by New York University . At NYU, you can make $12 an hour playing video games, and receive a $50 bonus if you're good at it.
Give your dead body to science
Payout: free cremation
This last idea is sort of morbid, but if you're worried about being a bother when you're dead, you can donate your body to science . This helps with various types of research and education.
Places like BioGift and Science Care will cover the costs of cremation, which can run upwards of $2,000.
- Main content
IMAGES
VIDEO
COMMENTS
A research wall enables you to identify patterns within your data, while also providing a place to share your research with others as it develops. Often, you start synthesizing data by simply clustering it according to specific categories or by creating a simple mind map of your dataset. Using an interactive convergent method, such as octopus ...
Step #1: Define research objectives. Go ahead - create that fake persona. Step #2: Pick your methods. Qualitative methods - the WHY. Quantitative methods - the WHAT. Behavioral and attitudinal methods. Step #3: Find your participants. How to recruit participants.
Using a Research Wall to analyse user research data. In my personal experience, Research Walls support a thematic analysis of user interviews (and most types of qualitative data), as organising all your information in this way naturally fosters the discovery of common themes, ideas and patterns. Further input can also be included to help build ...
Creating a synthesis wall with data, materials and observations from user research is a huge contribution to the design process. The wall allows to develop a shared understanding of the research process and outcomes, and it's beneficial to both team members directly involved in the project and other colleagues just passing by.
A UX research method is a way of generating insights about your users, their behavior, motivations, and needs. These methods help: Learn about user behavior and attitudes. Identify key pain points and challenges in the user interface. Develop user personas to identify user needs and drive solutions.
How to build a research wall. My wall was made of 6 sheets of 8 x 4 foot x 10mm foam board. If you shop around you can get 12 sheets for less than £250. To hold it together I used a reel of white duct (gaffer) tape and a pack of cheap glue sticks. Large sized and 10mm thick foam board sheets are quite fragile, so I started by gluing pairs of ...
User research is the methodic study of target users—including their needs and pain points—so designers have the sharpest possible insights to make the best designs. User researchers use various methods to expose problems and design opportunities and find crucial information to use in their design process. Discover why user research is a ...
Build a user research wall A great way to get into the habit of visually sharing your insights is creating a permanent home for research in your workspace. User research walls are a great way to ...
The type of user research you should do depends on your work process as well as your reason for doing user research in the first place. Here are three excellent reasons for doing user research: 1. To Create Designs That are Truly Relevant. If you understand your users, you can make designs that are relevant for them.
Steps for Analyzing Research Once It's Done. Once all the research is done, it's time to dig in to find patterns and frequency across all the data gathered. Step 1 - Review the notes, transcripts, and data for any relevant phrases, statements, and concepts that align to the research goals and questions.
Use these templates to conduct user research and product discovery projects, from research planning to research delivery. What you will find here : 💥 Guidelines to frame, conduct and debrief qualitative user research. 💥 Methodologies to turn your findings into actionable insights. 💥 Templates for collaborative workshops and product ...
User research, or UX research, is an absolutely vital part of the user experience design process. Typically done at the start of a project, it encompasses different types of research methodologies to gather valuable data and feedback. When conducting user research, you'll engage with and observe your target users, getting to know their needs ...
UX Research Cheat Sheet. Susan Farrell. February 12, 2017. Summary: User research can be done at any point in the design cycle. This list of methods and activities can help you decide which to use when. User-experience research methods are great at producing data and insights, while ongoing activities help get the right things done.
Build a user research wall A great way to get into the habit of visually sharing your insights is creating a permanent home for research in your workspace. User research walls are a great way to get you into the habit of communicating your findings visually, and showing the rest of your coworkers the constant evolution of your work. ...
As user researchers, our walls are an important and constant broadcast signal. A well-tended wall keeps research insights and user needs constant in the collective 'mind' of the project team. But enough of this poetic writing about walls. Here's what you'll find on some of ours. Carer's Allowance: mapping the service transaction
How to use the affinity diagram template. Step 1: Import your data from UX research. Bring your ideas to the table by creating a virtual sticky for each data point. If multiple people are collaborating on research, work synchronously and allow each person a place to record their observations.
Scope. Second, Scope — the bulk of the work. The how and when — processes, methods. Recruitment and admin. Third, Recruitment and admin. Something that every researcher grapples with and often ...
How sharing user research findings helps your team iterate and improve your service. ... updating your research wall (eg a wall in your team space where you put up journey maps, personas, insights ...
1. Low cost. Fly on the wall is a low cost/effort method to gather qualitative data. 2. Minimal researcher bias. As the researcher is only observing, not verbally probing or intervening during this data collection method, the researchers own biases do not influence the participant's responses or behavior. 3.
6. Alexandra Nguyen's evaluative research hardware project with Nuro. While the case studies in this UX research portfolio are password-protected, this UX research portfolio by Alexandra M. Nguyen, a UX researcher at Nuro, provides a high-level timeline overview of how she created her path to UX research.
Following hot on the heels of empathy, my next class was designed to dig a bit into guerrilla user research techniques. Personally, I'm a big fan of hallway tests or interviews, but usually before I even go there, I like to do a bit of investigati...
In order to gather that information we utilize reports from your existing site, as well as information we gather from a number of different engagements with your site users. Foundational research that sets the stage for all future inquiries. Employ quantitative and qualitative methods to test users. Create design solutions to the problems ...
OA researchers can use Unpaywall to answer research questions about the current and historical state of open access. There are several popular ways to access the data for research: you can use the REST API, the R API wrapper, the Simple Query Tool, or download the whole dataset. A particularly easy way to get started with research is to use Dimensions, Scopus, or Web of Science, which all have ...
About the research. The online survey was in the field from February 22 to March 5, 2024, and garnered responses from 1,363 participants representing the full range of regions, industries, company sizes, functional specialties, and tenures. Of those respondents, 981 said their organizations had adopted AI in at least one business function, and ...
A Wall St. sign is seen near the New York Stock Exchange (NYSE) in New York City, U.S., May 4, 2021. ... Research firm ValueExchange said on average market participants expected the fail rate to ...
By Te-Ping Chen. May 27, 2024 9:00 pm ET. Text. 744 Responses. More Americans are profoundly lonely, and the way they work—more digitally linked but less personally connected—is deepening that ...
The reliance of virtually all artificial intelligence applications on Nvidia's chips has helped the stock nearly triple in value over the past year to $2.72 trillion.
Researchers are working on bandages that allow remote monitoring and deliver treatment with zaps of light or electricity.
Private Lives Beneath Wall Street Glitz Are Revealed in a New Book. A novelist does real-world research for his debut, Ways and Means. Author Daniel Lefferts in Hudson, New York. When Daniel ...
Donate your sex cells. Iryna Inshyna/Shutterstock. Payout for eggs (per donation): usually $10,000 to $12,000; Payout for sperm (per donation): typically $35-$150. Advertisement. Egg and sperm ...