Resources you can trust

Distance time graphs

Introduce or revise distance time graphs with this comprehensive resource pack which includes a printable A3 review sheet and PowerPoint presentation to guide students through step by step with summary notes, examples and practice questions.
What’s included?
This resource pack has everything you need to introduce or revise distance time graphs in maths. Download the free printable A3 review sheet for detailed notes and practice questions (with answers included).
Subscribe to access an editable version plus a step-by-step PowerPoint which walks students through:
- An introduction to distance time graphs
- How to read distance time graphs — steps, examples and practice questions
- How to draw distance time graphs — steps, examples and practice questions
- Common misconceptions
How to use these distance time graph resources
These resources are ideal for introducing or revising distance time graphs with your students.
- The PowerPoint presentation provides a guide through the topic, beginning with an introduction to distance time graphs, followed by detailed instructions on how to read and draw these graphs, supplemented with examples and practice questions.
- The printable A3 review sheet serves as a comprehensive reference, complete with notes, practice questions and answers. It can be used in class for group activities or as a revision tool for students to take home.
Looking for more like this?
For more resources that help students learn about speed, distance and time graphs, you might like to try:
- Speed, distance and time – using distance-time graphs
- The story of a distance time graph
- Distance time stories
- Speed, distance and time – real-time axis
- Speed, distance and time – simple speed calculations
An extract from 'How to read distance time graphs':
1. Look at the x-axis to understand the time scale that is being used. This could be seconds, minutes, hours, or even days. 2. Look at the y-axis to understand the distance scale that is being used. This could be in metres, kilometres, miles, etc. 3. Examine the line on the graph.
The gradient (steepness) of the line indicates speed . A steeper gradient means a faster speed.
Straight lines mean the object is moving at a constant speed.
Horizontal lines mean the object is stationary (not moving).
When the line slopes downwards , the object is returning to its starting point .
A curve means the object is accelerating or decelerating .
All reviews
Resources you might like.

- My presentations
Auth with social network:
Download presentation
We think you have liked this presentation. If you wish to download it, please recommend it to your friends in any social system. Share buttons are a little bit lower. Thank you!
Presentation is loading. Please wait.
Distance / time graphs.
Published by Kelley Boone Modified over 6 years ago
Similar presentations
Presentation on theme: "Distance / time graphs."— Presentation transcript:
Do Now!. Todays lesson Interpreting distance-time and speed-time graphs.

Forces N Bronks.

Acceleration Acceleration Velocity-time graph Questions.

Velocity-time graph’s

Forces. Distance, Speed and Time Speed = distance (in metres) time (in seconds) D TS 1)Dave walks 200 metres in 40 seconds. What is his speed? 2)Laura.

GCSE Mathematics Targeting Grade C Unit 3 Algebra 3 Travel Graphs.

Interpreting Graphs of Motion. This car is NOT moving at a constant speed! You can tell because the line is not straight.

Speed and Acceleration

Distance Time Distance – Time Graph. Distance Time Distance – Time Graph A Click the picture below that matches graph A.

Distance Time Graphs Time is always plotted on x axis

PHYSICS Revision Lesson 5 Velocity and Acceleration Distance-Time and Speed-Time Graphs.

Velocity –Time Graphs.

Distance Time Graphs 16 JUL 14. Starter: JAN 14 Time -Distance Graphs Write in and Calculate The graph shows the movement of a car over time.

P2 – Forces and Motion Lesson 3: D-T and V-T Graphs.

Velocity - time graph 1. The velocity – time graph shows the motion of a particle for one minute. Calculate each of the following. (a) The acceleration.

STARTER FIND SOMEONE WHO can answer the questions on your cards get up and move around! Every question must be answered by someone different you are NOT.

Distance, Speed and Time

Velocity-time graphs. Edexcel Statements Velocity-time graph What story does the graph tell?

Motion Graphs Position vs. time. Vocabulary Position Where you are relative to the origin (reference point/observer) Distance The total length of how.

Sketching Motion Graphs Interpreting Motion Graphs Constant Velocity Acceleration Distance/
About project
© 2024 SlidePlayer.com Inc. All rights reserved.
Motion graphs – Distance/time
Jan 04, 2020
140 likes | 334 Views
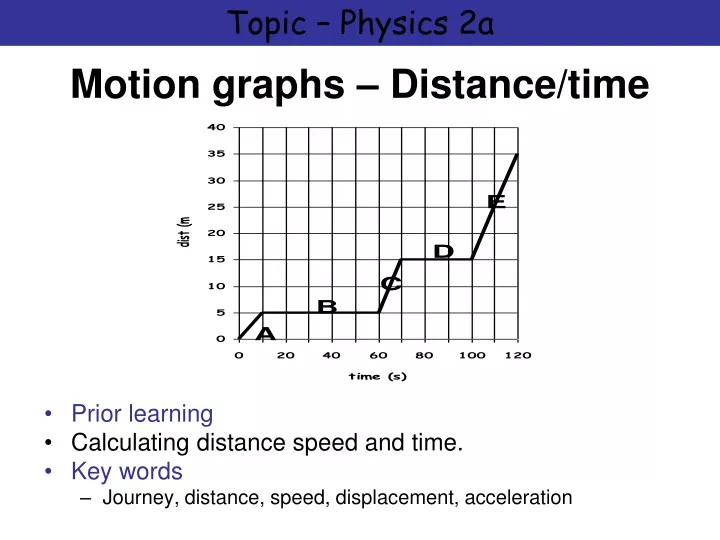
Topic – Physics 2a. Motion graphs – Distance/time. Prior learning Calculating distance speed and time. Key words Journey, distance, speed, displacement, acceleration. Exercise 1. Worksheet – Distance time/displacement time. Exercise 2.
Share Presentation
- distance time
- acceleration time
- acceleration time graphs
- 1 ms 1 east

Presentation Transcript
Topic – Physics 2a Motion graphs – Distance/time • Prior learning • Calculating distance speed and time. • Key words • Journey, distance, speed, displacement, acceleration
Exercise 1 Worksheet – Distance time/displacement time
Exercise 2 Exercise 1: You are at the beach looking for your friend. You walk West for 5 m in 20 s then see her. You both stop and chat for 40 s when, feeling hot, you both run 10 m West into the sea in 10s to stop and enjoy the cool water. 30 s later you hear another friend call you, he has ice creams for all so you both walk 20 m East in 20 s to enjoy your treat. Draw a distance/time graph and a displacement time graph for the above information. NOTE: Be careful, the axis will be different for each graph.
Exercise 2 A From the graph, calculate the total distance travelled for the information above: B From the graph, calculate the displacement for the information above: C From the graph, calculate the speeds for each section on the Distance/time graph. D From the graph, calculate the velocity for each section on the Displacement/time graph
Answers to exercise 2 A Dist = 35 m B s = -5 m west or 5 m east C A = 5 20 = 0.25 ms-1 B = 0 ms-1 C = 10 10 = 1 ms-1 D = 0 ms-1 E = 20 20 = 1 ms-1 D A = 5 20 = 0.25 ms-1 B = 0 ms-1 C = 10 10 = 1 ms-1 D = 0 ms-1 E = -20 20 = -1 ms-1 or 1 ms-1 East
Extension • Distance/time or position/time • Read and make notes content and contexts page 68 • How do you work out gradient??
Acceleration / time • In 2APHY we only deal with uniform acceleration so all acceleration/time graphs will look like the graph to the right which shows acceleration due to gravity in a frictionless situation. • Terminology: • upwards is positive, downwards is negative. • an unchanging velocity value is called a constant velocity; • an unchanging acceleration value is called a uniform acceleration.
Exercise: Briefly describe the motion (qualitatively) for each of the following graphs each of which is the motion of a car
tasks • Read page 71/72 • Draw fig 2.20 and explain in own words how this is calculated • Read over example 2.3b pg 70 to help • Read physics file and make notes • Copy summary 2.3 page 73 into notes
- More by User
Distance vs. Time
Distance vs. Time. Analysis of a Distance vs. Time Graph. Determining the motion on a D vs. T Graph. Where did the object start? Which direction did it go? Where did the object stop? Is the motion uniform (constant)? Is the motion non-uniform (changing)?
315 views • 14 slides
Motion, Acceleration, Energy of Motion
Chapter 2. Motion, Acceleration, Energy of Motion. Chapter 2.1. Motion. 2.1 Motion. Objectives Compare frames of reference. Distinguish between speed and velocity. Calculate when a moving object will arrive at a given point. Make a graph to solve a distance-time problem. 2.1 Motion.
615 views • 40 slides

Motion and Forces Unit Test Review Game
What is the Question?. Motion and Forces Unit Test Review Game. Laws of Motion. Forces. Simple Machines. Speed and Distance-Time Graphs. 100. 100. 100. 100. 200. 200. 200. 200. 300. 300. 300. 300. 400. 400. 400. 400. 500. 500. 500. 500. Row 1, Col 1.
386 views • 24 slides

Speed & Stuff
Speed & Stuff. http://www.scopeformoney.com/website-speed-one-of-ranking-factors-on-google-now. Todays Lesson. Working Out Speed Small Activity Distance Time Graphs Reading Speed Time Graphs Plotting Speed Time Graphs
289 views • 14 slides
Motion Review
Motion Review. Displacement, Vectors, Frame of Reference, Distance-Time Graphs, Speed, Velocity, Acceleration. The SI unit for speed is a.mph. c.m /s. b.ft /s 2 . d. D v / t. On a velocity-time graph, a line with a negative slope indicates that the object is a.speeding up.
861 views • 54 slides
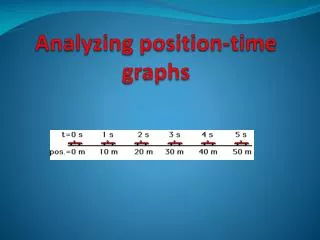
Analyzing position-time graphs
Analyzing position-time graphs. Objectives. You will be able to: Relate the slope of a position-time graph to speed Determine speed using position-time graphs Describe the type of motion indicated in a position-time graph; motion with constant speed or accelerated motion. Recall that:.
417 views • 13 slides
Linear Motion
Linear Motion. Fast. S peed depends on distance and time Average speed uses total distance and total time Use this when an object travels at different speeds. Scalars vs . Vectors. Scalars : measure the amount (magnitude) ex: distance traveled temperature speed limits
778 views • 63 slides

Do Now!. Today’s lesson. Interpreting distance-time and speed-time graphs. A reminder. A reminder. Average speed = distance travelled time taken. d. t. S. x. Distance against time graphs. distance. time. Quietly and sensibly!. Let’s go on the corridor!.
619 views • 51 slides
Distance Time Graphs
Distance Time Graphs. Understanding and interpreting. Distance Time Graphs. Describing a journey made by an object is very boring if you just use words. As with much of science, graphs are more revealing.
258 views • 12 slides


Motion Graphs
Motion Graphs. Interpret The Graph Below:. The graph shows an object which is not moving (at rest). The distance stays the same as time goes by because it is not moving. Interpret The Graph Below:. Interpret The Graph Below:.
617 views • 29 slides
Forces and Motion
Forces and Motion. Notes to Review. Important Vocabulary. Check back often, as words will be added. Force Motion Distance Displacement Potential Energy Kinetic Energy Time Speed Units. X-axis Y-axis Speed = distance/time. Distance vs. Displacement. Distance vs. Displacement.
341 views • 23 slides

Describing Motion. Speed. Acceleration. Distance-Time Graphs. Velocity-Time Graphs. 100. 100. 100. 100. 100. 200. 200. 200. 200. 200. 300. 300. 300. 300. 300. 400. 400. 400. 400. 400. 500. 500. 500. 500. 500. Motion is a change in —. Time. Speed. Velocity.
691 views • 53 slides
Motion in one dimension
Motion in one dimension. motion is “relative”, or depends on your frame of reference rate is a quantity divided by time. Speed: how fast something is moving. “/” means per, “” means change in Speed = distance / time average speed = total distance covered / time interval.
298 views • 12 slides
IGCSE P.1 Motion Prepared by- Uttam Maheshwari
IGCSE P.1 Motion Prepared by- Uttam Maheshwari. Speed Velocity Graphs of Motion Acceleration. MOTION. Motion :- change in position of a body with time. . . x. 6 meters. Speed. Distance travelled in unit time
812 views • 11 slides

TAKS Objective 5
TAKS Objective 5. Motion , Forces and Energy. Motion can be described as. a change in an object’s position Average velocity (speed) is the change of position of an object over time. Velocity Graphs V = distance time.
488 views • 39 slides

Motion. Motion. Motion Occurs when an object changes position relative to a reference point Don’t have to see it move to motion took place. Motion. Distance Describes motion How far did the object move? SI unit is the meter (m) Distance vs Displacement. Displacement
1.13k views • 55 slides

Distance Time Graphs. Understanding and interpreting. Distance Time Graphs. Describing a journey made by an object is not exciting if you just use words. As with much of science, graphs are more revealing.
1.42k views • 12 slides
Motion Graphs Lecture 3
Motion Graphs Lecture 3. Video14. Bill Nye: Motion. Motion & Graphs. Motion graphs are an important tool used to show the relationships between position, speed, and time. It’s an easy way to see how speed or position changes over time These types of graphs are called kinematic graphs.
606 views • 30 slides
Motion Along a Straight Line at Constant Acceleration (2)
Motion Along a Straight Line at Constant Acceleration (2). Connecting our SUVAT equations to velocity/time graphs, an alternative view of derivation. Learning Objectives :. To revise distance/time and speed/time graphs if necessary.
373 views • 12 slides

Describing Motion
Describing Motion. Motion. Sit very still. Do not move. In what ways are you moving? Changing position?. Motion. All motion is relative. Must be a frame of reference. MOTION is a change in position of an object with respect to time. Motion. How far an object moves is DISTANCE
549 views • 18 slides

Motion Graphs Review
Motion Graphs Review. Interpret The Graph Below:. Interpret The Graph Below:. The graph shows an object which is not moving (at rest). The distance stays the same as time goes by because it is not moving. Interpret The Graph Below:. Interpret The Graph Below:.
470 views • 31 slides

Motion. Unit 1: Motion Chapter 1: Describing the Physical Universe. 1.1 The Science of Physics 1.2 Distance, Time, and Measurement 1.3 Speed. Key Question: How do we measure and describe time?. 1.1 Investigation: Measuring Time. Objectives: Use electronic timing equipment and photogates.
831 views • 47 slides
- International
- Schools directory
- Resources Jobs Schools directory News Search

Introducing Speed(velocity) - Time graphs
Subject: Physics
Age range: 14-16
Resource type: Lesson (complete)
Last updated
18 August 2022
- Share through email
- Share through twitter
- Share through linkedin
- Share through facebook
- Share through pinterest

Powerpoint and activity sheet to help pupils progress past distance-time graphs and understand the features of speed-time graphs.
Creative Commons "Sharealike"
Your rating is required to reflect your happiness.
It's good to leave some feedback.
Something went wrong, please try again later.
very helpful
Mister_Dawg
Thank you. Pleased you found the resource useful.
Empty reply does not make any sense for the end user
Great resources but the link for the matrix is not working for me. I was wondering if you could tell me where you found the video as I would love to do the activity. I have tried You tube but having no luck finding the one that links to the worksheet.
Hi. Thank you very much for your comments. The video is actually embedded into the powerpoint. However, if you cannot get it to play inside the powerpoint, the same clip can be found here: http://www.dailymotion.com/video/x7thge_car-chase-matrix_news#.Ua5IKZzUCX4
pierstaylor
Just what was needed, cheers
You're very welcome.
invertedrepeat
There are so many terrible resources on tes. This is definitely NOT one of them. Thank you for putting this up for everyone to use.
You are so very welcome and thank you for your comment.
camacdonald
Well done! What an amazing resource. Love the use of the video clip. Looking forward to teaching this now. Thank you for sharing for free.
You're very welcome and hope the lesson goes well.<br />
Report this resource to let us know if it violates our terms and conditions. Our customer service team will review your report and will be in touch.
Not quite what you were looking for? Search by keyword to find the right resource:
- Preferences

Distance vs. Time Graphs - PowerPoint PPT Presentation

Distance vs. Time Graphs
Distance vs. time graphs describe the type of motion each graph represents. distance on the y and time on the x-axis. note: the slope of these graphs gives you the ... – powerpoint ppt presentation.
- Describe the type of motion each graph represents. Distance on the Y and time on the X-axis.
- Note The slope of these graphs gives you the velocity.
- Constant speed negative direction.
- Standing Still
- Decreasing velocity
- Increasing Velocity
- Describe the type of motion each graph represents. Velocity on the Y-axis and Time on the X-axis.
- Describe the type of motion each graph represents. Velocity on the Y-axis and Time on the X-axis
- Tell me a story for the following graphs.
- Distance vs. Time and then Velocity vs. Time.
- Take the previous Distance vs. Time and draw a Velocity vs. Time graph which would show the same movements.
- Take the previous Distance vs. Time a draw a Velocity vs. Time graph which would show the same movements.
PowerShow.com is a leading presentation sharing website. It has millions of presentations already uploaded and available with 1,000s more being uploaded by its users every day. Whatever your area of interest, here you’ll be able to find and view presentations you’ll love and possibly download. And, best of all, it is completely free and easy to use.
You might even have a presentation you’d like to share with others. If so, just upload it to PowerShow.com. We’ll convert it to an HTML5 slideshow that includes all the media types you’ve already added: audio, video, music, pictures, animations and transition effects. Then you can share it with your target audience as well as PowerShow.com’s millions of monthly visitors. And, again, it’s all free.
About the Developers
PowerShow.com is brought to you by CrystalGraphics , the award-winning developer and market-leading publisher of rich-media enhancement products for presentations. Our product offerings include millions of PowerPoint templates, diagrams, animated 3D characters and more.


IMAGES
VIDEO
COMMENTS
ValPatton. This document provides information about distance-time graphs and how to interpret them. It explains that a straight line on a distance-time graph indicates constant speed, with a steeper line representing faster speed. A horizontal line represents a stationary object. A curved line shows an object that is accelerating or decelerating.
We are learning to: Interpret and draw distance-time graphs in context. Differentiated objectives: Developing learners will be able to interpret information from distance-time graphs. Secure learners will be able to identify the scale used on distance-time graphs. Excelling learners will be able to plot information onto a distance-time graph.
How to use these distance time graph resources. These resources are ideal for introducing or revising distance time graphs with your students. The PowerPoint presentation provides a guide through the topic, beginning with an introduction to distance time graphs, followed by detailed instructions on how to read and draw these graphs ...
First task: Define speed. Speed is a measure of how far an object travels in a certain time. Give the equation for calculating speed. Speed = Distance / time Give the equation that links kinetic energy, mass and velocity.
Time the graph goes, the distance. The more - goes, the more that is passng. Title: PowerPoint Presentation Author: Kayla Created Date:
Resource type: Lesson (complete) File previews. pptx, 1.77 MB. PowerPoint lesson ready to teach your students about Distance-time graphs. Specifically tailored for Edexcel GCSE (9-1) to cover lesson SP1b Distance-time graphs from the SP1 Forces unit, but editable and compatible with other exam boards. Hassle free delivery at the click of a button.
Download presentation. Presentation on theme: "Distance / time graphs."—. Presentation transcript: 1 Distance / time graphs. 2 Lesson aims To show speed as a graph. To identify graphs showing constant and changing speed. To calculate speed, distance and time at points on a graph. 3 No movement? distance Ask a student to sketch on whiteboard ...
Lesson Plan. Students will be able to. relate data in tables to data on graphs, draw straight trend lines that pass through all points and the origin, know that uniform speed is represented on distance-time graphs by a straight line, know that a steeper line on a distance-time graph represents a greater speed.
Key learning points. In this lesson, we will interpret distance-time graphs. We will answer questions regarding how far or how long a journey has been at different points, segments, and overall. This content is made available by Oak National Academy Limited and its partners and licensed under Oak's terms & conditions (Collection 1), except ...
Distance time graphs - Download as a PDF or view online for free. ... Phy 7 velocity and acceleration ppt. ... Grade 8 Forces Presentation.
Presentation Transcript. Lesson aims • To show speed as a graph. • To identify graphs showing constant and changing speed. • To calculate speed, distance and time at points on a graph. 40 30 Distance (metres) Distance (m) 20 10 Time/s 0 80 20 40 60 100 0 Time (s) • How far had the object gone after 20 seconds?
Distance/Time graphs. starter on powerpoint, main - pupils watch animation while drawing the travel graphs, pupils cut out and match the travel graph cards, Plenary powerpoint. The Tortoise and the Hare Slow and Steady Wins The Race (Disney Animation 1934) Watch on. 2._distance_time_graphs.ppt.
Presentation Transcript. Distance Time Graphs • Describing a journey made by an object is not exciting if you just use words. As with much of science, graphs are more revealing. • Plotting distance against time can tell you a lot about a journey. Let's look at the axes: • Time always runs horizontally (the x-axis).
pptx, 2.33 MB. A comprehensive powerpoint that covers the topic of Real-Life Graphs: Distance-Time Graphs. The Powerpoint models solutions to key questions in the topic, followed by questions for the students to do. The questions all have full working out and answers so students can identify where they have made mistakes.
distance_time_graphs.ppt - Free download as Powerpoint Presentation (.ppt), PDF File (.pdf), Text File (.txt) or view presentation slides online. Scribd is the world's largest social reading and publishing site.
Divide by total time (ending time) Comparing speeds on a Distance - Time Graph 1. Find the average speed of each line. 2. Compare the steepness of each line. The steeper line indicates: Faster Speeds. Create a graph using the following data: Your graph should look like this.
Resource type: Other. File previews. pptx, 1.33 MB. KS3 PowerPoint. A few slides with distance time graphs on them, with some questions, read through them first, good for mini white coard sort of starter. See more. to let us know if it violates our terms and conditions. Our customer service team will review your report and will be in touch.
Title: DISTANCE-TIME GRAPHS. Description: DISTANCE-TIME GRAPHS A straight line shows an object moving at a constant speed! The steeper the line, the faster the object is moving! Work out the speed for each ... - PowerPoint PPT presentation. Number of Views: 79. Avg rating:3.0/5.0.
Presentation Transcript. Distance Time Graphs • Describing a journey made by an object is not exciting if you just use words. As with much of science, graphs are more revealing. • Plotting distance against time can tell you a lot about a journey. Let's look at the axes: • Time always runs horizontally (the x-axis).
Presentation Transcript. Topic - Physics 2a Motion graphs - Distance/time • Prior learning • Calculating distance speed and time. • Key words • Journey, distance, speed, displacement, acceleration. Exercise 2 Exercise 1: You are at the beach looking for your friend. You walk West for 5 m in 20 s then see her.
Subject: Physics. Age range: 14-16. Resource type: Lesson (complete) File previews. ppt, 1.23 MB. docx, 106.94 KB. Powerpoint and activity sheet to help pupils progress past distance-time graphs and understand the features of speed-time graphs. Creative Commons "Sharealike". Report this resource to let us know if it violates our terms and ...
Distance vs. Time Graphs. Description: Distance vs. Time Graphs Describe the type of motion each graph represents. Distance on the Y and time on the X-axis. Note: The slope of these graphs gives you the ... - PowerPoint PPT presentation. Number of Views: 341. Avg rating:3.0/5.0.