
Design Research Methods
A Repository of Research Methods for Design
This page represents a growing list of application toolkits and other great resources for conducting design research, organized into General , Specific , and Thematic Tools.


General Tools
General tools provide guidance on an over all approach to user research, or an organized framework of many methods to inform your choice.
Austin Center for Design AC4D Design Library By AC4D. “Practical resources to support the process of design.”
Beginner’s Guide To Design Research By UX Booth. “In this Complete Beginner’s Guide, we’ll look at the many elements of design research, from interviews and observations, to usability testing and A/B testing. Readers will get a head start on how to use these design research techniques in their work, and improve experiences for all users.”
theDesignExchange A joint project led by UC Berkeley and M.I.T. working with the international community of design academics and practitioners. “TheDesignExchange provides a central repository of early design stage methods, engaging all stakeholders in the design community of practice, and integrating online learning with real case studies to demonstrate the methods.”
Design Kit IDEO.org. “Think of these Methods as a step-by-step guide to unleashing your creativity, putting the people you serve at the center of your design process to come up with new answers to difficult problems.”
Design Research Techniques “A simple visual guide to a range of techniques which you may want to further research, when they may be used and a little bit about them. They also have some great case studies with specific techniques for Discovery available here.”
Designing With People By the i-design project. “20 research methods that help designers engage with people during the design process. Some methods are widely used; others represent emerging practice. To help you find the right methods for your project, each method is explored and assessed here from a number of different angles.”
d.school Mixtapes Three “mixtapes” of methods to jumpstart your work: Understand – Experiment – Ideate.
Gamestorming “A toolkit of co-creation tools for innovators, rule-breakers and changemakers.”
IBM Design Research Resources Toolkit “New methods and models created by IBMers, for IBMers.”
IDEO Method Cards “ IDEO Method Cards are a tool to showcase methods we use to inspire great design and keep people at the center of our design process. Each of the 51 cards describes one method and includes a brief story about how and when to use it.” (Also available as a smartphone app)
LifeHack “Top 10 Design Research Resources”
MakeTools Method Cards By Liz Sanders, 29 Method Cards for Generative Design
Research Toolbox Chart | Booklet By Daedalus + Thoughtform. “Twenty-three research methods to discover what your users really want.” Presented in a convenient chart with short definitions of methods, or a compelling illustrated booklet.
Usability.gov “Usability.gov is the leading resource for user experience (UX) best practices and guidelines, serving practitioners and students in the government and private sectors.”
Usability Body of Knowledge – Methods “This section of the Usability BoK presents descriptions of methods, including procedures, resources needed, outcomes, appropriate uses, benefits, and costs. These descriptions form the core of a knowledge base that defines our field. They also help communicate usability methods to clients, project managers, and team members. Usability practitioners will also benefit from cross-referencing of related methods and pointers to outside resources for more details.”
UX Research & Strategy By DesignLab.”Want to make products people love? Start with a deep understanding of your customers. Learn the who, what, why, when and where of customer research to help you create amazing user experiences.”
UX Research Cheat Sheet Nielsen Norman Group. “User research can be done at any point in the design cycle. This list of methods and activities can help you decide which to use when.”
Specific Methods Tools
Specific tools correspond to methods for particular applications, for example, diary studies, cultural probes, card sorting or user testing.
Dscout For mobile diary studies. “dscout’s remote research platform uses a mobile app and +100K eager participants to efficiently capture in-the-moment video and make insights easy to synthesize and share.”
EthOS Ethnographic Observation System “Today we are the go-to platform for anyone wishing to carry out remote qualitative, quantitative and ethnographic research projects anywhere in the world.”
Lego Serious Play Although marketed toward business performance, Lego can be successfully used as a participatory co-design make-tool for inspired creativity.
Optimal Workshop A user research platform with a suite of online usability tools, including “Optimal Sort” card-sorting software.
Probetools Interaction Research Studio. “Our goal is to build on contemporary making and hacking trends to update Probes and make them widely accessible to researchers of any background.”
PremoTool By SusaGroup. “A unique, scientifically validated tool to instantly get insight in consumer emotions! People can report their emotions with the use of expressive cartoon animations instead of relying on the use of words.”
UsabilityHub A set of five online usability tools, geared toward fast testing. “Remote user testing to help you make confident design decisions”
MakeTools: Papers on Participatory Design & Generative Research
By Liz Sanders et al.
Thematic Tools
Thematic tools are designed for research in broad topic areas, such as emotion, behavior change, healthcare, or service design.
Design and Emotion “Since 2005, the Design & Emotion Society has been collecting tools and methods that support the application of design for emotion.”
Design with Intent By Dan Lockton, PhD. “Aims to give practitioners a more nuanced approach to design and behaviour, working with people, people’s understanding, and the complexities of everyday human experience. It’s a collection of design patterns—and a design and research approach—for exploring the interactions between design and people’s behaviour, across products, services and environments, both digital and physical.”
MethodKit for Public Health “A healthy population is the backbone of a sustainable society. We have created a tool that can help you organize, plan and shape the future landscape of patient care, health and wellbeing. This kit is aimed at both professionals and enthusiasts who want to understand more and create new systems for the future of public health.”
Service Design Tools “An open collection of communication tools used in design processes that deal with complex systems.”
Have a language expert improve your writing
Run a free plagiarism check in 10 minutes, automatically generate references for free.
- Knowledge Base
- Methodology
Research Design | Step-by-Step Guide with Examples
Published on 5 May 2022 by Shona McCombes . Revised on 20 March 2023.
A research design is a strategy for answering your research question using empirical data. Creating a research design means making decisions about:
- Your overall aims and approach
- The type of research design you’ll use
- Your sampling methods or criteria for selecting subjects
- Your data collection methods
- The procedures you’ll follow to collect data
- Your data analysis methods
A well-planned research design helps ensure that your methods match your research aims and that you use the right kind of analysis for your data.
Table of contents
Step 1: consider your aims and approach, step 2: choose a type of research design, step 3: identify your population and sampling method, step 4: choose your data collection methods, step 5: plan your data collection procedures, step 6: decide on your data analysis strategies, frequently asked questions.
- Introduction
Before you can start designing your research, you should already have a clear idea of the research question you want to investigate.
There are many different ways you could go about answering this question. Your research design choices should be driven by your aims and priorities – start by thinking carefully about what you want to achieve.
The first choice you need to make is whether you’ll take a qualitative or quantitative approach.
Qualitative research designs tend to be more flexible and inductive , allowing you to adjust your approach based on what you find throughout the research process.
Quantitative research designs tend to be more fixed and deductive , with variables and hypotheses clearly defined in advance of data collection.
It’s also possible to use a mixed methods design that integrates aspects of both approaches. By combining qualitative and quantitative insights, you can gain a more complete picture of the problem you’re studying and strengthen the credibility of your conclusions.
Practical and ethical considerations when designing research
As well as scientific considerations, you need to think practically when designing your research. If your research involves people or animals, you also need to consider research ethics .
- How much time do you have to collect data and write up the research?
- Will you be able to gain access to the data you need (e.g., by travelling to a specific location or contacting specific people)?
- Do you have the necessary research skills (e.g., statistical analysis or interview techniques)?
- Will you need ethical approval ?
At each stage of the research design process, make sure that your choices are practically feasible.
Prevent plagiarism, run a free check.
Within both qualitative and quantitative approaches, there are several types of research design to choose from. Each type provides a framework for the overall shape of your research.
Types of quantitative research designs
Quantitative designs can be split into four main types. Experimental and quasi-experimental designs allow you to test cause-and-effect relationships, while descriptive and correlational designs allow you to measure variables and describe relationships between them.
With descriptive and correlational designs, you can get a clear picture of characteristics, trends, and relationships as they exist in the real world. However, you can’t draw conclusions about cause and effect (because correlation doesn’t imply causation ).
Experiments are the strongest way to test cause-and-effect relationships without the risk of other variables influencing the results. However, their controlled conditions may not always reflect how things work in the real world. They’re often also more difficult and expensive to implement.
Types of qualitative research designs
Qualitative designs are less strictly defined. This approach is about gaining a rich, detailed understanding of a specific context or phenomenon, and you can often be more creative and flexible in designing your research.
The table below shows some common types of qualitative design. They often have similar approaches in terms of data collection, but focus on different aspects when analysing the data.
Your research design should clearly define who or what your research will focus on, and how you’ll go about choosing your participants or subjects.
In research, a population is the entire group that you want to draw conclusions about, while a sample is the smaller group of individuals you’ll actually collect data from.
Defining the population
A population can be made up of anything you want to study – plants, animals, organisations, texts, countries, etc. In the social sciences, it most often refers to a group of people.
For example, will you focus on people from a specific demographic, region, or background? Are you interested in people with a certain job or medical condition, or users of a particular product?
The more precisely you define your population, the easier it will be to gather a representative sample.
Sampling methods
Even with a narrowly defined population, it’s rarely possible to collect data from every individual. Instead, you’ll collect data from a sample.
To select a sample, there are two main approaches: probability sampling and non-probability sampling . The sampling method you use affects how confidently you can generalise your results to the population as a whole.
Probability sampling is the most statistically valid option, but it’s often difficult to achieve unless you’re dealing with a very small and accessible population.
For practical reasons, many studies use non-probability sampling, but it’s important to be aware of the limitations and carefully consider potential biases. You should always make an effort to gather a sample that’s as representative as possible of the population.
Case selection in qualitative research
In some types of qualitative designs, sampling may not be relevant.
For example, in an ethnography or a case study, your aim is to deeply understand a specific context, not to generalise to a population. Instead of sampling, you may simply aim to collect as much data as possible about the context you are studying.
In these types of design, you still have to carefully consider your choice of case or community. You should have a clear rationale for why this particular case is suitable for answering your research question.
For example, you might choose a case study that reveals an unusual or neglected aspect of your research problem, or you might choose several very similar or very different cases in order to compare them.
Data collection methods are ways of directly measuring variables and gathering information. They allow you to gain first-hand knowledge and original insights into your research problem.
You can choose just one data collection method, or use several methods in the same study.
Survey methods
Surveys allow you to collect data about opinions, behaviours, experiences, and characteristics by asking people directly. There are two main survey methods to choose from: questionnaires and interviews.
Observation methods
Observations allow you to collect data unobtrusively, observing characteristics, behaviours, or social interactions without relying on self-reporting.
Observations may be conducted in real time, taking notes as you observe, or you might make audiovisual recordings for later analysis. They can be qualitative or quantitative.
Other methods of data collection
There are many other ways you might collect data depending on your field and topic.
If you’re not sure which methods will work best for your research design, try reading some papers in your field to see what data collection methods they used.
Secondary data
If you don’t have the time or resources to collect data from the population you’re interested in, you can also choose to use secondary data that other researchers already collected – for example, datasets from government surveys or previous studies on your topic.
With this raw data, you can do your own analysis to answer new research questions that weren’t addressed by the original study.
Using secondary data can expand the scope of your research, as you may be able to access much larger and more varied samples than you could collect yourself.
However, it also means you don’t have any control over which variables to measure or how to measure them, so the conclusions you can draw may be limited.
As well as deciding on your methods, you need to plan exactly how you’ll use these methods to collect data that’s consistent, accurate, and unbiased.
Planning systematic procedures is especially important in quantitative research, where you need to precisely define your variables and ensure your measurements are reliable and valid.
Operationalisation
Some variables, like height or age, are easily measured. But often you’ll be dealing with more abstract concepts, like satisfaction, anxiety, or competence. Operationalisation means turning these fuzzy ideas into measurable indicators.
If you’re using observations , which events or actions will you count?
If you’re using surveys , which questions will you ask and what range of responses will be offered?
You may also choose to use or adapt existing materials designed to measure the concept you’re interested in – for example, questionnaires or inventories whose reliability and validity has already been established.
Reliability and validity
Reliability means your results can be consistently reproduced , while validity means that you’re actually measuring the concept you’re interested in.
For valid and reliable results, your measurement materials should be thoroughly researched and carefully designed. Plan your procedures to make sure you carry out the same steps in the same way for each participant.
If you’re developing a new questionnaire or other instrument to measure a specific concept, running a pilot study allows you to check its validity and reliability in advance.
Sampling procedures
As well as choosing an appropriate sampling method, you need a concrete plan for how you’ll actually contact and recruit your selected sample.
That means making decisions about things like:
- How many participants do you need for an adequate sample size?
- What inclusion and exclusion criteria will you use to identify eligible participants?
- How will you contact your sample – by mail, online, by phone, or in person?
If you’re using a probability sampling method, it’s important that everyone who is randomly selected actually participates in the study. How will you ensure a high response rate?
If you’re using a non-probability method, how will you avoid bias and ensure a representative sample?
Data management
It’s also important to create a data management plan for organising and storing your data.
Will you need to transcribe interviews or perform data entry for observations? You should anonymise and safeguard any sensitive data, and make sure it’s backed up regularly.
Keeping your data well organised will save time when it comes to analysing them. It can also help other researchers validate and add to your findings.
On their own, raw data can’t answer your research question. The last step of designing your research is planning how you’ll analyse the data.
Quantitative data analysis
In quantitative research, you’ll most likely use some form of statistical analysis . With statistics, you can summarise your sample data, make estimates, and test hypotheses.
Using descriptive statistics , you can summarise your sample data in terms of:
- The distribution of the data (e.g., the frequency of each score on a test)
- The central tendency of the data (e.g., the mean to describe the average score)
- The variability of the data (e.g., the standard deviation to describe how spread out the scores are)
The specific calculations you can do depend on the level of measurement of your variables.
Using inferential statistics , you can:
- Make estimates about the population based on your sample data.
- Test hypotheses about a relationship between variables.
Regression and correlation tests look for associations between two or more variables, while comparison tests (such as t tests and ANOVAs ) look for differences in the outcomes of different groups.
Your choice of statistical test depends on various aspects of your research design, including the types of variables you’re dealing with and the distribution of your data.
Qualitative data analysis
In qualitative research, your data will usually be very dense with information and ideas. Instead of summing it up in numbers, you’ll need to comb through the data in detail, interpret its meanings, identify patterns, and extract the parts that are most relevant to your research question.
Two of the most common approaches to doing this are thematic analysis and discourse analysis .
There are many other ways of analysing qualitative data depending on the aims of your research. To get a sense of potential approaches, try reading some qualitative research papers in your field.
A sample is a subset of individuals from a larger population. Sampling means selecting the group that you will actually collect data from in your research.
For example, if you are researching the opinions of students in your university, you could survey a sample of 100 students.
Statistical sampling allows you to test a hypothesis about the characteristics of a population. There are various sampling methods you can use to ensure that your sample is representative of the population as a whole.
Operationalisation means turning abstract conceptual ideas into measurable observations.
For example, the concept of social anxiety isn’t directly observable, but it can be operationally defined in terms of self-rating scores, behavioural avoidance of crowded places, or physical anxiety symptoms in social situations.
Before collecting data , it’s important to consider how you will operationalise the variables that you want to measure.
The research methods you use depend on the type of data you need to answer your research question .
- If you want to measure something or test a hypothesis , use quantitative methods . If you want to explore ideas, thoughts, and meanings, use qualitative methods .
- If you want to analyse a large amount of readily available data, use secondary data. If you want data specific to your purposes with control over how they are generated, collect primary data.
- If you want to establish cause-and-effect relationships between variables , use experimental methods. If you want to understand the characteristics of a research subject, use descriptive methods.
Cite this Scribbr article
If you want to cite this source, you can copy and paste the citation or click the ‘Cite this Scribbr article’ button to automatically add the citation to our free Reference Generator.
McCombes, S. (2023, March 20). Research Design | Step-by-Step Guide with Examples. Scribbr. Retrieved 3 June 2024, from https://www.scribbr.co.uk/research-methods/research-design/
Is this article helpful?

Shona McCombes
- Reviews / Why join our community?
- For companies
- Frequently asked questions
Design Research
What is design research.
Design research is the practice of gaining insights by observing users and understanding industry and market shifts. For example, in service design it involves designers’ using ethnography—an area of anthropology—to access study participants, to gain the best insights and so be able to start to design popular services.
“We think we listen, but very rarely do we listen with real understanding, true empathy. Yet listening, of this very special kind, is one of the most potent forces for change that I know.” — Carl Rogers, Psychologist and founding father of the humanistic approach & psychotherapy research
Service design expert and Senior Director of User Research at Twitch Kendra Shimmell explains what goes into good design research in this video.
- Transcript loading…
Get Powerful Insights with Proper Design Research
When you do user research well, you can fuel your design process with rich insights into how your target users interact—or might interact—in contexts to do the things they must do to achieve their goals using whatever they need on the way. That’s why it’s essential to choose the right research methods and execute them properly. Then, you’ll be able to reach those participants who agree to be test users/customers, so they’ll be comfortable enough to give you accurate, truthful insights about their needs, desires, pain points and much more. As service design can involve highly intricate user journeys , things can be far more complex than in “regular” user experience (UX) design . That’s where design research comes in, with its two main ingredients:
Qualitative research – to understand core human behaviors, habits and tasks/goals
Industry and Market research – to understand shifts in technology and in business models and design-relevant signs
An ideal situation—where you have enough resources and input from experts—is to combine the above to obtain the clearest view of the target customers of your proposed—or improved—service and get the most accurate barometer reading of what your market wants and why. In any case, ethnography is essential. It’s your key to decoding this very human economy of habits, motivations, pain points, values and other hard-to-spot factors that influence what people think, feel, say and do on their user journeys. It’s your pathway to creating personas —fictitious distillations that prove you empathize with your target users as customers—and to gain the best insights means you carefully consider how to access these people on their level. When you do ethnographic field studies, you strive for accurate observations of your users/customers in the context of using a service .

© Interaction Design Foundation, CC BY-SA 4.0
How to Leverage Ethnography to Do Proper Design Research
Whatever your method or combination of methods (e.g., semi-structured interviews and video ethnography), the “golden rules” are:
Build rapport – Your “test users” will only open up in trusting, relaxed, informal, natural settings. Simple courtesies such as thanking them and not pressuring them to answer will go a long way. Remember, human users want a human touch, and as customers they will have the final say on a design’s success.
Hide/Forget your own bias – This is a skill that will show in how you ask questions, which can subtly tell users what you might want to hear. Instead of asking (e.g.) “The last time you used a pay app on your phone, what was your worst security concern?”, try “Can you tell me about the last time you used an app on your phone to pay for something?”. Questions that betray how you might view things can make people distort their answers.
Embrace the not-knowing mindset and a blank-slate approach – to help you find users’ deep motivations and why they’ve created workarounds. Trying to forget—temporarily—everything you’ve learned about one or more things can be challenging. However, it can pay big dividends if you can ignore the assumptions that naturally creep into our understanding of our world.
Accept ambiguity – Try to avoid imposing a rigid binary (black-and-white/“yes”-or-“no”) scientific framework over your users’ human world.
Don’t jump to conclusions – Try to stay objective. The patterns we tend to establish to help us make sense of our world more easily can work against you as an observer if you let them. It’s perfectly human to rely on these patterns so we can think on our feet. But your users/customers already will be doing this with what they encounter. If you add your own subjectivity, you’ll distort things.
Keep an open mind to absorb the users’ world as present it – hence why it’s vital to get some proper grounding in user research. It takes a skilled eye, ear and mouth to zero in on everything there is to observe, without losing sight of anything by catering to your own agendas, etc.
Gentle encouragement helps; Silence is golden – a big part of keeping a naturalistic setting means letting your users stay comfortable at their own pace (within reason). Your “Mm-mmhs” of encouragement and appropriate silent stretches can keep your research safe from users’ suddenly putting politeness ahead of honesty if they feel (or feel that you’re) uncomfortable.
Overall, remember that two people can see the same thing very differently, and it takes an open-minded, inquisitive, informal approach to find truly valuable insights to understand users’ real problems.
Learn More about Design Research
Take our Service Design course, featuring many helpful templates: Service Design: How to Design Integrated Service Experiences
This Smashing Magazine piece nicely explores the human dimensions of design research: How To Get To Know Your Users
Let Invision expand your understanding of design research’s value, here: 4 types of research methods all designers should know .
Literature on Design Research
Here’s the entire UX literature on Design Research by the Interaction Design Foundation, collated in one place:
Learn more about Design Research
Take a deep dive into Design Research with our course Service Design: How to Design Integrated Service Experiences .
Services are everywhere! When you get a new passport, order a pizza or make a reservation on AirBnB, you're engaging with services. How those services are designed is crucial to whether they provide a pleasant experience or an exasperating one. The experience of a service is essential to its success or failure no matter if your goal is to gain and retain customers for your app or to design an efficient waiting system for a doctor’s office.
In a service design process, you use an in-depth understanding of the business and its customers to ensure that all the touchpoints of your service are perfect and, just as importantly, that your organization can deliver a great service experience every time . It’s not just about designing the customer interactions; you also need to design the entire ecosystem surrounding those interactions.
In this course, you’ll learn how to go through a robust service design process and which methods to use at each step along the way. You’ll also learn how to create a service design culture in your organization and set up a service design team . We’ll provide you with lots of case studies to learn from as well as interviews with top designers in the field. For each practical method, you’ll get downloadable templates that guide you on how to use the methods in your own work.
This course contains a series of practical exercises that build on one another to create a complete service design project . The exercises are optional, but you’ll get invaluable hands-on experience with the methods you encounter in this course if you complete them, because they will teach you to take your first steps as a service designer. What’s equally important is that you can use your work as a case study for your portfolio to showcase your abilities to future employers! A portfolio is essential if you want to step into or move ahead in a career in service design.
Your primary instructor in the course is Frank Spillers . Frank is CXO of award-winning design agency Experience Dynamics and a service design expert who has consulted with companies all over the world. Much of the written learning material also comes from John Zimmerman and Jodi Forlizzi , both Professors in Human-Computer Interaction at Carnegie Mellon University and highly influential in establishing design research as we know it today.
You’ll earn a verifiable and industry-trusted Course Certificate once you complete the course. You can highlight it on your resume, CV, LinkedIn profile or on your website.
All open-source articles on Design Research
Adding quality to your design research with an ssqs checklist.

- 8 years ago
Open Access—Link to us!
We believe in Open Access and the democratization of knowledge . Unfortunately, world-class educational materials such as this page are normally hidden behind paywalls or in expensive textbooks.
If you want this to change , cite this page , link to us, or join us to help us democratize design knowledge !
Privacy Settings
Our digital services use necessary tracking technologies, including third-party cookies, for security, functionality, and to uphold user rights. Optional cookies offer enhanced features, and analytics.
Experience the full potential of our site that remembers your preferences and supports secure sign-in.
Governs the storage of data necessary for maintaining website security, user authentication, and fraud prevention mechanisms.
Enhanced Functionality
Saves your settings and preferences, like your location, for a more personalized experience.
Referral Program
We use cookies to enable our referral program, giving you and your friends discounts.
Error Reporting
We share user ID with Bugsnag and NewRelic to help us track errors and fix issues.
Optimize your experience by allowing us to monitor site usage. You’ll enjoy a smoother, more personalized journey without compromising your privacy.
Analytics Storage
Collects anonymous data on how you navigate and interact, helping us make informed improvements.
Differentiates real visitors from automated bots, ensuring accurate usage data and improving your website experience.
Lets us tailor your digital ads to match your interests, making them more relevant and useful to you.
Advertising Storage
Stores information for better-targeted advertising, enhancing your online ad experience.
Personalization Storage
Permits storing data to personalize content and ads across Google services based on user behavior, enhancing overall user experience.
Advertising Personalization
Allows for content and ad personalization across Google services based on user behavior. This consent enhances user experiences.
Enables personalizing ads based on user data and interactions, allowing for more relevant advertising experiences across Google services.
Receive more relevant advertisements by sharing your interests and behavior with our trusted advertising partners.
Enables better ad targeting and measurement on Meta platforms, making ads you see more relevant.
Allows for improved ad effectiveness and measurement through Meta’s Conversions API, ensuring privacy-compliant data sharing.
LinkedIn Insights
Tracks conversions, retargeting, and web analytics for LinkedIn ad campaigns, enhancing ad relevance and performance.
LinkedIn CAPI
Enhances LinkedIn advertising through server-side event tracking, offering more accurate measurement and personalization.
Google Ads Tag
Tracks ad performance and user engagement, helping deliver ads that are most useful to you.
Share Knowledge, Get Respect!
or copy link
Cite according to academic standards
Simply copy and paste the text below into your bibliographic reference list, onto your blog, or anywhere else. You can also just hyperlink to this page.
New to UX Design? We’re Giving You a Free ebook!

Download our free ebook The Basics of User Experience Design to learn about core concepts of UX design.
In 9 chapters, we’ll cover: conducting user interviews, design thinking, interaction design, mobile UX design, usability, UX research, and many more!
Learn / Guides / UX research guide
Back to guides
11 UX tools for organizing, researching, and synthesizing data
You’ve got a great product. You're seeing conversions, generating solid revenue, and hitting your forecasted sales quota. But you’re also seeing a steadily increasing bounce rate, high cart abandonment rate, and user complaints about a bug-infested product experience (PX).
What to do?
Last updated
Reading time.

To continue to provide customer delight, your business must identify user experience (UX) issues and fix them for the user. But conducting UX research can be a complex, time-consuming process—you need to plan your research, and collect, organize, and synthesize data to inform UX priorities.
Using UX tools helps you automate repetitive tasks, streamline processes, unearth rich data, and make research insights accessible across different teams. If you’re confused about which tools to pick for your unique research needs, this article is here to help. We list the best UX research tools and show you how they can help you provide a stellar experience for your customers at different stages in the research process.
You don’t have to collect, analyze, and distribute UX research data manually
Hotjar’s tools provide qualitative and quantitative insights to improve UX.
The benefits of different UX research tools
“Throw everything at the wall and see what sticks” is bad advice for UX research. You want to find out exactly what’s blocking your customers from finding what they need to purchase your products—and fix it.
Instead of relying on manual UX research, you can automate different aspects of the process using specialized tools that help you streamline workflows.
UX research tools help you:
Extract rich data and insights : UX research tools give you access to high-quality data you can analyze and convert into actionable insights. They offer granular data that would be difficult to unearth manually.
Cut down on time manually searching for insights : many research tools come with integrations and workflow management features that help you automate time-consuming and repetitive tasks, so you can focus more on implementing UX improvements than on managing research data.
Organize and centralize research : UX research is not a one-person task. It requires organizational synergy and cross-functional collaboration. UX research tools act as the go-to resource for all team members, allowing them to easily access data, validate their ideas, and manage task coordination. This makes the process more efficient, eliminating bottlenecks and delays so you can deliver excellent experiences faster.
UX research tools can help you create customer delight, but it’s important to know which tools to use at different stages of the research process.
Let’s look at the different types of UX research tools and how they can help you with different aspects of UX design in your journey to enhance the customer experience (CX).
Tools to plan, organize, and manage the UX research process
The first step in the UX research process is planning and organizing: the way you start your research defines the kind of insights it’ll help you uncover.
You want tools in this phase to help you manage the entire process in a single space , build a repository to manage your data, create journey maps, and specify the who, what, why, and when of your UX research to centralize your findings and make them accessible to stakeholders and team members. This process helps designers and product teams separate the wheat from the chaff, decide what needs to be prioritized, and manage the entire process in a goal-driven way.
Here are our top planning, organizing, and project management tool picks:

What it is
Notion is an all-in-one workspace from where teams can manage their tasks, create their product roadmap, store their research data, and more.
How it helps
Notion is the platform at the center of your UX research process, thanks to products that complement each other:
Projects : manage the entire process (even beyond the UX research phase) regardless of the size of your team, view it as a timeline, table, or calendar, filter and sort tasks, and create and visualize dependencies
Wikis : centralize your research into a single source of truth, document your learnings, easily find and edit the data from user interviews and other UX research methods
Docs : go beyond text and bullets points and communicate more efficiently with flexible building blocks and 50+ content types, collaborate with your team
Beyond this, Notion integrates with more tools (some of them on this list 😉) to automate your workflows, and the tool’s integrated AI assistant further helps you be more efficient throughout the entire process.
Notion is free for individuals. Paid plans start at $8/mo (billed annually).
2. Airtable

Airtable is a cloud-based platform that combines spreadsheets and databases. It’s a low-code tool with a neat interface that offers templates for multiple use cases like project management, timesheets, and planners.
Airtable is a user-friendly solution for storing raw data and organizing it systematically in line with your goals. The tool's automation capabilities synthesize your user research data and insights into meaningful dashboards.
What’s more, Airtable helps you arrange your data points and easily map out the next steps. You can leverage the platform’s multiple view options to visualize your data from different perspectives.
Free for up to five creators. Paid plans start at $10 per seat/month (billed annually).

Miro is a visual platform that lets your team connect, collaborate in real-time, and create together. Essentially a whiteboard, this collaborative tool has versatile capabilities for diagramming, mind mapping, and creating flowcharts and presentations.
Packed with unique features for documenting data and ideas, Miro helps users brainstorm and creatively compose ideas. It doubles as a database, allowing you to present your research and highlight meaningful patterns. You can also use affinity diagramming to categorize both qualitative and quantitative data thematically.
Free for up to three editable boards and unlimited team members. Paid plans start at $8 per member/month (billed annually).

Condens is a research repository ideal for storing and analyzing your data seamlessly. The tool helps structure the raw information you’ve collected from multiple sources by creating intuitive patterns.
How it helps
With its focus on boosting real-time collaboration, Condens strengthens your UX data analysis using AI-assisted tagging and powerful segmentation to elevate your research process. The tool also offers automatic transcription, participant panel management, and highlight reels to add more depth to your research.
15-day free trial. Paid plans start at €30/month (billed annually).
Tools to collect user data and feedback
Throughout the UX research process, you’ll come across two types of data: qualitative and quantitative . While qualitative data is language-based and more subjective, quantitative data gives you a measurable numerical value for a key performance indicator (KPI).
In the context of UX research, quantitative insights help you understand user behaviors through numbers, which is the first step in knowing what you can do to achieve your desired result. Qualitative data, on the other hand, helps you understand why users behave the way they do.
Let’s look at the best user research tools for collecting and analyzing quantitative and qualitative data to improve the user experience.
5. Hotjar Observe and Ask

Hotjar (hello there 👋) is a multi-product, digital experience insights platform that collects and analyzes both qualitative and quantitative data which you can use to enhance the user experience. Its many tools and features generate in-depth insights about user behavior and customer feedback to give you a data-informed picture of your product or website analytics , so you discover the what and the why , all in the same place.
Hotjar provides your team with actionable, holistic insights to better understand your users and their behavior. Built with privacy in mind from day one, the industry leader makes the UX research process more efficient, saving you time and money by gathering all the insights you need in an easy-to-use central platform. Here’s how Hotjar Observe and Ask help you collect user data and feedback:
Hotjar Observe : spot patterns in user behavior to improve your site with confidence, zoom in and out from high-level behavior patterns to recordings of real user experiences, and put yourself in the customer's shoes to make changes that matter.
Heatmaps : see a visual representation of where users click, move, and scroll on your site
Recordings : watch replays of real user sessions to understand exactly how people interact with your site, and filter recordings by Frustration and Engagement Score, events, path, and much more
Pro tip: with engagement zones in Heatmaps , understanding the layout, content, and usability of a page has never been easier. Visualize engagement patterns from where users click, move, and scroll with a grid overlay highlighting the most (and least) engaged zones on the page.

Once you know what is happening on the page, watch session replays of frustrated users to spot UX issues. Filter Recordings by Frustration Score to understand why users are rage clicking or u-turning.
Hotjar Ask : collect voice-of-the-customer (VoC) feedback and discover how users feel as they experience your site or product.
Surveys : capture in-the-moment user feedback with on-site and external surveys, learn more about what users and customers love (or hate) about your site or product—and why—and get started with 40+ survey templates
Feedback : understand what users really think about your site, let them highlight specific parts of the page they have feedback on, and spot which pages do not match their expectations
Pro tip: received negative feedback? Watch the user’s session replay to understand what went wrong and spot UX improvement opportunities.
Use Hotjar's Microsoft Teams or Slack integration to be alerted as soon as a user has answered one of your surveys, and align your entire team around user feedback.
In addition to all this, Hotjar is packed with more useful features—like Highlights to share key user insights, Trends to spot overarching behavior patterns, Integrations to automate your work, and Funnels to spot where users drop off in your most important flows.
Get started for free. Or choose one of the paid plans to unlock more features. The best part? You pay only for the products you need!

Loop11 is a remote UX research tool that facilitates moderated and unmoderated interviews to help you learn about your users' experience with your product. Through dedicated features for collecting, organizing, and visualizing your insights, it offers a comprehensive and collaborative research platform.
Loop11 contributes to your qualitative research with user and usability testing tools that let you test prototypes and live websites (on mobile, desktop, or tablet). It’s a great UX research software for:
Usability testing: analyze your site’s usability with users performing actual tasks
Benchmarking: compare your site or product’s usability against your competitors
Prototype testing: test wireframes and prototypes to validate new products or features before actually developing them
A/B testing: test multiple designs against each other to determine which one offers the best UX and converts better
Information architecture testing: design and refine your information architecture by observing how users navigate your site
Loop11 allows you to bring your own research participants into their usability testing platform. If you don’t have any, the tool makes participant recruitment easy by tapping into their own pool of testers.
14-day free trial, then plans start at $179/mo (billed annually).
Pro tip: test your prototypes and wireframes with a concept testing survey to gather feedback from real users.
7. Hotjar Engage

Hotjar Engage (hey again 👋) is a user interview tool that lets you recruit the right users for your UX research and tests and allows you to spend less time on admin tasks, and more time turning insights into action. It empowers design, product, marketing, and UX teams to research user behavior, identify improvement opportunities, and validate assumptions.
Hotjar Engage enables remote usability testing and remote user research by letting you:
Recruit participants from a pool of 175,000+ verified research participants, or add your own usability testers
Automate scheduling and hosting of moderated interviews
Download transcripts of your video calls, so you can focus on gathering insights from your users during the interview
Share and download highlights and time-stamped notes with your team and create video clips of key insights
Bring in additional observers and moderators
What’s more, Engage syncs with the other products on the Hotjar platform. After each interview, watch recordings and heatmaps to get deeper insights into what participants did—and why.
Get started for free and pay as you go, or unlock more features with a paid plan, starting from €72/mo (billed annually).

Maze ’s toolkit makes it a comprehensive UX research platform helping teams develop better products. It lets you build a cross-company research process and validate product designs, messaging, usability, and more.
Maze provides a comprehensive UX research solution with features that include prototype testing, tree testing, card sorting, in-product prompts, and more. The platform lets you:
Test : experiment with and validate prototypes, wireframes, concepts, copy, and more
Integrate : work seamlessly with the best design tools to validate ideas and speed up the design process
Report : get actionable user insights with automated metrics and reports
Reach : send targeted research campaigns to your tailored participant database
Free for one active project and 300 responses per year. Paid plans start at $75/mo (billed annually).
Tools to create new designs or features to solve user problems
Now that you've gathered your UX research data, it’s time to make improvements to your site or product. Of course, before the development phase, you need to prototype and wireframe changes.
Design tools are essential to the UX research process, as they let you bring your ideas to life and turn the precious user feedback that you collected beforehand into new products and features.
Here are our top 3 UI design tools that build new products and features:

Figma is a collaborative UI design tool that helps teams stay aligned throughout the research and development processes. It enables teams to ship new products faster.
Figma’s powerful all-in-one design platform allows UX teams to prototype while they design, and vice versa, with powerful features:
Interactive prototypes : go beyond UI design and turn static files into an interactive experience to give testers a taste of the real thing.
Share and collect feedback : toggle between your design file and live prototype, then share the latter and enable comments so user feedback stays in the same place
Fasten development : take the guesswork out of the equation for your developers by including animations and transitions
Figma also integrates with other UX research tools on this list like Notion and Maze, simplifying your workflows.
Free for 3 Figma files. Paid plans start at €12 per editor/month.
10. Adobe XD

Adobe XD is premium collaborative UI design software, downloadable for Windows or macOS. You can subscribe to Adobe XD as a standalone app or as part of Adobe’s Creative Cloud suite, which also includes Adobe Photoshop, Illustrator, and After Effects.
Adobe XD’s collaborative vector-based experience design platform provides tools to craft prototypes that look and feel like the real thing:
Components and States : create design elements once and reuse them multiple times, or create variations to simulate interactions
3D transform : simulate 3D effects when creating immersive and interactive experiences, and rotate objects to view mockups in perspective
Share designs and prototypes : collaborate with stakeholders and designers in a centralized platform
Start for free. Paid plans start at $9.99/month (billed annually).
Pro tip: use Anima to add Hotjar to Figma and Adobe XD to your prototypes.

Sketch is a complete design platform for Mac users, boasting thoughtful features and an intuitive UI.
Sketch provides design tools to help you create early wireframes, prototypes, and flexible design systems:
Flexibility : sketch your whole design from canvas to code
Consistency : turn your elements and components into templates and reuse them everywhere
Collaboration : design with your team in real-time, test your prototypes, and improve your workflows with hundreds of plugins and integrations
30-day free trial. Plans start at $9 per editor/month.
Use UX research tools to prioritize brilliantly
UX research is extremely important in improving the user experience, allowing you to go beyond guesswork and instinct, and base your decisions on data-informed insights. UX research tools facilitate this process by simplifying and automating tasks and offering a birds-eye view of all your research discoveries so you can prioritize the UX elements that matter most to your users.
By identifying the right tools to use at each stage of the UX research process, you can save time, streamline your workflow, and create a better user experience.
Frequently asked questions
What are the best ux research methods.
It’s best for product and design teams to use a wide range of research methods as groundwork for improving user experience. The best UX research methods include:
Usability testing
Field studies
Moderated/unmoderated interviews
Product session recordings
Your choice of a UX research method should be closely aligned with your goals and will depend on the challenges you’re addressing.
What do UX tools help with?
UX tools play a crucial role throughout the product development lifecycle. These tools assist with initial product planning and organizing when you are orchestrating your research campaign, helping you collect useful quantitative and qualitative insights and run user testing.
These tools also help with making realistic, dynamic prototypes, equipped with complete functionality for testing and iterating.
What is UX research analysis?
UX research analysis is the process of analyzing and structuring your UX research data so it generates actionable user-centric insights and informs your decisions. This process includes carefully categorizing and organizing data to identify patterns and highlight important findings. UX research analysis helps with prioritization and guides the product team in taking the next steps.
UX research questions
Previous chapter
UX research examples
Next chapter
Integrations
What's new?
Prototype Testing
Live Website Testing
Feedback Surveys
Interview Studies
Card Sorting
Tree Testing
In-Product Prompts
Participant Management
Automated Reports
Templates Gallery
Choose from our library of pre-built mazes to copy, customize, and share with your own users
Browse all templates
Financial Services
Tech & Software
Product Designers
Product Managers
User Researchers
By use case
Concept & Idea Validation
Wireframe & Usability Test
Content & Copy Testing
Feedback & Satisfaction
Content Hub
Educational resources for product, research and design teams
Explore all resources
Question Bank
Research Maturity Model
Guides & Reports
Help Center
Future of User Research Report
The Optimal Path Podcast
Maze Guides | Resources Hub
What is UX Research: The Ultimate Guide for UX Researchers
0% complete
Meet the 19 top-rated UX research tools & software for 2024
Building your UX research tool stack is an essential step in establishing an effective research practice. Read on for a round up of essential tools that will help you conduct UX research and move the needle in your organization.

What tools do UX researchers use?
UX researchers use a wide variety of tools to conduct user experience research . These tools have unique functions—each of which helps conduct different research and uncover insightful data.
Here’s a look at some of the tools that UX researchers use to get the insights they need to improve UX:
- Tools for user and usability testing : These tools help UX researchers evaluate how easy to use their products and features are
- Tools for user interviews: These tools help conduct live interviews to get direct feedback from users
- Tools for recruiting research participants: These tools help find participants for user research interviews
- Tools for testing information architecture: These tools help evaluate the layout of your website and how users expect your navigation to work
- Tools for product analytics: These tools provide data on how users interact with your website
- Tools for user surveys and feedback: These tools enable you to create surveys that collect feedback and insights from users
We’ve hand-picked a number of the best UX research tools for each of these categories to help you improve your UX research processes and workflows. Take a look at this overview before we take a closer look at each.
Tools for usability testing
UX research tools do a lot of heavy lifting when it comes to user research. From recruiting participants and planning the interviews to getting feedback, and sharing your findings, having a great tool stack is important for running a great research practice .
Selecting the right UX research toolkit depends on where you are in the research process, the research method you’ll be using, the size of your organization, and the type of product you’re researching. Ready to get hands-on with research? Here are some tools to consider.

Maze is a continuous product discovery platform that empowers product teams to collect and consume user insights, continuously. With solutions for participant recruitment, product research, and reporting, Maze helps teams build the habit of continuous product discovery in a platform that enables everyone to run great research.
Maze integrates directly with Adobe XD, Figma, InVision, Marvel, and Sketch, and allows you to import an existing prototype from the design tool you use.
You can create and run in-depth usability tests at any stage of your research plan , to get actionable insights in minutes. Its usability testing solution includes task analysis, multiple path analysis, heatmaps, A/B testing, guerrilla testing, and more.
Maze allows you to run surveys and collect user feedback early in the design process, and also enables you to test your information architecture with features such as Card Sorts and Tree Tests.
Maze's reporting functionality automatically records and documents completion rates, misclick rates, time spent, click heatmaps, and more. Maze also generates a usability test report instantly for each test, that you can share with anyone with a link.
Key features: Integrations with leading design platforms, remote testing, surveys, IA testing, real-time reports, question repository , collaboration features, pre-built templates Pricing: Free for one project and five seats per month, then from $99 per month
Collect UX research insights at scale
Optimize your user experience with actionable insights from card sorting, tree testing, prototype testing, usability testing, and more.

Loop11 helps you conduct moderated and unmoderated usability testing on live websites, prototypes, and competitors’ websites, among others. With Loop11, you can start testing at the wireframing and prototyping stage to ensure your designs are headed in the right direction.
Beyond usability testing, Loop11 can help user researchers conduct competitive benchmarking , A/B testing, and IA testing.
Key features: Online usability testing, prototype testing, benchmarking, A/B testing, IA testing Pricing: From $63 per month

3. Userlytics
Userlytics is a user testing platform that helps you conduct research at scale by testing digital assets like websites, applications, mobile apps, prototypes, etc. You can collect both qualitative and quantitative data and set up advanced metrics and graphical reports.
With Userlytics, you can run any combination of moderated or unmoderated user experience studies, usability tests, card sorting, and tree testing using a diversity of features.
Key features: Usability testing, user experience studies, prototype testing, live conversations, card sorting, tree testing Pricing: From $49 per month

4. UsabilityHub
UsabilityHub is a remote research platform that offers a range of testing tools, including first click testing, design surveys, preference tests, and five-second tests. These tests enable you to collect data and validate design decisions.
With UsabilityHub’s Panel, researchers can recruit test users from a pool of participants based on criteria such as age, gender, education, and more to get feedback from a relevant target audience.
Key features: Remote user testing, first-click testing, design surveys, preference tests, five-second tests, participant recruitment Pricing: From $79 per month

💡 Want more? Check out our full list of usability testing tools here .
Tools for user interviews
5. lookback.
Lookback is a comprehensive user research tool that offers you the ability to do live user interviews contextualized through a live recording of the user’s screen. Lookback helps you conduct moderated, unmoderated, and remote research and includes a collaborative dashboard that lets you sync all your research and customer feedback and share it with your team.
Lookback sessions are recorded automatically, so you can rewatch them at your convenience and create highlight clips to share with colleagues and stakeholders. Among other things, the team plan allows you to do remote or in-person research, test with prototypes and invite observers to see in real-time.
Key features: Remote user research in real-time, moderated and unmoderated testing, collaborative dashboard, live note-taking Pricing: From $99 per month

6. Userzoom
Userzoom is a UX research platform for remote usability testing and includes features such as participant recruiting, heatmap and analytics recording, etc. You can use it to collect quantitative or qualitative feedback and create A/B tests with mock-ups to get feedback from users before product development.
With Userzoom, you can run unmoderated task-based studies with test participants from all around the world on a website, prototype, wireframe, or mock-up.
Key features: Usability testing, interviews, surveys, intercept testing, click testing, tree testing, card sorting, participant recruiting Pricing: Available upon request

dscout is a remote qualitative research platform that helps you collect in-context insights from the people who use your products. One component of the platform is dscout Live, which lets you run remote user interviews and collect feedback from participants. You can also run diary studies with dscout Diary to see people’s everyday product experience as it happens either on video or in photos. And with dscout Recruit, you can recruit research participants without the hassle and cost associated with traditional recruiting.
dscout is also helpful because it streamlines the most time-consuming parts of interviews with research-centric features such as participant scheduling, automatic transcriptions, on-call observers, and an interactive timeline for taking notes and clips.
Key features: Unmoderated research, remote user interviews, participant recruiting, automatic transcriptions, on-call observers, interactive timeline for taking notes Pricing: Available upon request

Tools for recruiting research participants
8. user interviews.
User Interviews is a well-known platform that helps you make better product decisions with seamless access to quality participants. The platform is known for allowing you to build your own pool of participants or access their panel of over 350,000 vetted research participants who can be filtered by profession.
User Interviews offers features like screener surveys, scheduling interviews, and participation tracking for your existing users. The median turnaround time is 2 hours, though it can vary based on the project.
Key features: Participant recruitment, screener surveys, scheduling interviews, messaging participants, automatic incentives, participation tracking Pricing: From $40 per session or $250 per month

Another user research tool for selecting participants is Ethnio, which enables you to create screeners for intercepting people on your website or app so that you can find the right participants for user research. Ethnio provides various filters for screeners and automated scheduling options that help streamline the process of getting in touch with users.
Within the platform, Ethnio also includes a tool called Research Incentives, a calculator that helps you reward your participants by instantly paying them using different online services.
Key features: Participant recruitment, central participant database, incentives, screeners, intercepts, scheduling options Pricing: From $79 per month

Ribbon is an all-in-one participant recruitment and screening tool that allows you to find users, screen them, and automatically schedule user interviews.
If you’re looking for a simple does-what-it-says recruitment tool, then Ribbon’s a great choice. They’re also currently working on features including interview transcripts and participant incentives.
Key features: Participant recruitment, screeners, automatic interview scheduling, incentive management, moderated interviews Pricing: From $79 per month

Tools for information architecture testing
11. optimal workshop.
Optimal Workshop offers a suite of testing tools to help you conduct information architecture (IA) tests. For card sorting, you can use their OptimalSort tool to understand how people think your content should be organized and categorized.
Another component of Optimal Work is Treejack, which helps you conduct unmoderated tree tests to identify if users are currently getting lost on your site and where they expect to find key information.
Key features: Card sorting, tree testing, first-click testing, IA testing, online surveys, qualitative research, participant recruitment Pricing: From $99 per month

12. kardSort
kardSort is an online card sorting tool which offers moderated, unmoderated, and hybrid card sorting.
As user-friendly as they come, kardSort operates in a simple drag-and-drop function which makes card sorting easy for researchers and participants alike.
Working on all browsers, you can set up and run a card sorting session incredibly quickly, and it’s ideal for asynchronous sessions due to its simplicity and ability to add pre or post-study questions.
Key features: Moderated, unmoderated and hybrid card sorting, pre and post-study interviews, tool tips Pricing: Free

UXarmy provides a variety of user testing solutions to help you run information architecture testing via tree tests and card sorting. You can create tests on the platform, or import existing ones.
The platform makes evaluating your layout easy, and in-depth analytics help you uncover insights from tests—including participant analysis, path analysis, and destination matrixes. It’s quick and easy to get started, and provides an intuitive process for your participants.
Key features: Card sorting, tree testing, moderated and unmoderated usability testing Pricing: All solutions are stand-alone, with card sorting costing $79 per month and tree testing $99 per month

Tools for product analytics
Hotjar is a remote research tool which allows you to view real-time user behavior via heatmaps and screen recordings.
With a huge amount of data available, plus in-app surveys, Hotjar is a great solution if you’re looking to focus on heatmapping as a research method and want to really understand the nuance of user behavior.
Key features: Heatmaps, screen recordings, unmoderated research, in-product feedback widgets and follow-up surveys Pricing: Free for 35 sessions, then from $39 per month

15. Kissmetrics
Kissmetrics is an event analytics platform that helps you track user behavior across your site. By giving you information about how customers interact with your product, Kissmetrics helps you acquire qualified prospects, convert trials to customers, and reduce churn.
It gives you tools to gain insights into how users interact with your product—especially if your primary focus is revenue.
Key features: Custom event tracking, entry and exit pages, on-page engagement, custom reports dashboards, segmentation, session analytics, and funnels Pricing: Billed per event ($0.0025/event) or build your own plan (starting at $25.99 per month for 10k events)

15. Mixpanel
Mixpanel is an events analytics tool that lets you see every moment of the customer experience. It lets you splice and dice data to uncover trends and find the root of the problem.
It’s a great tool for getting insights the whole team can understand and use, with collaborative notes, goals, and boards. With an easy learning curve, it’s a fast tool to pick up and get started with.
Key features: Customizable dashboards, anomaly explanations, filters, event tracking, demographic breakdowns, user journey analysis Pricing: Free plan with limited features and paid plans starting from $20 per month

Tools for user surveys and feedback
17. surveymonkey.
SurveyMonkey is a popular survey tool that helps you collect customer feedback via online questionnaires. It’s easy to use and easily customizable—from the in-survey branding and background to the font and URL.
SurveyMonkey’s AI feature—SurveyMonkey Genius—provides guidance and support to help you create optimized surveys. It’s a quick and easy tool for making surveys that get the insights you need.
Key features: Fully-customizable online surveys, market research solutions, Genius AI solution, online form embedding Pricing: Free plan with basic features, team plans start at $25 per user/month

18. Typeform
Typerform is another online survey builder that helps you build forms which stand out and collect the information you need.
Typeform integrates with your existing workflow to help streamline the customer feedback collection process, and provides a smooth, effortless experience for the users you’re surveying—ideal when UX is crucial and you don’t want a clunky experience to get in the way of authentic insights.
Key features: Simple form builder, branded forms, key integrations, varied question formats Pricing: Typeform starts at $25 per month for one user and 100 responses per month

19. Jotform
Jotform is an online form builder that provides templates for you to use in your customer feedback process. It shares many key features with the other survey tools on our list, but also offers a number of other solutions—like a no-code app builder and online storefront builder.
It’s an intuitive platform that helps you create branded surveys in minutes, making it a great all-in-one platform if you’re limited on budget.
Key features: Intuitive form builder, ample integrations, report generations, workflow automation Pricing: Free plan with survey limits, paid plans from $34 per month

Bonus tools to help with UX research
Alongside the dedicated user research tools, there are also a number of other tools that will help improve your user research process. Here’s the honorable mentions from our list to add to your tool stack.
For documenting research: Dovetail, Notion, Evernote, Miro For transcriptions: Otter.ai, Rev, Reduct For remote user testing: Zoom, Google Meet, Slack
How to select the best UX research tool
As you can see, there are lots of UX research tools to choose from. Your primary considerations when selecting a tool is the type of research you’re looking to conduct, but there are a number of other things to keep in mind:
- Ease of use and interface: Is the tool easy to use? Can you pick it up and get started straight away?
- Scalability: Can the tool grow with your research needs? Does it require technical help for scaling up, or can you scale rapidly?
- Support available: Is anyone on hand to help you when you get stuck? Is there a dedicated help center to support your success?
- Free trial/account: Can you try before you buy? What can you get done with the free version of a tool?
Whatever your needs, there’s a UX research tool out there for you.
If your needs include concept and idea validation, wireframe and usability testing, moderated interview analysis, and more—give Maze a try.
Maze enables you to get user insights fast, helping you to make informed decisions that improve your product.
Accelerate and scale your UX research
Get the insights you need to build better user experiences, with Maze’s suite of user research solutions.

Frequently asked questions about UX research tools
Some common tools that UX researchers use include tools for usability testing, user interviews, surveys, card sorting, tree testing, and first-click testing. A UX research tool stack may also include solutions for recruiting participants, documenting research, and transcribing interviews. Other examples are analytics and heat-mapping tools and remote user testing tools .
What is user experience (UX) design?
User experience design is the process designers use to build products that provide great experiences to their users. UX design refers to feelings and emotions users experience when interacting with a product. It focuses on the user flow and how easy it is for the user to accomplish their desired goals.
What is a UX research tool?
A UX research tool is a piece of software, tool, or app that enables UX researchers to maximise their research effectiveness and gather insights. Popular research tools include survey, recruitment, and interview software.
How to establish a strategic UX research process
- Skip to main content
- Skip to primary sidebar
- Skip to footer
- QuestionPro

- Solutions Industries Gaming Automotive Sports and events Education Government Travel & Hospitality Financial Services Healthcare Cannabis Technology Use Case NPS+ Communities Audience Contactless surveys Mobile LivePolls Member Experience GDPR Positive People Science 360 Feedback Surveys
- Resources Blog eBooks Survey Templates Case Studies Training Help center
Home Market Research Research Tools and Apps
Research Design: What it is, Elements & Types

Can you imagine doing research without a plan? Probably not. When we discuss a strategy to collect, study, and evaluate data, we talk about research design. This design addresses problems and creates a consistent and logical model for data analysis. Let’s learn more about it.
What is Research Design?
Research design is the framework of research methods and techniques chosen by a researcher to conduct a study. The design allows researchers to sharpen the research methods suitable for the subject matter and set up their studies for success.
Creating a research topic explains the type of research (experimental, survey research , correlational , semi-experimental, review) and its sub-type (experimental design, research problem , descriptive case-study).
There are three main types of designs for research:
- Data collection
- Measurement
- Data Analysis
The research problem an organization faces will determine the design, not vice-versa. The design phase of a study determines which tools to use and how they are used.
The Process of Research Design
The research design process is a systematic and structured approach to conducting research. The process is essential to ensure that the study is valid, reliable, and produces meaningful results.
- Consider your aims and approaches: Determine the research questions and objectives, and identify the theoretical framework and methodology for the study.
- Choose a type of Research Design: Select the appropriate research design, such as experimental, correlational, survey, case study, or ethnographic, based on the research questions and objectives.
- Identify your population and sampling method: Determine the target population and sample size, and choose the sampling method, such as random , stratified random sampling , or convenience sampling.
- Choose your data collection methods: Decide on the data collection methods , such as surveys, interviews, observations, or experiments, and select the appropriate instruments or tools for collecting data.
- Plan your data collection procedures: Develop a plan for data collection, including the timeframe, location, and personnel involved, and ensure ethical considerations.
- Decide on your data analysis strategies: Select the appropriate data analysis techniques, such as statistical analysis , content analysis, or discourse analysis, and plan how to interpret the results.
The process of research design is a critical step in conducting research. By following the steps of research design, researchers can ensure that their study is well-planned, ethical, and rigorous.
Research Design Elements
Impactful research usually creates a minimum bias in data and increases trust in the accuracy of collected data. A design that produces the slightest margin of error in experimental research is generally considered the desired outcome. The essential elements are:
- Accurate purpose statement
- Techniques to be implemented for collecting and analyzing research
- The method applied for analyzing collected details
- Type of research methodology
- Probable objections to research
- Settings for the research study
- Measurement of analysis
Characteristics of Research Design
A proper design sets your study up for success. Successful research studies provide insights that are accurate and unbiased. You’ll need to create a survey that meets all of the main characteristics of a design. There are four key characteristics:

- Neutrality: When you set up your study, you may have to make assumptions about the data you expect to collect. The results projected in the research should be free from research bias and neutral. Understand opinions about the final evaluated scores and conclusions from multiple individuals and consider those who agree with the results.
- Reliability: With regularly conducted research, the researcher expects similar results every time. You’ll only be able to reach the desired results if your design is reliable. Your plan should indicate how to form research questions to ensure the standard of results.
- Validity: There are multiple measuring tools available. However, the only correct measuring tools are those which help a researcher in gauging results according to the objective of the research. The questionnaire developed from this design will then be valid.
- Generalization: The outcome of your design should apply to a population and not just a restricted sample . A generalized method implies that your survey can be conducted on any part of a population with similar accuracy.
The above factors affect how respondents answer the research questions, so they should balance all the above characteristics in a good design. If you want, you can also learn about Selection Bias through our blog.
Research Design Types
A researcher must clearly understand the various types to select which model to implement for a study. Like the research itself, the design of your analysis can be broadly classified into quantitative and qualitative.
Qualitative research
Qualitative research determines relationships between collected data and observations based on mathematical calculations. Statistical methods can prove or disprove theories related to a naturally existing phenomenon. Researchers rely on qualitative observation research methods that conclude “why” a particular theory exists and “what” respondents have to say about it.
Quantitative research
Quantitative research is for cases where statistical conclusions to collect actionable insights are essential. Numbers provide a better perspective for making critical business decisions. Quantitative research methods are necessary for the growth of any organization. Insights drawn from complex numerical data and analysis prove to be highly effective when making decisions about the business’s future.
Qualitative Research vs Quantitative Research
Here is a chart that highlights the major differences between qualitative and quantitative research:
In summary or analysis , the step of qualitative research is more exploratory and focuses on understanding the subjective experiences of individuals, while quantitative research is more focused on objective data and statistical analysis.
You can further break down the types of research design into five categories:

1. Descriptive: In a descriptive composition, a researcher is solely interested in describing the situation or case under their research study. It is a theory-based design method created by gathering, analyzing, and presenting collected data. This allows a researcher to provide insights into the why and how of research. Descriptive design helps others better understand the need for the research. If the problem statement is not clear, you can conduct exploratory research.
2. Experimental: Experimental research establishes a relationship between the cause and effect of a situation. It is a causal research design where one observes the impact caused by the independent variable on the dependent variable. For example, one monitors the influence of an independent variable such as a price on a dependent variable such as customer satisfaction or brand loyalty. It is an efficient research method as it contributes to solving a problem.
The independent variables are manipulated to monitor the change it has on the dependent variable. Social sciences often use it to observe human behavior by analyzing two groups. Researchers can have participants change their actions and study how the people around them react to understand social psychology better.
3. Correlational research: Correlational research is a non-experimental research technique. It helps researchers establish a relationship between two closely connected variables. There is no assumption while evaluating a relationship between two other variables, and statistical analysis techniques calculate the relationship between them. This type of research requires two different groups.
A correlation coefficient determines the correlation between two variables whose values range between -1 and +1. If the correlation coefficient is towards +1, it indicates a positive relationship between the variables, and -1 means a negative relationship between the two variables.
4. Diagnostic research: In diagnostic design, the researcher is looking to evaluate the underlying cause of a specific topic or phenomenon. This method helps one learn more about the factors that create troublesome situations.
This design has three parts of the research:
- Inception of the issue
- Diagnosis of the issue
- Solution for the issue
5. Explanatory research : Explanatory design uses a researcher’s ideas and thoughts on a subject to further explore their theories. The study explains unexplored aspects of a subject and details the research questions’ what, how, and why.
Benefits of Research Design
There are several benefits of having a well-designed research plan. Including:
- Clarity of research objectives: Research design provides a clear understanding of the research objectives and the desired outcomes.
- Increased validity and reliability: To ensure the validity and reliability of results, research design help to minimize the risk of bias and helps to control extraneous variables.
- Improved data collection: Research design helps to ensure that the proper data is collected and data is collected systematically and consistently.
- Better data analysis: Research design helps ensure that the collected data can be analyzed effectively, providing meaningful insights and conclusions.
- Improved communication: A well-designed research helps ensure the results are clean and influential within the research team and external stakeholders.
- Efficient use of resources: reducing the risk of waste and maximizing the impact of the research, research design helps to ensure that resources are used efficiently.
A well-designed research plan is essential for successful research, providing clear and meaningful insights and ensuring that resources are practical.
QuestionPro offers a comprehensive solution for researchers looking to conduct research. With its user-friendly interface, robust data collection and analysis tools, and the ability to integrate results from multiple sources, QuestionPro provides a versatile platform for designing and executing research projects.
Our robust suite of research tools provides you with all you need to derive research results. Our online survey platform includes custom point-and-click logic and advanced question types. Uncover the insights that matter the most.
FREE TRIAL LEARN MORE
MORE LIKE THIS

Why Multilingual 360 Feedback Surveys Provide Better Insights
Jun 3, 2024

Raked Weighting: A Key Tool for Accurate Survey Results
May 31, 2024

Top 8 Data Trends to Understand the Future of Data
May 30, 2024

Top 12 Interactive Presentation Software to Engage Your User
May 29, 2024
Other categories
- Academic Research
- Artificial Intelligence
- Assessments
- Brand Awareness
- Case Studies
- Communities
- Consumer Insights
- Customer effort score
- Customer Engagement
- Customer Experience
- Customer Loyalty
- Customer Research
- Customer Satisfaction
- Employee Benefits
- Employee Engagement
- Employee Retention
- Friday Five
- General Data Protection Regulation
- Insights Hub
- Life@QuestionPro
- Market Research
- Mobile diaries
- Mobile Surveys
- New Features
- Online Communities
- Question Types
- Questionnaire
- QuestionPro Products
- Release Notes
- Research Tools and Apps
- Revenue at Risk
- Survey Templates
- Training Tips
- Uncategorized
- Video Learning Series
- What’s Coming Up
- Workforce Intelligence
- Privacy Policy
Home » Research Design – Types, Methods and Examples
Research Design – Types, Methods and Examples
Table of Contents

Research Design
Definition:
Research design refers to the overall strategy or plan for conducting a research study. It outlines the methods and procedures that will be used to collect and analyze data, as well as the goals and objectives of the study. Research design is important because it guides the entire research process and ensures that the study is conducted in a systematic and rigorous manner.
Types of Research Design
Types of Research Design are as follows:
Descriptive Research Design
This type of research design is used to describe a phenomenon or situation. It involves collecting data through surveys, questionnaires, interviews, and observations. The aim of descriptive research is to provide an accurate and detailed portrayal of a particular group, event, or situation. It can be useful in identifying patterns, trends, and relationships in the data.
Correlational Research Design
Correlational research design is used to determine if there is a relationship between two or more variables. This type of research design involves collecting data from participants and analyzing the relationship between the variables using statistical methods. The aim of correlational research is to identify the strength and direction of the relationship between the variables.
Experimental Research Design
Experimental research design is used to investigate cause-and-effect relationships between variables. This type of research design involves manipulating one variable and measuring the effect on another variable. It usually involves randomly assigning participants to groups and manipulating an independent variable to determine its effect on a dependent variable. The aim of experimental research is to establish causality.
Quasi-experimental Research Design
Quasi-experimental research design is similar to experimental research design, but it lacks one or more of the features of a true experiment. For example, there may not be random assignment to groups or a control group. This type of research design is used when it is not feasible or ethical to conduct a true experiment.
Case Study Research Design
Case study research design is used to investigate a single case or a small number of cases in depth. It involves collecting data through various methods, such as interviews, observations, and document analysis. The aim of case study research is to provide an in-depth understanding of a particular case or situation.
Longitudinal Research Design
Longitudinal research design is used to study changes in a particular phenomenon over time. It involves collecting data at multiple time points and analyzing the changes that occur. The aim of longitudinal research is to provide insights into the development, growth, or decline of a particular phenomenon over time.
Structure of Research Design
The format of a research design typically includes the following sections:
- Introduction : This section provides an overview of the research problem, the research questions, and the importance of the study. It also includes a brief literature review that summarizes previous research on the topic and identifies gaps in the existing knowledge.
- Research Questions or Hypotheses: This section identifies the specific research questions or hypotheses that the study will address. These questions should be clear, specific, and testable.
- Research Methods : This section describes the methods that will be used to collect and analyze data. It includes details about the study design, the sampling strategy, the data collection instruments, and the data analysis techniques.
- Data Collection: This section describes how the data will be collected, including the sample size, data collection procedures, and any ethical considerations.
- Data Analysis: This section describes how the data will be analyzed, including the statistical techniques that will be used to test the research questions or hypotheses.
- Results : This section presents the findings of the study, including descriptive statistics and statistical tests.
- Discussion and Conclusion : This section summarizes the key findings of the study, interprets the results, and discusses the implications of the findings. It also includes recommendations for future research.
- References : This section lists the sources cited in the research design.
Example of Research Design
An Example of Research Design could be:
Research question: Does the use of social media affect the academic performance of high school students?
Research design:
- Research approach : The research approach will be quantitative as it involves collecting numerical data to test the hypothesis.
- Research design : The research design will be a quasi-experimental design, with a pretest-posttest control group design.
- Sample : The sample will be 200 high school students from two schools, with 100 students in the experimental group and 100 students in the control group.
- Data collection : The data will be collected through surveys administered to the students at the beginning and end of the academic year. The surveys will include questions about their social media usage and academic performance.
- Data analysis : The data collected will be analyzed using statistical software. The mean scores of the experimental and control groups will be compared to determine whether there is a significant difference in academic performance between the two groups.
- Limitations : The limitations of the study will be acknowledged, including the fact that social media usage can vary greatly among individuals, and the study only focuses on two schools, which may not be representative of the entire population.
- Ethical considerations: Ethical considerations will be taken into account, such as obtaining informed consent from the participants and ensuring their anonymity and confidentiality.
How to Write Research Design
Writing a research design involves planning and outlining the methodology and approach that will be used to answer a research question or hypothesis. Here are some steps to help you write a research design:
- Define the research question or hypothesis : Before beginning your research design, you should clearly define your research question or hypothesis. This will guide your research design and help you select appropriate methods.
- Select a research design: There are many different research designs to choose from, including experimental, survey, case study, and qualitative designs. Choose a design that best fits your research question and objectives.
- Develop a sampling plan : If your research involves collecting data from a sample, you will need to develop a sampling plan. This should outline how you will select participants and how many participants you will include.
- Define variables: Clearly define the variables you will be measuring or manipulating in your study. This will help ensure that your results are meaningful and relevant to your research question.
- Choose data collection methods : Decide on the data collection methods you will use to gather information. This may include surveys, interviews, observations, experiments, or secondary data sources.
- Create a data analysis plan: Develop a plan for analyzing your data, including the statistical or qualitative techniques you will use.
- Consider ethical concerns : Finally, be sure to consider any ethical concerns related to your research, such as participant confidentiality or potential harm.
When to Write Research Design
Research design should be written before conducting any research study. It is an important planning phase that outlines the research methodology, data collection methods, and data analysis techniques that will be used to investigate a research question or problem. The research design helps to ensure that the research is conducted in a systematic and logical manner, and that the data collected is relevant and reliable.
Ideally, the research design should be developed as early as possible in the research process, before any data is collected. This allows the researcher to carefully consider the research question, identify the most appropriate research methodology, and plan the data collection and analysis procedures in advance. By doing so, the research can be conducted in a more efficient and effective manner, and the results are more likely to be valid and reliable.
Purpose of Research Design
The purpose of research design is to plan and structure a research study in a way that enables the researcher to achieve the desired research goals with accuracy, validity, and reliability. Research design is the blueprint or the framework for conducting a study that outlines the methods, procedures, techniques, and tools for data collection and analysis.
Some of the key purposes of research design include:
- Providing a clear and concise plan of action for the research study.
- Ensuring that the research is conducted ethically and with rigor.
- Maximizing the accuracy and reliability of the research findings.
- Minimizing the possibility of errors, biases, or confounding variables.
- Ensuring that the research is feasible, practical, and cost-effective.
- Determining the appropriate research methodology to answer the research question(s).
- Identifying the sample size, sampling method, and data collection techniques.
- Determining the data analysis method and statistical tests to be used.
- Facilitating the replication of the study by other researchers.
- Enhancing the validity and generalizability of the research findings.
Applications of Research Design
There are numerous applications of research design in various fields, some of which are:
- Social sciences: In fields such as psychology, sociology, and anthropology, research design is used to investigate human behavior and social phenomena. Researchers use various research designs, such as experimental, quasi-experimental, and correlational designs, to study different aspects of social behavior.
- Education : Research design is essential in the field of education to investigate the effectiveness of different teaching methods and learning strategies. Researchers use various designs such as experimental, quasi-experimental, and case study designs to understand how students learn and how to improve teaching practices.
- Health sciences : In the health sciences, research design is used to investigate the causes, prevention, and treatment of diseases. Researchers use various designs, such as randomized controlled trials, cohort studies, and case-control studies, to study different aspects of health and healthcare.
- Business : Research design is used in the field of business to investigate consumer behavior, marketing strategies, and the impact of different business practices. Researchers use various designs, such as survey research, experimental research, and case studies, to study different aspects of the business world.
- Engineering : In the field of engineering, research design is used to investigate the development and implementation of new technologies. Researchers use various designs, such as experimental research and case studies, to study the effectiveness of new technologies and to identify areas for improvement.
Advantages of Research Design
Here are some advantages of research design:
- Systematic and organized approach : A well-designed research plan ensures that the research is conducted in a systematic and organized manner, which makes it easier to manage and analyze the data.
- Clear objectives: The research design helps to clarify the objectives of the study, which makes it easier to identify the variables that need to be measured, and the methods that need to be used to collect and analyze data.
- Minimizes bias: A well-designed research plan minimizes the chances of bias, by ensuring that the data is collected and analyzed objectively, and that the results are not influenced by the researcher’s personal biases or preferences.
- Efficient use of resources: A well-designed research plan helps to ensure that the resources (time, money, and personnel) are used efficiently and effectively, by focusing on the most important variables and methods.
- Replicability: A well-designed research plan makes it easier for other researchers to replicate the study, which enhances the credibility and reliability of the findings.
- Validity: A well-designed research plan helps to ensure that the findings are valid, by ensuring that the methods used to collect and analyze data are appropriate for the research question.
- Generalizability : A well-designed research plan helps to ensure that the findings can be generalized to other populations, settings, or situations, which increases the external validity of the study.
Research Design Vs Research Methodology
About the author.

Muhammad Hassan
Researcher, Academic Writer, Web developer
You may also like

Research Gap – Types, Examples and How to...

How to Cite Research Paper – All Formats and...

What is a Hypothesis – Types, Examples and...

Research Questions – Types, Examples and Writing...

Research Paper Introduction – Writing Guide and...

Background of The Study – Examples and Writing...
Leave a comment x.
Save my name, email, and website in this browser for the next time I comment.
The online design tool where ideas get done
Embrace design thinking and collaborate on design sprints, customer journey maps, wireframes, and more. Generate ideas, uncover insights, and transform the way your team builds products with Miro’s online design tool.
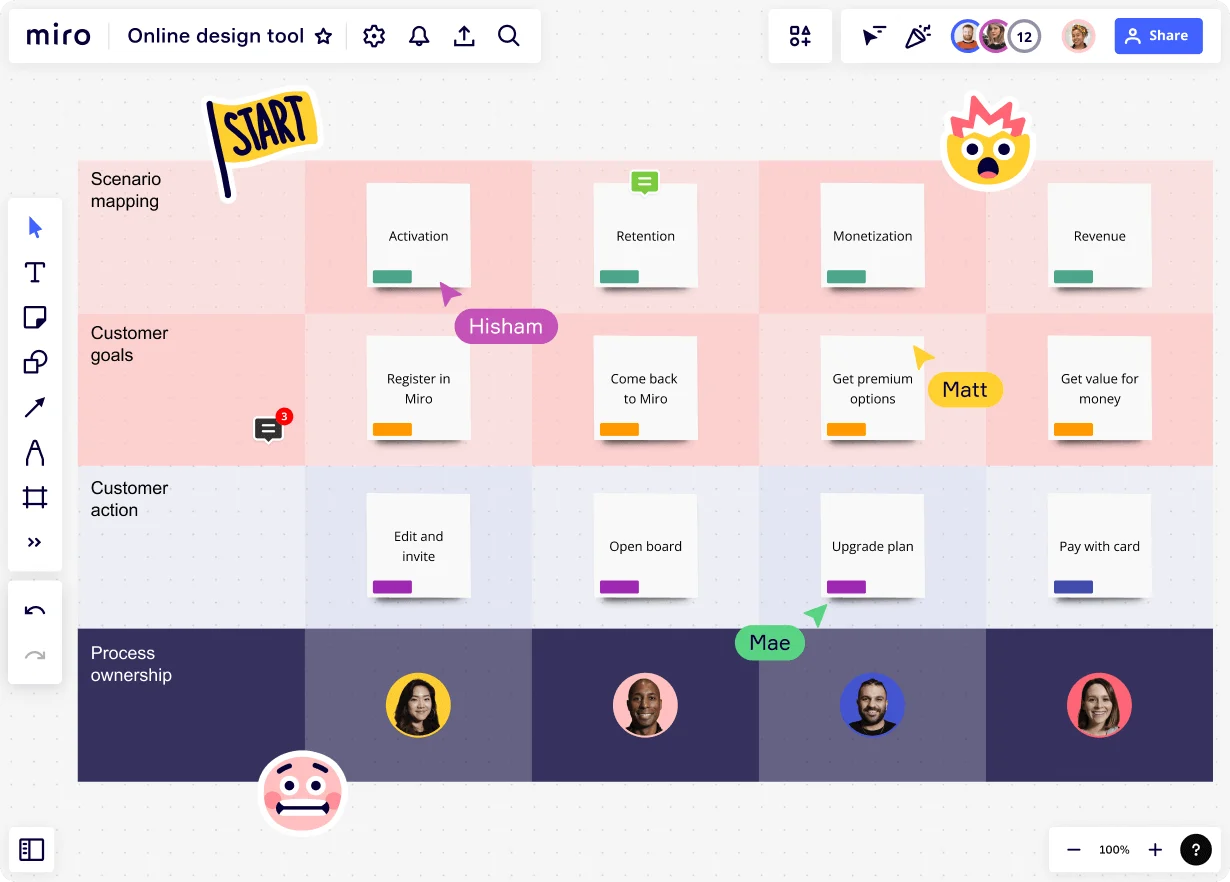
Over 70M+ users love Miro.
Iterative design process
Bring many insights into your design thinking process in an infinite online workspace. Explore ready-to-use diagramming, brainstorming, and online design tools that make building user flows and customer journeys easy.
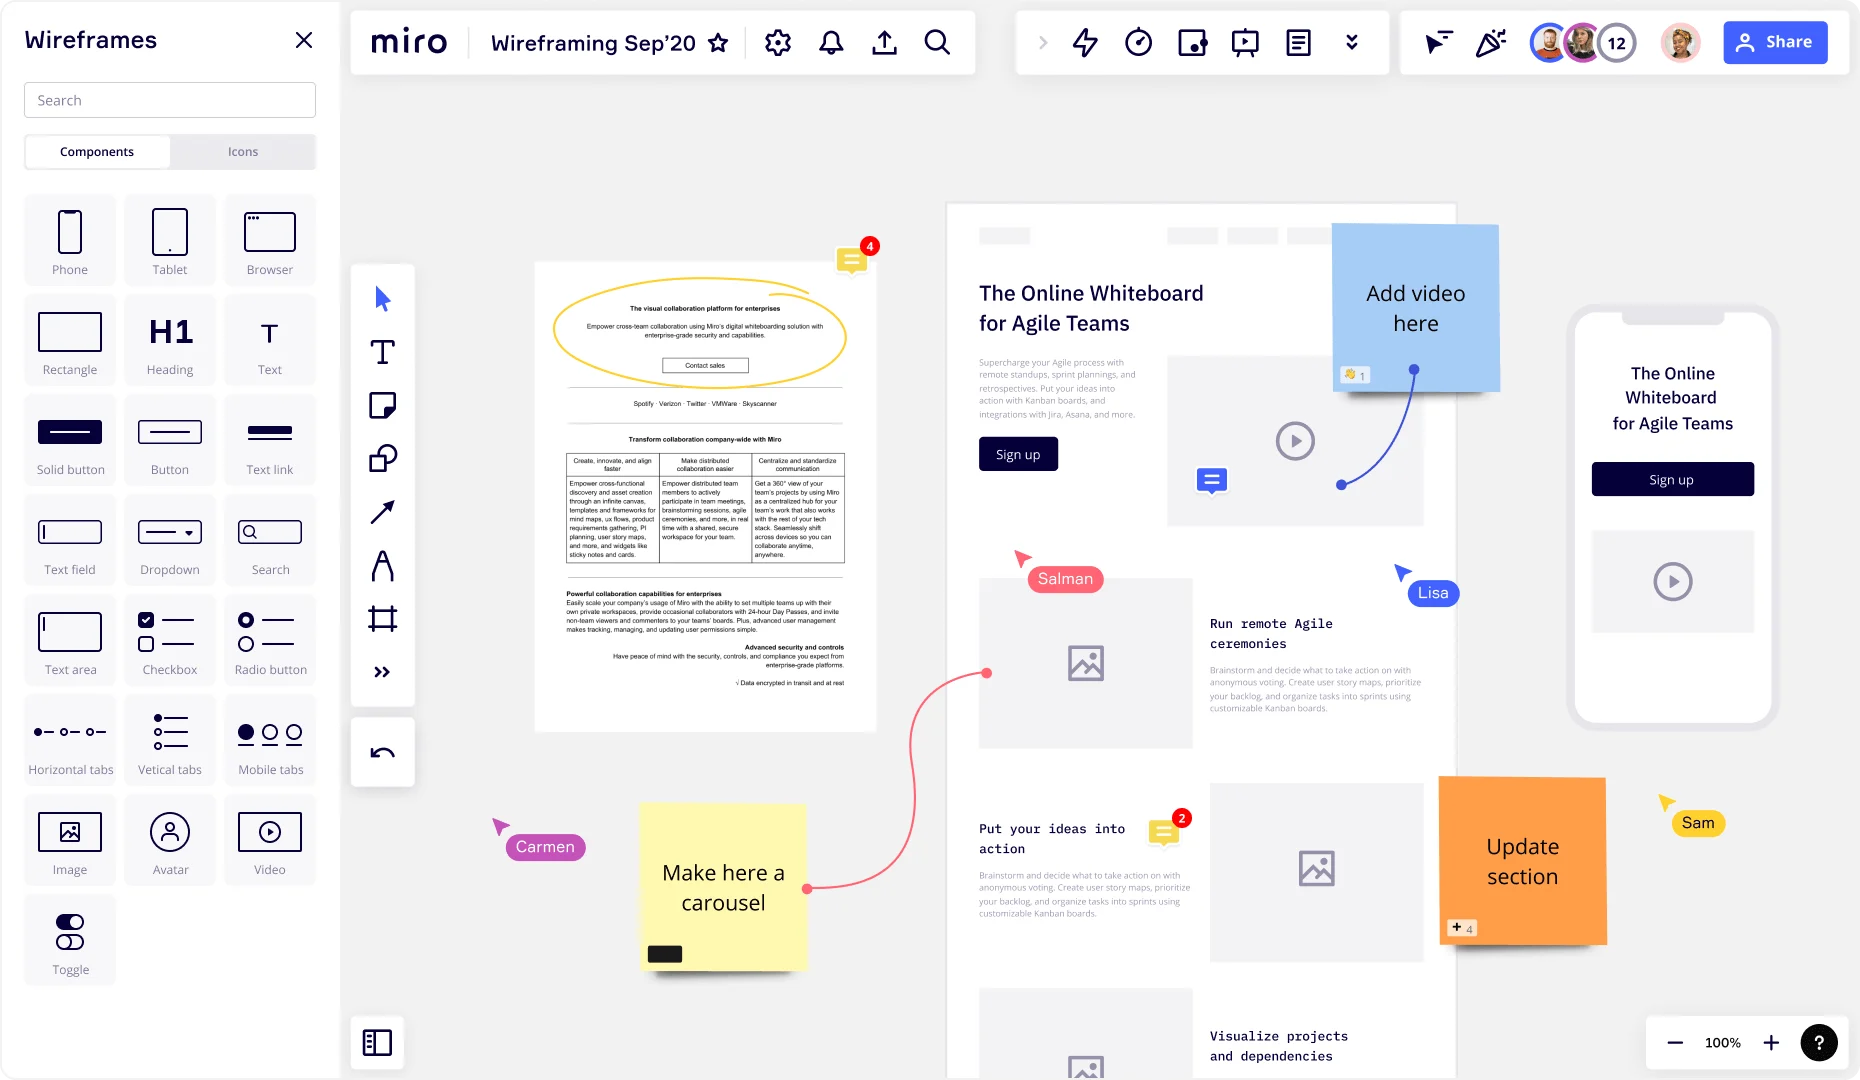
Run remote design sprints
Run an engaging design thinking workshop to build and test prototypes by combining content and data from design, research, and BI tools. Facilitate an inclusive working session with distributed teammates with features like timer, voting, private mode, and breakout boards.
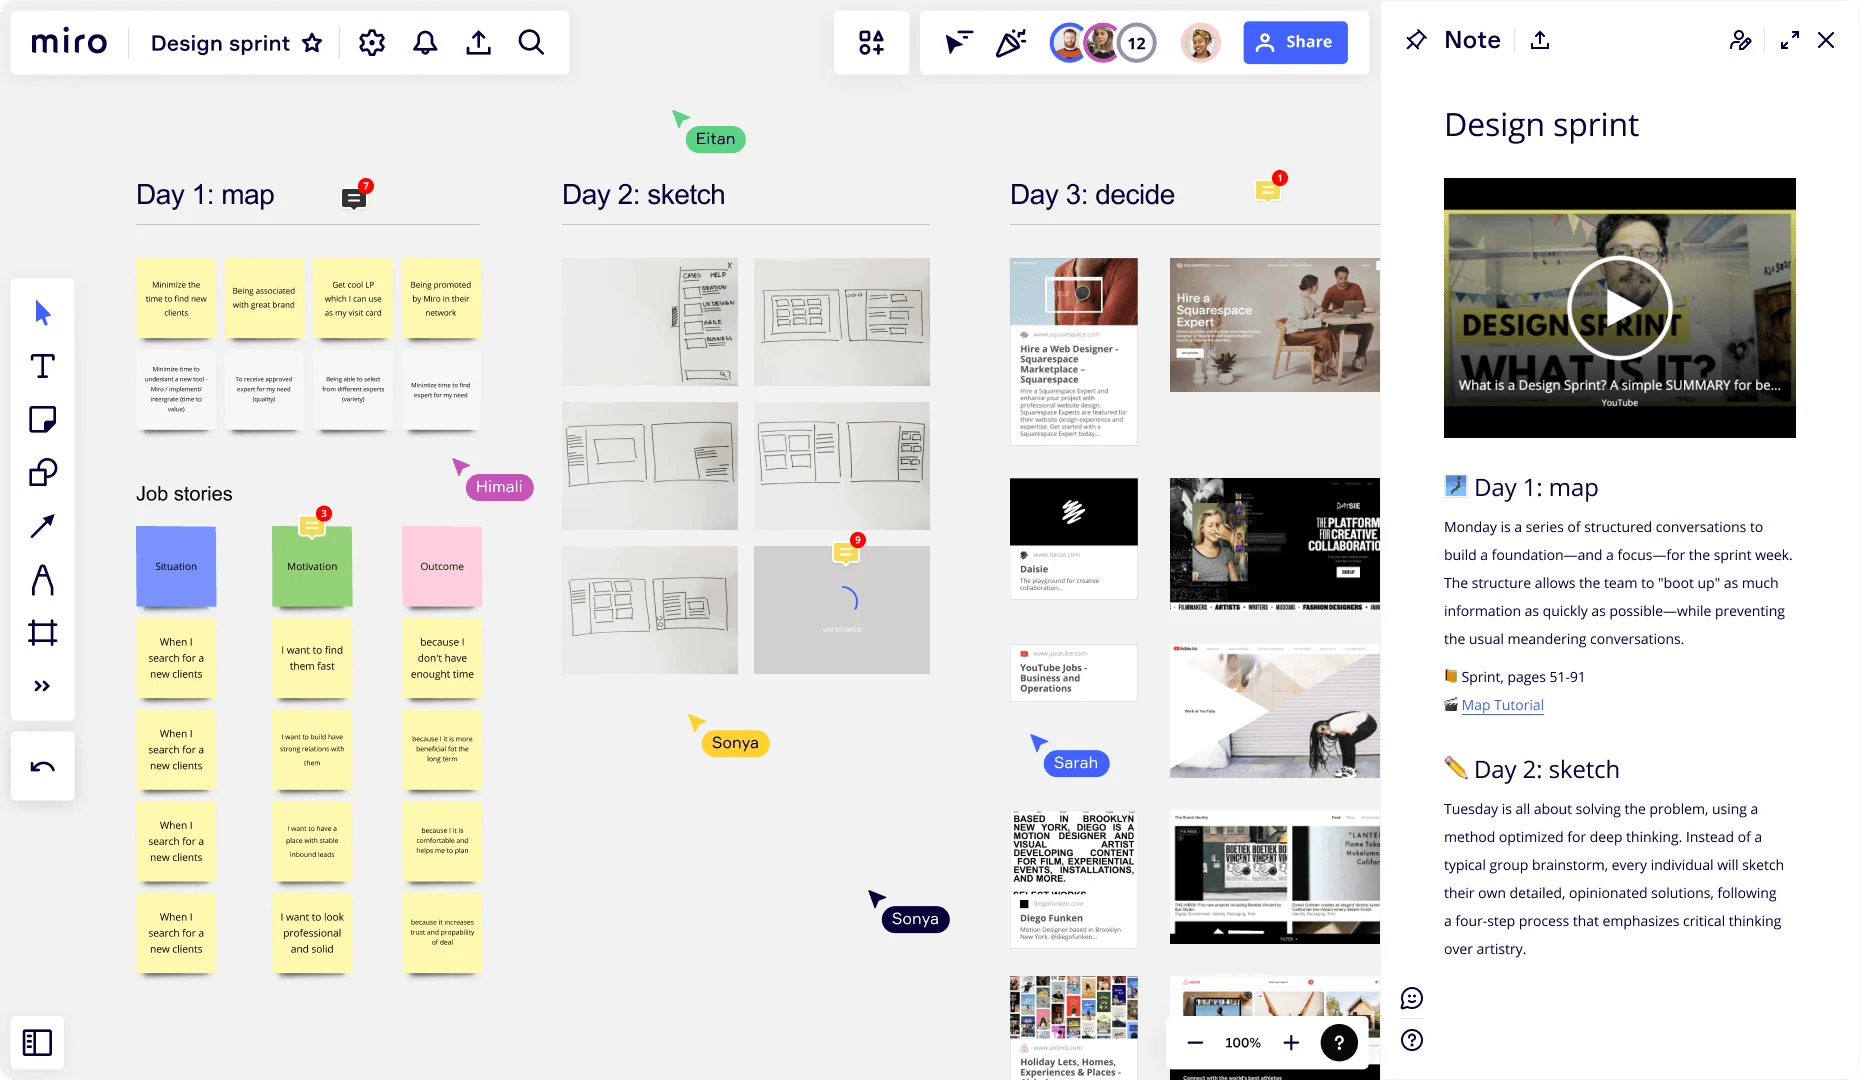
Create a research project hub
Bring content and data together by adding files or embedded user research. Enrich your understanding by integrating data from business intelligence (BI) tools so that you can build sustainable, feasible, and viable products and services using real time insights.
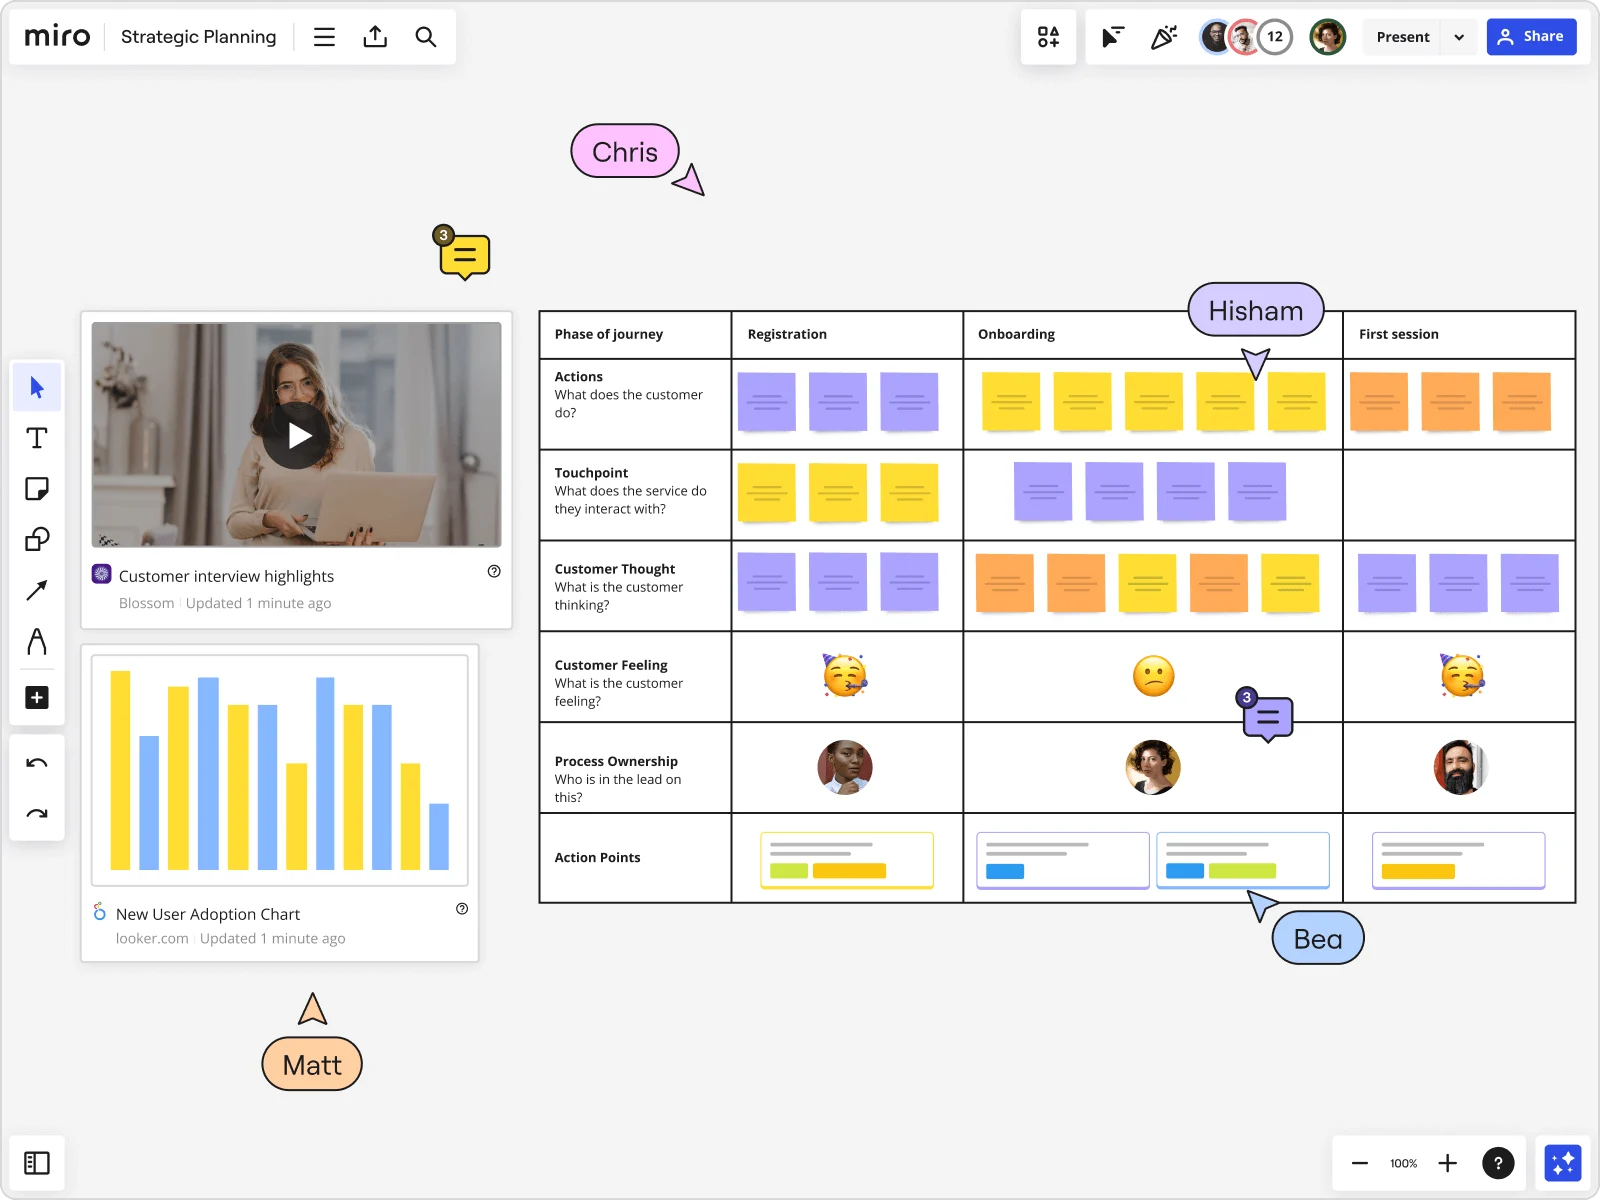
The online design tool for every step of your process
Simplify your design process.
Discover the designer in everyone with an easy-to-use online canvas, pre-built UX, and wireframing templates. Drive diversity and a customer-first culture by making the process inclusive for the whole team.
Don’t start from scratch
Solve big problems in less time with pre-built Design Sprint Templates and facilitation features like voting, timer, and screen share. Enable your team to think big and move fast.
Uncover insights from research
Synthesize interview and survey data with Sticky Note clustering and tagging. Create personas, affinity maps, mind maps, user flows, and more to further develop your strategy.
Increase efficiency
Reduce time looking for information. Organize references, research, and design files all in one shared design thinking canvas, where you can gather feedback and iterate.
Related templates
Design brief template
Identify the competitive landscape and your company’s relation to it.
Design thinking templates
Give your team the best design resources and opportunity to develop innovative solutions.
Remote Design Sprint
Accelerate innovation by running a Design Sprint with a distributed team.
Design Research Template
Use a Design Research Template to predict links between industry trends to make better business decisions.
Design sprint template
Build better products with innovative and faster processes.
Design Critique Template
Use the Design Critique Template to analyze designs and give feedback.
More than just an online design tool
Connect your entire organization in one shared space for faster project delivery times, increased team alignment, and less time spent in meetings. Miro is an online workspace for innovation that enables teams to build the next big thing.
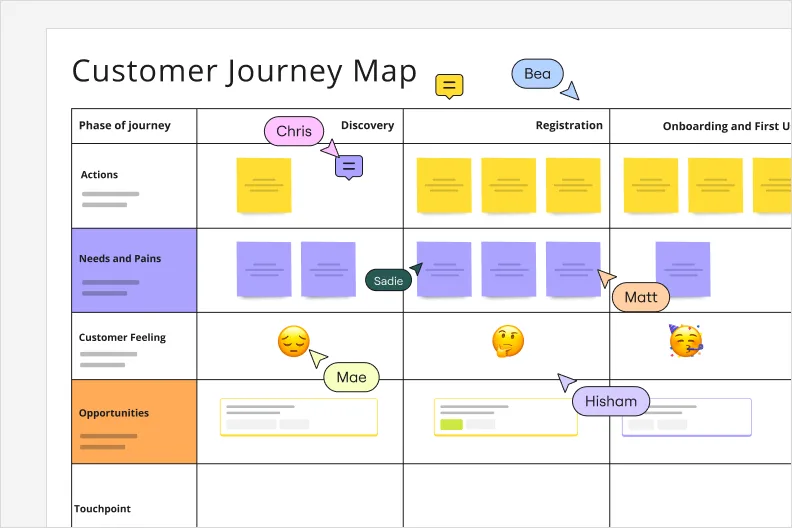
Customer Journey Map
Easily plan and build your user journey with Miro’s customer journey mapping tool. Exercise empathy, understand your customer’s wants and needs, and build stellar experiences.

Research Synthesis
Miro supports the entire research cycle seamlessly, culminating in efficient research synthesis.

Design Sprint
Run a design sprint that engages your entire team, driving more productivity and insights.

Wireframing
Create quick app and website wireframes, ideate on sticky notes, map user flows, and collect references. Do it all in real time with your team on one board.
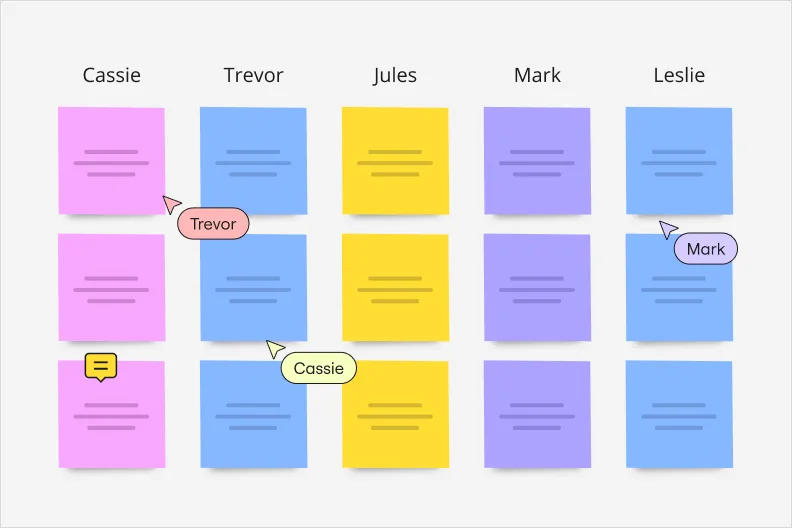
Brainstorming
Unleash your creative ideas on an infinite canvas and collaborate in real time from any location. Think in many formats with sticky notes, diagrams, and more.
How to run your design processes in Miro
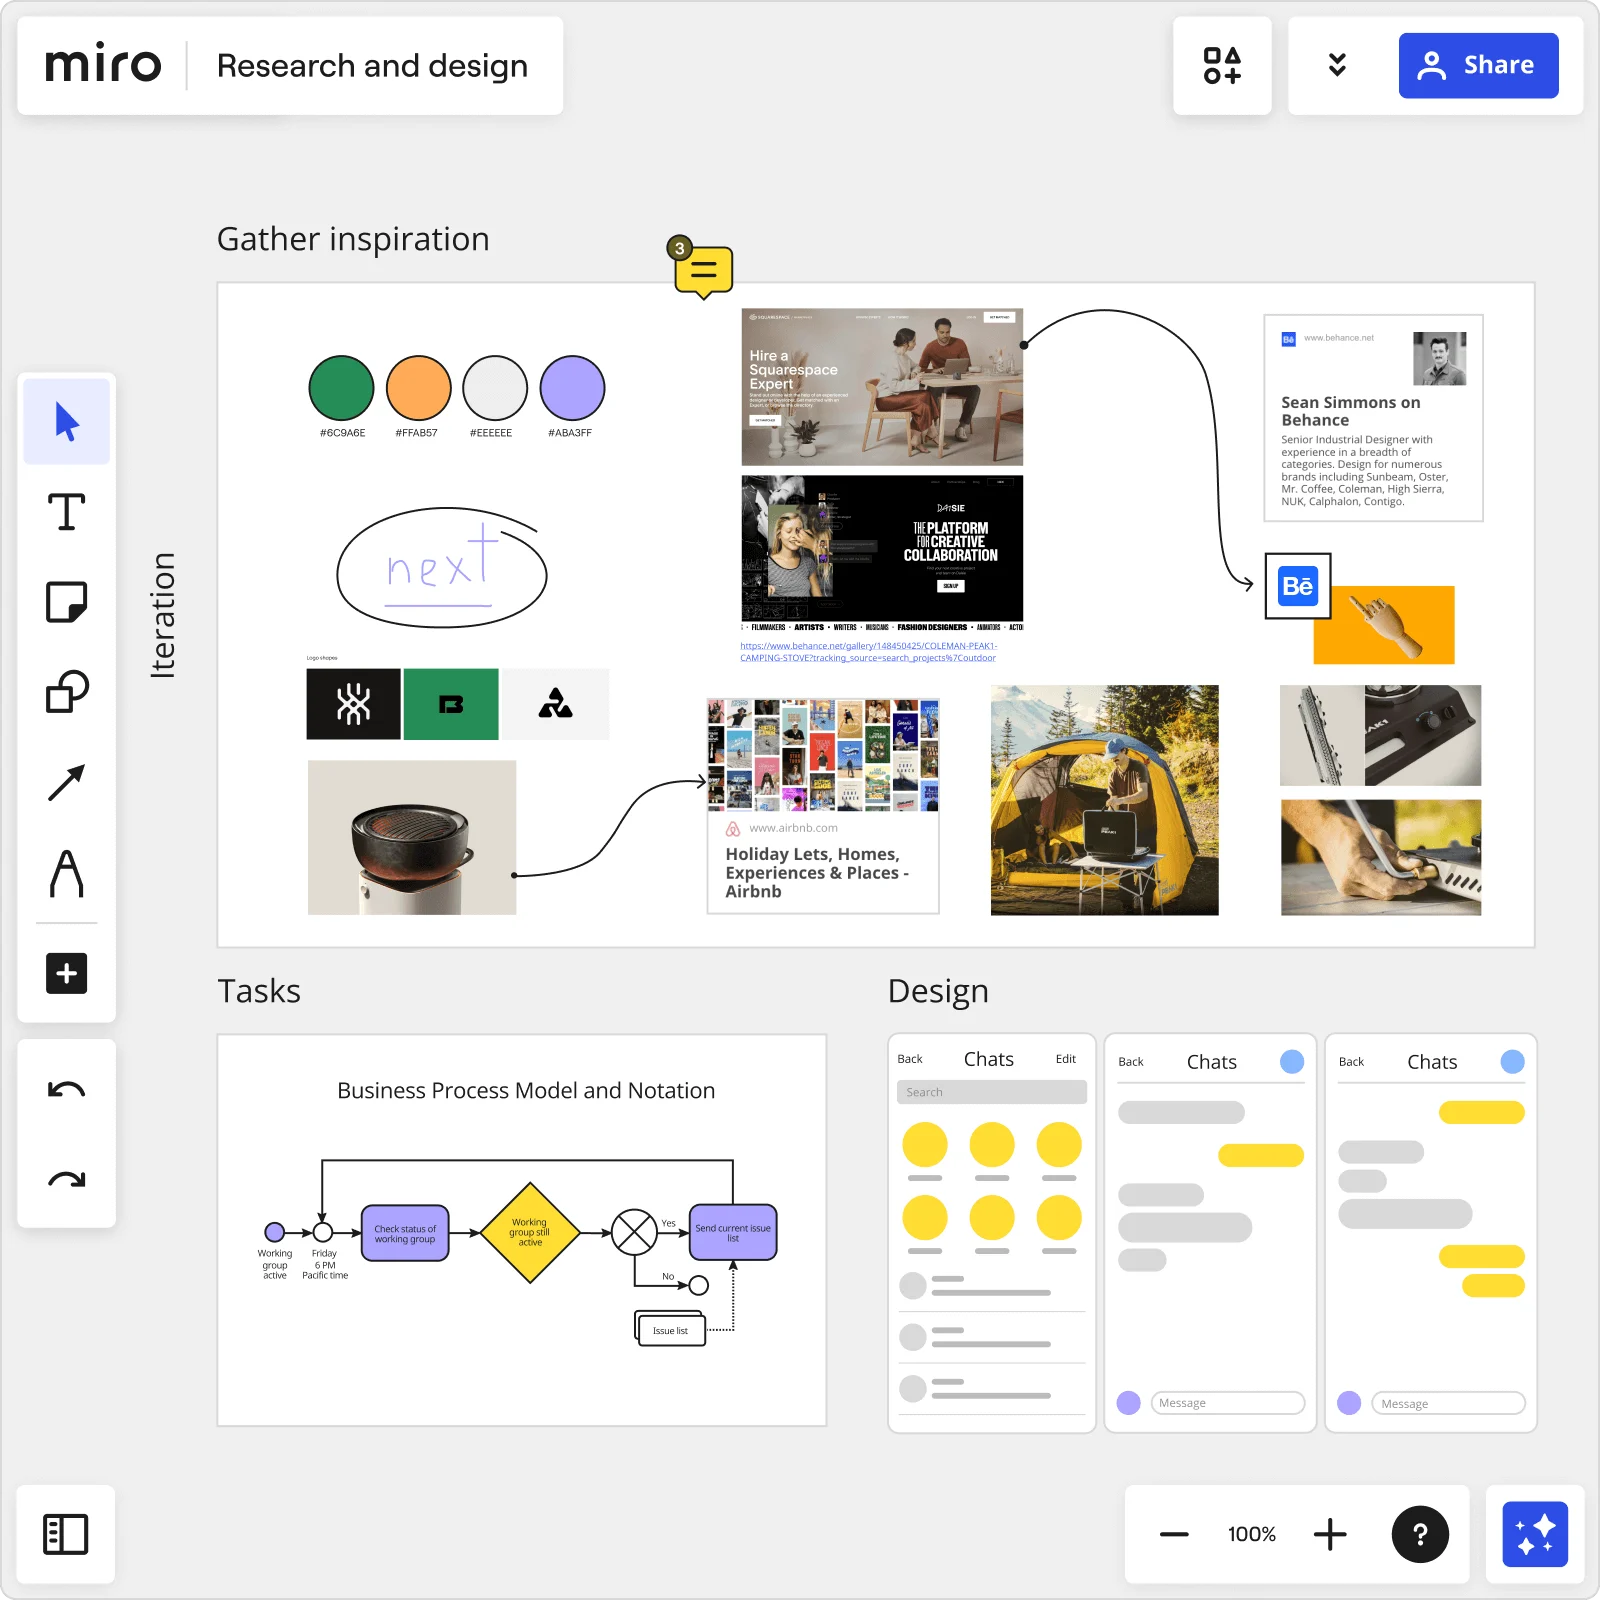
Start with brainstorming
Brainstorm with sticky notes and add all ideas onto the board. Remember, no idea is a bad idea at this stage. Don’t forget to take into consideration your insights from user interviews and customer journey maps.
Organize and prioritize
Cluster stickies by tag, keyword, author, or sentiment. The voting feature lets your team collaboratively decide which ideas deserve more attention.
Sketch and prototype
Use the Wireframe Library to sketch interfaces, and user flows or create low-fidelity prototypes.
Review and Iterate
Invite stakeholders to give instant feedback with comments. Remember, it's about quick feedback and iterations - the faster you loop, the better your designs become.
Online design tool FAQs
What are some of the best online design tools available.
Several online design tools are available, each with its own features and strengths. When choosing a tool for your project and organization, make sure it has collaborative features, intuitive UI, and accessibility so you ideate, plan, and execute projects all in one share space, increasing efficiency and productivity.
Can I collaborate with my team using online design tools?
In Miro, you can invite others to join you on your board by simply sharing your board link. Share designs, leave comments, and work together in real time or async, no matter your team setup.
Does Miro’s online design tool offer templates?
Yes, Miro has a robust templates library to help you kick-start your design process. These templates range from design sprints and presentations to website layouts and wireframes.
Can I use Miro’s online design tool for free?
Yes. You can start using Miro for your design processes for free, no payment required. Sign up for a free account and start getting your ideas done.
Design sprints: what they are and how to successfully run one
How to use design thinking in product development
When design meets business – basics of the design thinking process
MARKET PLACE
Design tools
What is collaborative design?
How to create a culture of innovation?
What is UI design?
What is UX design?
Miro vs Whimsical
Miro vs Canva
ALTERNATIVE
Explore Canva Alternatives for Design and Collaboration
Get on board in seconds
Join thousands of teams using Miro to do their best work yet.
Product Design Bundle and save
User Research New
Content Design
UX Design Fundamentals
Software and Coding Fundamentals for UX
- UX training for teams
- Hire our alumni
- Student Stories
- State of UX Hiring Report 2024
- Our mission
- Advisory Council
Education for every phase of your UX career
Professional Diploma
Learn the full user experience (UX) process from research to interaction design to prototyping.
Combine the UX Diploma with the UI Certificate to pursue a career as a product designer.
Professional Certificates
Learn how to plan, execute, analyse and communicate user research effectively.
Master content design and UX writing principles, from tone and style to writing for interfaces.
Understand the fundamentals of UI elements and design systems, as well as the role of UI in UX.
Short Courses
Gain a solid foundation in the philosophy, principles and methods of user experience design.
Learn the essentials of software development so you can work more effectively with developers.
Give your team the skills, knowledge and mindset to create great digital products.
Join our hiring programme and access our list of certified professionals.
Learn about our mission to set the global standard in UX education.
Meet our leadership team with UX and education expertise.
Members of the council connect us to the wider UX industry.
Our team are available to answer any of your questions.
Fresh insights from experts, alumni and the wider design community.
Success stories from our course alumni building thriving careers.
Discover a wealth of UX expertise on our YouTube channel.
Latest industry insights. A practical guide to landing a job in UX.
The 10 best UX research tools to use in 2023
In this guide, we introduce 9 of the best UX research tools on the market right now. We’ll also share some advice on how to choose the most suitable tools for your work.

Free course: Introduction to UX Design
What is UX? Why has it become so important? Could it be a career for you? Learn the answers, and more, with a free 7-lesson video course.

All good UX begins with user research—and all good user research relies on the right tools.
But, with so many tools to choose from, where do you even start?
Look no further. In this guide, we introduce 9 of the best UX research tools on the market right now. We’ll also share some advice on how to choose the most suitable tools for your work.
What is UX research and why does it matter?
- 9 of the best UX research tools available in 2023
How to choose the right tools for your UX research
Ready to become a user research pro? Let’s begin.
[GET CERTIFIED IN USER RESEARCH]
Before we explore the best tools for the job, let’s recap on what exactly UX research is—and why it’s so important.
UX design is all about solving a real problem for real, human users. UX research helps you to identify the problem you need to solve, and to understand how best to solve it based on what you know about your users.
Without user research, you’re basing your work on assumptions. This inevitably leads to a mismatch between the user experience and the people you’re designing it for—i.e. bad UX!
That’s why all good designers start their UX process with research. UX research involves:
- Conducting interviews, surveys, card sorting exercises and focus groups (to name a few!) with real or representative users to see what they expect from the user experience and what pain-points they currently encounter
- Analysing the data gathered to uncover key themes and user problems
- Defining the scope of the problems uncovered and determining what to prioritise
- Sharing your findings with key stakeholders
- Continually testing and iterating on your designs to optimise the user experience
You can learn more about what UX research is in this dedicated guide .
What’s the difference between qualitative and quantitative research?
As you consider what tools to use for your UX research, it’s important to distinguish between quantitative and qualitative research.
Quantitative user research gathers objective, measurable data that can be quantified (i.e. counted). Some examples of quantitative data might be the number of clicks it takes a user to complete their desired task on a website, or the percentage of users who bounce in a given time frame.
Qualitative user research isn’t concretely measurable, but it can give you much deeper insights into how your users think, feel and behave. For example, if you conduct interviews to find out how your users feel about a particular product, that’s qualitative research. Likewise, if you observe a user trying to navigate an app and note down that they get really frustrated, that’s qualitative data.
UX designers tend to conduct both qualitative and quantitative research for a broad and detailed picture of their users.
What’s the difference between moderated and unmoderated user research?
Another distinction to be aware of is that between moderated and unmoderated research.
Moderated UX research takes place with the user researcher present. If you’re interviewing a user live via video call, or observing them while they complete a certain task and asking follow-up questions, you’re conducting moderated UX research.
Unmoderated UX research takes place without your supervision. This includes things like surveys which the user answers in their own time, or usability tests where the user might record their screen while they interact with your website.
What are the best UX research tools?
Now we know about the different types of user research you might conduct, let’s explore some of the best UX research tools on the market right now.
1. Optimal Workshop for card sorting, tree testing and first-click testing

Optimal Workshop isn’t just a user research tool—it’s an entire toolbox. You can use it to conduct both qualitative and quantitative user research, and to recruit participants.
Optimal Workshop allows you to see participant responses as they come in, and to view your data in the form of easy-to-understand visualisations—ideal for sharing your insights with others.
You can use Optimal Workshop to conduct card sorting exercises, tree testing, first-click testing, and surveys.
Optimal Workshop comprises 5 tools:
- OptimalSort , a card sorting tool that shows you how your users categorise information. This is useful when mapping out the information architecture of a website or app.
- Treejack , a tree testing tool that shows you how easily people can find information on your website or app—and where they get lost.
- Chalkmark for first-click testing. This enables you to test the usability of an existing design. You can upload screenshots, sketches or wireframes and test to see if users are able to navigate with ease.
- Questions for creating and sending out online surveys. You can attach wireframes or sketches for more specific feedback.
- Reframer for note-taking and documentation. This is useful for organising all your qualitative research insights in one place. Reframer is actually number 8 on our list, so more on that later!
Main features at a glance:
- 1 platform, 5 tools for card sorting, tree testing, first-click testing, surveys, and documenting qualitative research insights
- Participant recruitment service (available in 70+ languages)
- View participant responses as they come in
- Data visualisations accessible via the Optimal Workshop dashboard
How much does it cost?
Optimal Workshop offers a free plan with no requirement to upgrade. If you do want more functionality, paid options include:
- The Starter plan for small-scale research projects at $99/month (approx. €88).
- The Pro plan for unlimited studies at $166/month (approx. €150) for 1 user.
- The Team plan for unlimited studies at $153/month per user (approx. €140) for up to 3 users.
2. Looppanel for user interviews and usability tests

Looppanel is an AI-powered research analysis & repository product that makes it 5x faster to discover and share user insights.
Looppanel acts like your research assistant: it records, transcribes, creates notes, and organizes your data for easy analysis.
Teams like PandaDoc, Huge Inc., Airtel, and others use Looppanel to streamline research analysis and build their insights repository.
Main Features at a glance
- Automatically generated notes for user interviews
- 90%+ accuracy transcription in 8 languages
- Integrations with Zoom, Google Meet, Teams to auto-record calls
- Time-stamped notes taken live during interviews
- Ability to tag and annotate on transcripts
- 1-click to create shareable video clips
- Analysis workspace to view project data by question or tag
- Search across projects
Looppanel offers a free 15-day trial. After that, you can choose from a range of paid plans:
- Starter (for small teams / solo researchers): An affordable starter plan for $30/month that includes 10 transcription hours / month
- Teams: For teams of 3+ researchers, this plan is priced at $350/month and comes with 30 transcription hours / month
- Business: For organizations with large teams or significant security requirements, the business plan costs $1,000/month for 120 transcription hours / month
- Custom: For enterprise teams of larger sizes
3. Lookback for user interviews
Lookback is a video research platform for conducting both moderated and unmoderated user interviews and usability tests.
The collaborative dashboard allows you to sync all your research, tag your teammates, and create highlight reels of all the most useful insights. You can set up virtual observation rooms, record users’ screens as they navigate your app or website, and transcribe your user interviews.
- Moderated and unmoderated video interviews and user testing sessions
- Timestamped notes captured live during sessions
- Virtual observation rooms: Invite stakeholders to observe user research sessions and chat with each other in a separate virtual room
- Screen capturing: Watch and record participant touches on mobile screens during interactions
- Create highlight videos and compile them into highlight reels
- Collaborative dashboard
Lookback offers a free 14-day trial. After that, there are a range of paid plans to choose from:
- Freelance: An affordable solo plan for $17/month (approx. €15). Includes 10 sessions/year.
- Team: $99/month (approx. €90) for 100 sessions/year.
- Insights Hub: $229/month (approx. €205) for 300 sessions/year.
4. Typeform for surveys
Surveys are a UX research staple, offering a quick, easy and inexpensive way to gather user insights. When sending out surveys for UX research, you’ll usually ask questions about the respondents’ attitudes and preferences in relation to the product or service you’re designing.
Typeform is one of the most popular survey tools among UX designers. With Typeform, you can design your own surveys from scratch or choose from a range of templates. After you’ve distributed your survey, you can see responses and completion rates and generate shareable reports.
- Dozens of UX research templates, including a user persona survey template , a product research survey template and a product feedback template
- Conditional logic to ensure that users only see relevant follow-up questions based on their previous answer
- Shareable reports after survey completion
- Integrations for Google Sheets, Slack, Airtable and more
Typeform has a free plan with unlimited forms, 10 questions per form, and 10 responses per month. You can stay on the free plan for as long as you like, or upgrade for additional features:
- Basic: €21/month (1 user, unlimited typeforms, up to 100 responses/month)
- Plus: €46/month (3 users, unlimited typeforms, up to 1,000 responses/month)
- Business: €75/month (5 users, unlimited typeforms, up to 10,000 responses/month)
View all price plans and features on the Typeform website .
5. Maze for user surveys, concept validation, and wireframe & prototype testing
Maze is another UX research all-rounder with a focus on rapid testing. You can use it for card sorting, tree testing, 5-second tests, surveys, and to test wireframes and prototypes on real users.
Maze integrates with all the industry-standard UX tools like Figma, Sketch, Adobe XD and InVision. It’s even got a built-in panel of user testers, promising user insights in less than 2 hours.
Maze also handles the analytics, presenting your research insights in the form of a visual report.
- Prototype testing to validate your designs before developing them
- Tree testing to ensure your information architecture is user-friendly
- 5-second testing to assess user sentiment when first interacting with your product
- Surveys to scale your UX research
- Card sorting to help plan or test your product’s information architecture
- Built-in panel of over 70,000 testers
- Analytics and visual reports
[GET CERTIFIED IN UX]
6. UserZoom for surveys, card sorting, click testing, and usability tests

Similar to Optimal Workshop and Maze, UserZoom is a complete UX research toolbox used for card sorting, usability testing, surveys, click testing, tree testing, and user interviews. The platform also includes a fully-integrated participant recruitment engine with over 120 million users worldwide.
- Moderated and unmoderated usability testing
- Surveys for quickly gathering user feedback at scale
- Click testing to evaluate early stage concepts
- Open and closed card sorting to inform your information architecture and understand your users’ mental models
- Interviews to gather self-reported insights from your users
- Tree testing to assess your information architecture
- Participant recruitment engine with over 120 million users worldwide
- Integrations with Adobe XD, Miro, Jira, Mural, Typeform and more
UserZoom offers custom price plans depending on your needs. Find out more here .
7. dscout for remote user interviews and diary studies
A versatile suite of research tools, dscout is ideal for conducting remote user studies.
There are four main pillars of the dscout platform: Diary, Live, Recruit, and Express.
Diary is a remote diary studies tool which allows you to gather contextual, qualitative insights into user behaviour and experiences. If you’re new to diary studies, dscout has put together a helpful guide on how and why to conduct diary studies here .
Live is a user interview tool, and Express is a flexible user survey solution. Recruit is the final piece in the puzzle: a panel of over 100 thousand users you can enlist for your UX research.
- Diary for conducting remote diary studies
- Live for user interviews with auto-transcribe, real-time note-taking and screen-sharing capabilities
- Express for user surveys
- Recruit, a built-in panel of 100 thousand user research participants
- Research synthesis and analysis: automatically generate charts and word clouds
- Loads of guides, resources and templates to help you get started
dscout offers customisable subscription plans depending on your needs. You can learn more about the different plans and request a quote here .
8. Hotjar for analytics and heatmaps
Hotjar is a powerful behaviour analytics tool that enables you to really see how your users engage with an existing product.
You can use Hotjar to send out surveys, capture and watch screen recordings of people interacting with your website, create heatmaps, and gather real-time user feedback. Hotjar is all about stepping into your users’ shoes and improving the user experience accordingly!
- Heatmaps to see where users click and how they navigate your site. This is helpful for identifying any usability issues or UX flaws
- Screen recordings to see first-hand how people interact with your product
- Real-time user feedback via a suggestion box integrated into your website
- Surveys and survey templates
- Integrations with Slack, Miro, Jira, Asana and more
Hotjar’s basic free plan is pretty extensive, offering up to 35 daily sessions, unlimited heatmaps, and up to 1,050 recordings per month. For more research capability, paid plans include:
- Plus: €31/month —ideal for small teams
- Business: €79/month —for growing companies and websites
- Scale: €311/month —for large companies and websites
See Hotjar’s price overview for more information.
9. Reframer for analysing qualitative research
Reframer is part of the Optimal Workshop suite of UX research tools (number 1 on our list), but we think it’s worth a special mention. As UX designer Carrie Nusbaum notes in her own review of Reframer : “There are many tools that support the act of actual user testing, and many that facilitate design. Relatively few tools, however, specifically support some important steps that take place in between, namely: data organisation, research synthesis, and presentation of findings.”
Reframer seeks to fill this gap. It’s a unique tool dedicated to capturing all your qualitative research notes in one place, helping you to analyse and make sense of them. It’s your “qualitative research sidekick”, bringing some much-needed structure to the often messy task of qualitative research.
- Directly capture research observations straight into Reframer; no Post-it notes or separate Google Doc needed
- Theme builder: easily construct a coding system with tags and build out themes for your research findings
- Chord and bubble charts to visualise your findings and easily spot patterns and trends
- XLS export: you can export your research as a .xls file, enabling you to transfer it to other tools and platforms if needed
You can use Reframer as part of the Optimal Workshop toolbox. Optimal Workshop offers a free plan which you can use for as long as you like. For increased functionality, the following paid plans are available:
10. Asana for planning and organising your UX research
Asana isn’t a UX research tool per se, but it’s an excellent tool for organising and keeping track of all your research projects.
With the Timeline feature, you can create project plans to see exactly what’s happening and when, or visualise your workflow with a Kanban-style board . This allows you to drag and drop cards into different columns depending on their status (e.g. in progress, awaiting feedback, done).
You can add multiple collaborators to different projects, assign various tasks to individual team members, and provide updates via the commenting function.
Asana essentially has everything you need to manage your research projects collaboratively from start to finish.
- Shared team calendar for an overview of who’s working on what, and when
- Visual project management in the form of lists or boards, with the ability to break projects down into smaller subtasks and assign them to different stakeholders
- Project briefs and templates to standardise and streamline your workflows
- In-platform communication via task comments or private messaging
- Integrations with Slack, Google Drive, Dropbox, email, and more
You can use the free basic version of Asana for as long as you like, with extensive capabilities (ideal for individuals and smaller teams). For more robust project management, Asana offers two paid plans:
- Premium at €10.99/user per month
- Business at €24.99/user per month
You’ll find more information on Asana’s pricing overview page .
Ultimately, the tools you choose to work with will depend on the UX research methodologies you want to use, and on the scale of your research.
If you’re conducting small-scale research with just a few participants, you may not need an entire suite of tools with recruiting and analytics built in—a good survey tool and reliable video conferencing software should suffice.
But, if you’re conducting large-scale research with dozens or even hundreds of participants, and working as part of a team, you’ll want a set of UX research tools that are collaborative and versatile, covering everything from recruiting to synthesis and analysis.
You can mix and match your research tools, too: you might use Typeform for surveys, Lookback for user interviews, and Asana to collate all your findings. Before you settle on a specific tool, try it out with a free trial, read up on what other designers have said about their experience with the platform, and compare it to a few alternatives on the market.
Hopefully this guide has given you a good starting point from which to build out your UX research toolkit. If you’d like to learn more about UX tools, check out this complete guide to the best tools for every stage of the UX design process .
Subscribe to our newsletter
Get the best UX insights and career advice direct to your inbox each month.
Thanks for subscribing to our newsletter
You'll now get the best career advice, industry insights and UX community content, direct to your inbox every month.
Upcoming courses
Professional diploma in ux design.
Learn the full UX process, from research to design to prototyping.
Professional Certificate in UI Design
Master key concepts and techniques of UI design.
Certificate in Software and Coding Fundamentals for UX
Collaborate effectively with software developers.
Certificate in UX Design Fundamentals
Get a comprehensive introduction to UX design.
Professional Certificate in Content Design
Learn the skills you need to start a career in content design.
Professional Certificate in User Research
Master the research skills that make UX professionals so valuable.
Upcoming course
Build your UX career with a globally-recognised, industry-approved certification. Get the mindset, the skills and the confidence of UX designers.
You may also like
 design tools to try in 2024 12")
The 10 best user interface (UI) design tools to try in 2024

The 6 Best AI Tools for Content Design in 2024

AI for UX: 5 ways you can use AI to be a better UX designer
Build your UX career with a globally recognised, industry-approved qualification. Get the mindset, the confidence and the skills that make UX designers so valuable.
2 July 2024
- University Libraries
- Research Guides
- Topic Guides
- Research Methods Guide
- Research Design & Method
Research Methods Guide: Research Design & Method
- Introduction
- Survey Research
- Interview Research
- Data Analysis
- Resources & Consultation
Tutorial Videos: Research Design & Method
Research Methods (sociology-focused)
Qualitative vs. Quantitative Methods (intro)
Qualitative vs. Quantitative Methods (advanced)

FAQ: Research Design & Method
What is the difference between Research Design and Research Method?
Research design is a plan to answer your research question. A research method is a strategy used to implement that plan. Research design and methods are different but closely related, because good research design ensures that the data you obtain will help you answer your research question more effectively.
Which research method should I choose ?
It depends on your research goal. It depends on what subjects (and who) you want to study. Let's say you are interested in studying what makes people happy, or why some students are more conscious about recycling on campus. To answer these questions, you need to make a decision about how to collect your data. Most frequently used methods include:
- Observation / Participant Observation
- Focus Groups
- Experiments
- Secondary Data Analysis / Archival Study
- Mixed Methods (combination of some of the above)
One particular method could be better suited to your research goal than others, because the data you collect from different methods will be different in quality and quantity. For instance, surveys are usually designed to produce relatively short answers, rather than the extensive responses expected in qualitative interviews.
What other factors should I consider when choosing one method over another?
Time for data collection and analysis is something you want to consider. An observation or interview method, so-called qualitative approach, helps you collect richer information, but it takes time. Using a survey helps you collect more data quickly, yet it may lack details. So, you will need to consider the time you have for research and the balance between strengths and weaknesses associated with each method (e.g., qualitative vs. quantitative).
- << Previous: Introduction
- Next: Survey Research >>
- Last Updated: Aug 21, 2023 10:42 AM
Root out friction in every digital experience, super-charge conversion rates, and optimize digital self-service
Uncover insights from any interaction, deliver AI-powered agent coaching, and reduce cost to serve
Increase revenue and loyalty with real-time insights and recommendations delivered to teams on the ground
Know how your people feel and empower managers to improve employee engagement, productivity, and retention
Take action in the moments that matter most along the employee journey and drive bottom line growth
Whatever they’re are saying, wherever they’re saying it, know exactly what’s going on with your people
Get faster, richer insights with qual and quant tools that make powerful market research available to everyone
Run concept tests, pricing studies, prototyping + more with fast, powerful studies designed by UX research experts
Track your brand performance 24/7 and act quickly to respond to opportunities and challenges in your market
Explore the platform powering Experience Management
- Free Account
- For Digital
- For Customer Care
- For Human Resources
- For Researchers
- Financial Services
- All Industries
Popular Use Cases
- Customer Experience
- Employee Experience
- Net Promoter Score
- Voice of Customer
- Customer Success Hub
- Product Documentation
- Training & Certification
- XM Institute
- Popular Resources
- Customer Stories
- Artificial Intelligence
Market Research
- Partnerships
- Marketplace
The annual gathering of the experience leaders at the world’s iconic brands building breakthrough business results, live in Salt Lake City.
- English/AU & NZ
- Español/Europa
- Español/América Latina
- Português Brasileiro
- REQUEST DEMO
What is design research methodology and why is it important?
What is design research.
Design research is the process of gathering, analyzing and interpreting data and insights to inspire, guide and provide context for designs. It’s a research discipline that applies both quantitative and qualitative research methods to help make well-informed design decisions.
Not to be confused with user experience research – focused on the usability of primarily digital products and experiences – design research is a broader discipline that informs the entire design process across various design fields. Beyond focusing solely on researching with users, design research can also explore aesthetics, cultural trends, historical context and more.
Design research has become more important in business, as brands place greater emphasis on building high-quality customer experiences as a point of differentiation.
Elevate Your Brand's Potential with Qualtrics
Design research vs. market research
The two may seem like the same thing at face value, but really they use different methods, serve different purposes and produce different insights.
Design research focuses on understanding user needs, behaviors and experiences to inform and improve product or service design. Market research , on the other hand, is more concerned with the broader market dynamics, identifying opportunities, and maximizing sales and profitability.
Both are essential for the success of a product or service, but cater to different aspects of its lifecycle.
Design research in action: A mini mock case study
A popular furniture brand, known for its sleek and simple designs, faced an unexpected challenge: dropping sales in some overseas markets. To address this, they turned to design research – using quantitative and qualitative methods – to build a holistic view of the issue.
Company researchers visited homes in these areas to interview members of their target audience and understand local living spaces and preferences. Through these visits, they realized that while the local customers appreciated quality, their choices in furniture were heavily influenced by traditions and regional aesthetics, which the company's portfolio wasn’t addressing.
To further their understanding, the company rolled out surveys, asking people about their favorite materials, colors and furniture functionalities. They discovered a consistent desire for versatile furniture pieces that could serve multiple purposes. Additionally, the preference leaned towards certain regional colors and patterns that echoed local culture.
Armed with these insights, the company took to the drawing board. They worked on combining their minimalist style with the elements people in those markets valued. The result was a refreshed furniture line that seamlessly blended the brand's signature simplicity with local tastes. As this new line hit the market, it resonated deeply with customers in the markets, leading to a notable recovery in sales and even attracting new buyers.

When to use design research
Like most forms of research, design research should be used whenever there are gaps in your understanding of your audience’s needs, behaviors or preferences. It’s most valuable when used throughout the product development and design process.
When differing opinions within a team can derail a design process, design research provides concrete data and evidence-based insights, preventing decisions based on assumptions.
Design research brings value to any product development and design process, but it’s especially important in larger, resource intensive projects to minimize risk and create better outcomes for all.
The benefits of design research
Design research may be perceived as time-consuming, but in reality it’s often a time – and money – saver that can. easily prove to be the difference between strong product-market fit and a product with no real audience.
Deeper customer knowledge
Understanding your audience on a granular level is paramount – without tapping into the nuances of their desires, preferences and pain points, you run the risk of misalignment.
Design research dives deep into these intricacies, ensuring that products and services don't just meet surface level demands. Instead, they can resonate and foster a bond between the user and the brand, building foundations for lasting loyalty .
Efficiency and cost savings
More often than not, designing products or services based on assumptions or gut feelings leads to costly revisions, underwhelming market reception and wasted resources.
Design research offers a safeguard against these pitfalls by grounding decisions in real, tangible insights directly from the target market – streamlining the development process and ensuring that every dollar spent yields maximum value.
New opportunities
Design research often brings to light overlooked customer needs and emerging trends. The insights generated can shift the trajectory of product development, open doors to new and novel solutions, and carve out fresh market niches.
Sometimes it's not just about avoiding mistakes – it can be about illuminating new paths of innovation.
Enhanced competitive edge
In today’s world, one of the most powerful ways to stand out as a business is to be relentlessly user focused. By ensuring that products and services are continuously refined based on user feedback, businesses can maintain a step ahead of competitors.
Whether it’s addressing pain points competitors might overlook, or creating user experiences that are not just satisfactory but delightful, design research can be the foundations for a sharpened competitive edge.
Design research methods
The broad scope of design research means it demands a variety of research tools, with both numbers-driven and people-driven methods coming into play. There are many methods to choose from, so we’ve outlined those that are most common and can have the biggest impact.

This stage is about gathering initial insights to set a clear direction.
Literature review
Simply put, this research method involves investigating existing secondary research, like studies and articles, in your design area. It's a foundational method that helps you understand current knowledge and identify any gaps – think of it like surveying the landscape before navigating through it.
Field observations
By observing people's interactions in real-world settings, we gather genuine insights. Field observations are about connecting the dots between observed behaviors and your design's intended purpose. This method proves invaluable as it can reveal how design choices can impact everyday experiences.
Stakeholder interviews
Talking to those invested in the design's outcome, be it users or experts, is key. These discussions provide first-hand feedback that can clarify user expectations and illuminate the path towards a design that resonates with its audience.
This stage is about delving deeper and starting to shape your design concepts based on what you’ve already discovered.
Design review
This is a closer look at existing designs in the market or other related areas. Design reviews are very valuable because they can provide an understanding of current design trends and standards – helping you see where there's room for innovation or improvement.
Without a design review, you could be at risk of reinventing the wheel.
Persona building
This involves creating detailed profiles representing different groups in your target audience using real data and insights.
Personas help bring to life potential users, ensuring your designs address actual needs and scenarios. By having these "stand-in" users, you can make more informed design choices tailored to specific user experiences.
Putting your evolving design ideas to the test and gauging their effectiveness in the real world.
Usability testing
This is about seeing how real users interact with a design.
In usability testing you observe this process, note where they face difficulties and moments of satisfaction. It's a hands-on way to ensure that the design is intuitive and meets user needs.
Benchmark testing
Benchmark testing is about comparing your design's performance against set standards or competitor products.
Doing this gives a clearer idea of where your design stands in the broader context and highlights areas for improvement or differentiation. With these insights you can make informed decisions to either meet or exceed those benchmarks.
This final stage is about gathering feedback once your design is out in the world, ensuring it stays relevant and effective.
Feedback surveys
After users have interacted with the design for some time, use feedback surveys to gather their thoughts. The results of these surveys will help to ensure that you have your finger on the pulse of user sentiment – enabling iterative improvements.
Remember, simple questions can reveal a lot about what's working and where improvements might be needed.
Focus groups
These are structured, moderator-led discussions with a small group of users . The aim is for the conversation to dive deep into their experiences with the design and extract rich insights – not only capturing what users think but also why.
Start your free 30-day trial of DesignXM® today
Understanding what your market wants before they even know it can set your business apart in a saturated market. That's where DesignXM by Qualtrics® comes in – offering a top-tier platform designed for those who want to lead, not just follow.
Why dive into DesignXM?
- Quick insights: Get to the heart of the matter faster and make informed decisions swiftly
- Cost-effective research: Cut back on outsourced studies and get more bang for your buck, all while ensuring top-notch quality
- Premium quality: Stand shoulder to shoulder with leading brands, using best-in-class research methods
Qualtrics // Experience Management
Qualtrics, the leader and creator of the experience management category, is a cloud-native software platform that empowers organizations to deliver exceptional experiences and build deep relationships with their customers and employees.
With insights from Qualtrics, organizations can identify and resolve the greatest friction points in their business, retain and engage top talent, and bring the right products and services to market. Nearly 20,000 organizations around the world use Qualtrics’ advanced AI to listen, understand, and take action. Qualtrics uses its vast universe of experience data to form the largest database of human sentiment in the world. Qualtrics is co-headquartered in Provo, Utah and Seattle.
Related Articles
December 20, 2023
Top market research analyst skills for 2024
November 7, 2023
Brand Experience
The 4 market research trends redefining insights in 2024
September 14, 2023
How BMG and Loop use data to make critical decisions
August 21, 2023
Designing for safety: Making user consent and trust an organizational asset
June 27, 2023
The fresh insights people: Scaling research at Woolworths Group
June 20, 2023
Bank less, delight more: How Bankwest built an engine room for customer obsession
June 16, 2023
How Qualtrics Helps Three Local Governments Drive Better Outcomes Through Data Insights
April 1, 2023
Academic Experience
How to write great survey questions (with examples)
Stay up to date with the latest xm thought leadership, tips and news., request demo.
Ready to learn more about Qualtrics?
- USC Libraries
- Research Guides
Organizing Your Social Sciences Research Paper
- Types of Research Designs
- Purpose of Guide
- Design Flaws to Avoid
- Independent and Dependent Variables
- Glossary of Research Terms
- Reading Research Effectively
- Narrowing a Topic Idea
- Broadening a Topic Idea
- Extending the Timeliness of a Topic Idea
- Academic Writing Style
- Applying Critical Thinking
- Choosing a Title
- Making an Outline
- Paragraph Development
- Research Process Video Series
- Executive Summary
- The C.A.R.S. Model
- Background Information
- The Research Problem/Question
- Theoretical Framework
- Citation Tracking
- Content Alert Services
- Evaluating Sources
- Primary Sources
- Secondary Sources
- Tiertiary Sources
- Scholarly vs. Popular Publications
- Qualitative Methods
- Quantitative Methods
- Insiderness
- Using Non-Textual Elements
- Limitations of the Study
- Common Grammar Mistakes
- Writing Concisely
- Avoiding Plagiarism
- Footnotes or Endnotes?
- Further Readings
- Generative AI and Writing
- USC Libraries Tutorials and Other Guides
- Bibliography
Introduction
Before beginning your paper, you need to decide how you plan to design the study .
The research design refers to the overall strategy and analytical approach that you have chosen in order to integrate, in a coherent and logical way, the different components of the study, thus ensuring that the research problem will be thoroughly investigated. It constitutes the blueprint for the collection, measurement, and interpretation of information and data. Note that the research problem determines the type of design you choose, not the other way around!
De Vaus, D. A. Research Design in Social Research . London: SAGE, 2001; Trochim, William M.K. Research Methods Knowledge Base. 2006.
General Structure and Writing Style
The function of a research design is to ensure that the evidence obtained enables you to effectively address the research problem logically and as unambiguously as possible . In social sciences research, obtaining information relevant to the research problem generally entails specifying the type of evidence needed to test the underlying assumptions of a theory, to evaluate a program, or to accurately describe and assess meaning related to an observable phenomenon.
With this in mind, a common mistake made by researchers is that they begin their investigations before they have thought critically about what information is required to address the research problem. Without attending to these design issues beforehand, the overall research problem will not be adequately addressed and any conclusions drawn will run the risk of being weak and unconvincing. As a consequence, the overall validity of the study will be undermined.
The length and complexity of describing the research design in your paper can vary considerably, but any well-developed description will achieve the following :
- Identify the research problem clearly and justify its selection, particularly in relation to any valid alternative designs that could have been used,
- Review and synthesize previously published literature associated with the research problem,
- Clearly and explicitly specify hypotheses [i.e., research questions] central to the problem,
- Effectively describe the information and/or data which will be necessary for an adequate testing of the hypotheses and explain how such information and/or data will be obtained, and
- Describe the methods of analysis to be applied to the data in determining whether or not the hypotheses are true or false.
The research design is usually incorporated into the introduction of your paper . You can obtain an overall sense of what to do by reviewing studies that have utilized the same research design [e.g., using a case study approach]. This can help you develop an outline to follow for your own paper.
NOTE: Use the SAGE Research Methods Online and Cases and the SAGE Research Methods Videos databases to search for scholarly resources on how to apply specific research designs and methods . The Research Methods Online database contains links to more than 175,000 pages of SAGE publisher's book, journal, and reference content on quantitative, qualitative, and mixed research methodologies. Also included is a collection of case studies of social research projects that can be used to help you better understand abstract or complex methodological concepts. The Research Methods Videos database contains hours of tutorials, interviews, video case studies, and mini-documentaries covering the entire research process.
Creswell, John W. and J. David Creswell. Research Design: Qualitative, Quantitative, and Mixed Methods Approaches . 5th edition. Thousand Oaks, CA: Sage, 2018; De Vaus, D. A. Research Design in Social Research . London: SAGE, 2001; Gorard, Stephen. Research Design: Creating Robust Approaches for the Social Sciences . Thousand Oaks, CA: Sage, 2013; Leedy, Paul D. and Jeanne Ellis Ormrod. Practical Research: Planning and Design . Tenth edition. Boston, MA: Pearson, 2013; Vogt, W. Paul, Dianna C. Gardner, and Lynne M. Haeffele. When to Use What Research Design . New York: Guilford, 2012.
Action Research Design
Definition and Purpose
The essentials of action research design follow a characteristic cycle whereby initially an exploratory stance is adopted, where an understanding of a problem is developed and plans are made for some form of interventionary strategy. Then the intervention is carried out [the "action" in action research] during which time, pertinent observations are collected in various forms. The new interventional strategies are carried out, and this cyclic process repeats, continuing until a sufficient understanding of [or a valid implementation solution for] the problem is achieved. The protocol is iterative or cyclical in nature and is intended to foster deeper understanding of a given situation, starting with conceptualizing and particularizing the problem and moving through several interventions and evaluations.
What do these studies tell you ?
- This is a collaborative and adaptive research design that lends itself to use in work or community situations.
- Design focuses on pragmatic and solution-driven research outcomes rather than testing theories.
- When practitioners use action research, it has the potential to increase the amount they learn consciously from their experience; the action research cycle can be regarded as a learning cycle.
- Action research studies often have direct and obvious relevance to improving practice and advocating for change.
- There are no hidden controls or preemption of direction by the researcher.
What these studies don't tell you ?
- It is harder to do than conducting conventional research because the researcher takes on responsibilities of advocating for change as well as for researching the topic.
- Action research is much harder to write up because it is less likely that you can use a standard format to report your findings effectively [i.e., data is often in the form of stories or observation].
- Personal over-involvement of the researcher may bias research results.
- The cyclic nature of action research to achieve its twin outcomes of action [e.g. change] and research [e.g. understanding] is time-consuming and complex to conduct.
- Advocating for change usually requires buy-in from study participants.
Coghlan, David and Mary Brydon-Miller. The Sage Encyclopedia of Action Research . Thousand Oaks, CA: Sage, 2014; Efron, Sara Efrat and Ruth Ravid. Action Research in Education: A Practical Guide . New York: Guilford, 2013; Gall, Meredith. Educational Research: An Introduction . Chapter 18, Action Research. 8th ed. Boston, MA: Pearson/Allyn and Bacon, 2007; Gorard, Stephen. Research Design: Creating Robust Approaches for the Social Sciences . Thousand Oaks, CA: Sage, 2013; Kemmis, Stephen and Robin McTaggart. “Participatory Action Research.” In Handbook of Qualitative Research . Norman Denzin and Yvonna S. Lincoln, eds. 2nd ed. (Thousand Oaks, CA: SAGE, 2000), pp. 567-605; McNiff, Jean. Writing and Doing Action Research . London: Sage, 2014; Reason, Peter and Hilary Bradbury. Handbook of Action Research: Participative Inquiry and Practice . Thousand Oaks, CA: SAGE, 2001.
Case Study Design
A case study is an in-depth study of a particular research problem rather than a sweeping statistical survey or comprehensive comparative inquiry. It is often used to narrow down a very broad field of research into one or a few easily researchable examples. The case study research design is also useful for testing whether a specific theory and model actually applies to phenomena in the real world. It is a useful design when not much is known about an issue or phenomenon.
- Approach excels at bringing us to an understanding of a complex issue through detailed contextual analysis of a limited number of events or conditions and their relationships.
- A researcher using a case study design can apply a variety of methodologies and rely on a variety of sources to investigate a research problem.
- Design can extend experience or add strength to what is already known through previous research.
- Social scientists, in particular, make wide use of this research design to examine contemporary real-life situations and provide the basis for the application of concepts and theories and the extension of methodologies.
- The design can provide detailed descriptions of specific and rare cases.
- A single or small number of cases offers little basis for establishing reliability or to generalize the findings to a wider population of people, places, or things.
- Intense exposure to the study of a case may bias a researcher's interpretation of the findings.
- Design does not facilitate assessment of cause and effect relationships.
- Vital information may be missing, making the case hard to interpret.
- The case may not be representative or typical of the larger problem being investigated.
- If the criteria for selecting a case is because it represents a very unusual or unique phenomenon or problem for study, then your interpretation of the findings can only apply to that particular case.
Case Studies. Writing@CSU. Colorado State University; Anastas, Jeane W. Research Design for Social Work and the Human Services . Chapter 4, Flexible Methods: Case Study Design. 2nd ed. New York: Columbia University Press, 1999; Gerring, John. “What Is a Case Study and What Is It Good for?” American Political Science Review 98 (May 2004): 341-354; Greenhalgh, Trisha, editor. Case Study Evaluation: Past, Present and Future Challenges . Bingley, UK: Emerald Group Publishing, 2015; Mills, Albert J. , Gabrielle Durepos, and Eiden Wiebe, editors. Encyclopedia of Case Study Research . Thousand Oaks, CA: SAGE Publications, 2010; Stake, Robert E. The Art of Case Study Research . Thousand Oaks, CA: SAGE, 1995; Yin, Robert K. Case Study Research: Design and Theory . Applied Social Research Methods Series, no. 5. 3rd ed. Thousand Oaks, CA: SAGE, 2003.
Causal Design
Causality studies may be thought of as understanding a phenomenon in terms of conditional statements in the form, “If X, then Y.” This type of research is used to measure what impact a specific change will have on existing norms and assumptions. Most social scientists seek causal explanations that reflect tests of hypotheses. Causal effect (nomothetic perspective) occurs when variation in one phenomenon, an independent variable, leads to or results, on average, in variation in another phenomenon, the dependent variable.
Conditions necessary for determining causality:
- Empirical association -- a valid conclusion is based on finding an association between the independent variable and the dependent variable.
- Appropriate time order -- to conclude that causation was involved, one must see that cases were exposed to variation in the independent variable before variation in the dependent variable.
- Nonspuriousness -- a relationship between two variables that is not due to variation in a third variable.
- Causality research designs assist researchers in understanding why the world works the way it does through the process of proving a causal link between variables and by the process of eliminating other possibilities.
- Replication is possible.
- There is greater confidence the study has internal validity due to the systematic subject selection and equity of groups being compared.
- Not all relationships are causal! The possibility always exists that, by sheer coincidence, two unrelated events appear to be related [e.g., Punxatawney Phil could accurately predict the duration of Winter for five consecutive years but, the fact remains, he's just a big, furry rodent].
- Conclusions about causal relationships are difficult to determine due to a variety of extraneous and confounding variables that exist in a social environment. This means causality can only be inferred, never proven.
- If two variables are correlated, the cause must come before the effect. However, even though two variables might be causally related, it can sometimes be difficult to determine which variable comes first and, therefore, to establish which variable is the actual cause and which is the actual effect.
Beach, Derek and Rasmus Brun Pedersen. Causal Case Study Methods: Foundations and Guidelines for Comparing, Matching, and Tracing . Ann Arbor, MI: University of Michigan Press, 2016; Bachman, Ronet. The Practice of Research in Criminology and Criminal Justice . Chapter 5, Causation and Research Designs. 3rd ed. Thousand Oaks, CA: Pine Forge Press, 2007; Brewer, Ernest W. and Jennifer Kubn. “Causal-Comparative Design.” In Encyclopedia of Research Design . Neil J. Salkind, editor. (Thousand Oaks, CA: Sage, 2010), pp. 125-132; Causal Research Design: Experimentation. Anonymous SlideShare Presentation; Gall, Meredith. Educational Research: An Introduction . Chapter 11, Nonexperimental Research: Correlational Designs. 8th ed. Boston, MA: Pearson/Allyn and Bacon, 2007; Trochim, William M.K. Research Methods Knowledge Base. 2006.
Cohort Design
Often used in the medical sciences, but also found in the applied social sciences, a cohort study generally refers to a study conducted over a period of time involving members of a population which the subject or representative member comes from, and who are united by some commonality or similarity. Using a quantitative framework, a cohort study makes note of statistical occurrence within a specialized subgroup, united by same or similar characteristics that are relevant to the research problem being investigated, rather than studying statistical occurrence within the general population. Using a qualitative framework, cohort studies generally gather data using methods of observation. Cohorts can be either "open" or "closed."
- Open Cohort Studies [dynamic populations, such as the population of Los Angeles] involve a population that is defined just by the state of being a part of the study in question (and being monitored for the outcome). Date of entry and exit from the study is individually defined, therefore, the size of the study population is not constant. In open cohort studies, researchers can only calculate rate based data, such as, incidence rates and variants thereof.
- Closed Cohort Studies [static populations, such as patients entered into a clinical trial] involve participants who enter into the study at one defining point in time and where it is presumed that no new participants can enter the cohort. Given this, the number of study participants remains constant (or can only decrease).
- The use of cohorts is often mandatory because a randomized control study may be unethical. For example, you cannot deliberately expose people to asbestos, you can only study its effects on those who have already been exposed. Research that measures risk factors often relies upon cohort designs.
- Because cohort studies measure potential causes before the outcome has occurred, they can demonstrate that these “causes” preceded the outcome, thereby avoiding the debate as to which is the cause and which is the effect.
- Cohort analysis is highly flexible and can provide insight into effects over time and related to a variety of different types of changes [e.g., social, cultural, political, economic, etc.].
- Either original data or secondary data can be used in this design.
- In cases where a comparative analysis of two cohorts is made [e.g., studying the effects of one group exposed to asbestos and one that has not], a researcher cannot control for all other factors that might differ between the two groups. These factors are known as confounding variables.
- Cohort studies can end up taking a long time to complete if the researcher must wait for the conditions of interest to develop within the group. This also increases the chance that key variables change during the course of the study, potentially impacting the validity of the findings.
- Due to the lack of randominization in the cohort design, its external validity is lower than that of study designs where the researcher randomly assigns participants.
Healy P, Devane D. “Methodological Considerations in Cohort Study Designs.” Nurse Researcher 18 (2011): 32-36; Glenn, Norval D, editor. Cohort Analysis . 2nd edition. Thousand Oaks, CA: Sage, 2005; Levin, Kate Ann. Study Design IV: Cohort Studies. Evidence-Based Dentistry 7 (2003): 51–52; Payne, Geoff. “Cohort Study.” In The SAGE Dictionary of Social Research Methods . Victor Jupp, editor. (Thousand Oaks, CA: Sage, 2006), pp. 31-33; Study Design 101. Himmelfarb Health Sciences Library. George Washington University, November 2011; Cohort Study. Wikipedia.
Cross-Sectional Design
Cross-sectional research designs have three distinctive features: no time dimension; a reliance on existing differences rather than change following intervention; and, groups are selected based on existing differences rather than random allocation. The cross-sectional design can only measure differences between or from among a variety of people, subjects, or phenomena rather than a process of change. As such, researchers using this design can only employ a relatively passive approach to making causal inferences based on findings.
- Cross-sectional studies provide a clear 'snapshot' of the outcome and the characteristics associated with it, at a specific point in time.
- Unlike an experimental design, where there is an active intervention by the researcher to produce and measure change or to create differences, cross-sectional designs focus on studying and drawing inferences from existing differences between people, subjects, or phenomena.
- Entails collecting data at and concerning one point in time. While longitudinal studies involve taking multiple measures over an extended period of time, cross-sectional research is focused on finding relationships between variables at one moment in time.
- Groups identified for study are purposely selected based upon existing differences in the sample rather than seeking random sampling.
- Cross-section studies are capable of using data from a large number of subjects and, unlike observational studies, is not geographically bound.
- Can estimate prevalence of an outcome of interest because the sample is usually taken from the whole population.
- Because cross-sectional designs generally use survey techniques to gather data, they are relatively inexpensive and take up little time to conduct.
- Finding people, subjects, or phenomena to study that are very similar except in one specific variable can be difficult.
- Results are static and time bound and, therefore, give no indication of a sequence of events or reveal historical or temporal contexts.
- Studies cannot be utilized to establish cause and effect relationships.
- This design only provides a snapshot of analysis so there is always the possibility that a study could have differing results if another time-frame had been chosen.
- There is no follow up to the findings.
Bethlehem, Jelke. "7: Cross-sectional Research." In Research Methodology in the Social, Behavioural and Life Sciences . Herman J Adèr and Gideon J Mellenbergh, editors. (London, England: Sage, 1999), pp. 110-43; Bourque, Linda B. “Cross-Sectional Design.” In The SAGE Encyclopedia of Social Science Research Methods . Michael S. Lewis-Beck, Alan Bryman, and Tim Futing Liao. (Thousand Oaks, CA: 2004), pp. 230-231; Hall, John. “Cross-Sectional Survey Design.” In Encyclopedia of Survey Research Methods . Paul J. Lavrakas, ed. (Thousand Oaks, CA: Sage, 2008), pp. 173-174; Helen Barratt, Maria Kirwan. Cross-Sectional Studies: Design Application, Strengths and Weaknesses of Cross-Sectional Studies. Healthknowledge, 2009. Cross-Sectional Study. Wikipedia.
Descriptive Design
Descriptive research designs help provide answers to the questions of who, what, when, where, and how associated with a particular research problem; a descriptive study cannot conclusively ascertain answers to why. Descriptive research is used to obtain information concerning the current status of the phenomena and to describe "what exists" with respect to variables or conditions in a situation.
- The subject is being observed in a completely natural and unchanged natural environment. True experiments, whilst giving analyzable data, often adversely influence the normal behavior of the subject [a.k.a., the Heisenberg effect whereby measurements of certain systems cannot be made without affecting the systems].
- Descriptive research is often used as a pre-cursor to more quantitative research designs with the general overview giving some valuable pointers as to what variables are worth testing quantitatively.
- If the limitations are understood, they can be a useful tool in developing a more focused study.
- Descriptive studies can yield rich data that lead to important recommendations in practice.
- Appoach collects a large amount of data for detailed analysis.
- The results from a descriptive research cannot be used to discover a definitive answer or to disprove a hypothesis.
- Because descriptive designs often utilize observational methods [as opposed to quantitative methods], the results cannot be replicated.
- The descriptive function of research is heavily dependent on instrumentation for measurement and observation.
Anastas, Jeane W. Research Design for Social Work and the Human Services . Chapter 5, Flexible Methods: Descriptive Research. 2nd ed. New York: Columbia University Press, 1999; Given, Lisa M. "Descriptive Research." In Encyclopedia of Measurement and Statistics . Neil J. Salkind and Kristin Rasmussen, editors. (Thousand Oaks, CA: Sage, 2007), pp. 251-254; McNabb, Connie. Descriptive Research Methodologies. Powerpoint Presentation; Shuttleworth, Martyn. Descriptive Research Design, September 26, 2008; Erickson, G. Scott. "Descriptive Research Design." In New Methods of Market Research and Analysis . (Northampton, MA: Edward Elgar Publishing, 2017), pp. 51-77; Sahin, Sagufta, and Jayanta Mete. "A Brief Study on Descriptive Research: Its Nature and Application in Social Science." International Journal of Research and Analysis in Humanities 1 (2021): 11; K. Swatzell and P. Jennings. “Descriptive Research: The Nuts and Bolts.” Journal of the American Academy of Physician Assistants 20 (2007), pp. 55-56; Kane, E. Doing Your Own Research: Basic Descriptive Research in the Social Sciences and Humanities . London: Marion Boyars, 1985.
Experimental Design
A blueprint of the procedure that enables the researcher to maintain control over all factors that may affect the result of an experiment. In doing this, the researcher attempts to determine or predict what may occur. Experimental research is often used where there is time priority in a causal relationship (cause precedes effect), there is consistency in a causal relationship (a cause will always lead to the same effect), and the magnitude of the correlation is great. The classic experimental design specifies an experimental group and a control group. The independent variable is administered to the experimental group and not to the control group, and both groups are measured on the same dependent variable. Subsequent experimental designs have used more groups and more measurements over longer periods. True experiments must have control, randomization, and manipulation.
- Experimental research allows the researcher to control the situation. In so doing, it allows researchers to answer the question, “What causes something to occur?”
- Permits the researcher to identify cause and effect relationships between variables and to distinguish placebo effects from treatment effects.
- Experimental research designs support the ability to limit alternative explanations and to infer direct causal relationships in the study.
- Approach provides the highest level of evidence for single studies.
- The design is artificial, and results may not generalize well to the real world.
- The artificial settings of experiments may alter the behaviors or responses of participants.
- Experimental designs can be costly if special equipment or facilities are needed.
- Some research problems cannot be studied using an experiment because of ethical or technical reasons.
- Difficult to apply ethnographic and other qualitative methods to experimentally designed studies.
Anastas, Jeane W. Research Design for Social Work and the Human Services . Chapter 7, Flexible Methods: Experimental Research. 2nd ed. New York: Columbia University Press, 1999; Chapter 2: Research Design, Experimental Designs. School of Psychology, University of New England, 2000; Chow, Siu L. "Experimental Design." In Encyclopedia of Research Design . Neil J. Salkind, editor. (Thousand Oaks, CA: Sage, 2010), pp. 448-453; "Experimental Design." In Social Research Methods . Nicholas Walliman, editor. (London, England: Sage, 2006), pp, 101-110; Experimental Research. Research Methods by Dummies. Department of Psychology. California State University, Fresno, 2006; Kirk, Roger E. Experimental Design: Procedures for the Behavioral Sciences . 4th edition. Thousand Oaks, CA: Sage, 2013; Trochim, William M.K. Experimental Design. Research Methods Knowledge Base. 2006; Rasool, Shafqat. Experimental Research. Slideshare presentation.
Exploratory Design
An exploratory design is conducted about a research problem when there are few or no earlier studies to refer to or rely upon to predict an outcome . The focus is on gaining insights and familiarity for later investigation or undertaken when research problems are in a preliminary stage of investigation. Exploratory designs are often used to establish an understanding of how best to proceed in studying an issue or what methodology would effectively apply to gathering information about the issue.
The goals of exploratory research are intended to produce the following possible insights:
- Familiarity with basic details, settings, and concerns.
- Well grounded picture of the situation being developed.
- Generation of new ideas and assumptions.
- Development of tentative theories or hypotheses.
- Determination about whether a study is feasible in the future.
- Issues get refined for more systematic investigation and formulation of new research questions.
- Direction for future research and techniques get developed.
- Design is a useful approach for gaining background information on a particular topic.
- Exploratory research is flexible and can address research questions of all types (what, why, how).
- Provides an opportunity to define new terms and clarify existing concepts.
- Exploratory research is often used to generate formal hypotheses and develop more precise research problems.
- In the policy arena or applied to practice, exploratory studies help establish research priorities and where resources should be allocated.
- Exploratory research generally utilizes small sample sizes and, thus, findings are typically not generalizable to the population at large.
- The exploratory nature of the research inhibits an ability to make definitive conclusions about the findings. They provide insight but not definitive conclusions.
- The research process underpinning exploratory studies is flexible but often unstructured, leading to only tentative results that have limited value to decision-makers.
- Design lacks rigorous standards applied to methods of data gathering and analysis because one of the areas for exploration could be to determine what method or methodologies could best fit the research problem.
Cuthill, Michael. “Exploratory Research: Citizen Participation, Local Government, and Sustainable Development in Australia.” Sustainable Development 10 (2002): 79-89; Streb, Christoph K. "Exploratory Case Study." In Encyclopedia of Case Study Research . Albert J. Mills, Gabrielle Durepos and Eiden Wiebe, editors. (Thousand Oaks, CA: Sage, 2010), pp. 372-374; Taylor, P. J., G. Catalano, and D.R.F. Walker. “Exploratory Analysis of the World City Network.” Urban Studies 39 (December 2002): 2377-2394; Exploratory Research. Wikipedia.
Field Research Design
Sometimes referred to as ethnography or participant observation, designs around field research encompass a variety of interpretative procedures [e.g., observation and interviews] rooted in qualitative approaches to studying people individually or in groups while inhabiting their natural environment as opposed to using survey instruments or other forms of impersonal methods of data gathering. Information acquired from observational research takes the form of “ field notes ” that involves documenting what the researcher actually sees and hears while in the field. Findings do not consist of conclusive statements derived from numbers and statistics because field research involves analysis of words and observations of behavior. Conclusions, therefore, are developed from an interpretation of findings that reveal overriding themes, concepts, and ideas. More information can be found HERE .
- Field research is often necessary to fill gaps in understanding the research problem applied to local conditions or to specific groups of people that cannot be ascertained from existing data.
- The research helps contextualize already known information about a research problem, thereby facilitating ways to assess the origins, scope, and scale of a problem and to gage the causes, consequences, and means to resolve an issue based on deliberate interaction with people in their natural inhabited spaces.
- Enables the researcher to corroborate or confirm data by gathering additional information that supports or refutes findings reported in prior studies of the topic.
- Because the researcher in embedded in the field, they are better able to make observations or ask questions that reflect the specific cultural context of the setting being investigated.
- Observing the local reality offers the opportunity to gain new perspectives or obtain unique data that challenges existing theoretical propositions or long-standing assumptions found in the literature.
What these studies don't tell you
- A field research study requires extensive time and resources to carry out the multiple steps involved with preparing for the gathering of information, including for example, examining background information about the study site, obtaining permission to access the study site, and building trust and rapport with subjects.
- Requires a commitment to staying engaged in the field to ensure that you can adequately document events and behaviors as they unfold.
- The unpredictable nature of fieldwork means that researchers can never fully control the process of data gathering. They must maintain a flexible approach to studying the setting because events and circumstances can change quickly or unexpectedly.
- Findings can be difficult to interpret and verify without access to documents and other source materials that help to enhance the credibility of information obtained from the field [i.e., the act of triangulating the data].
- Linking the research problem to the selection of study participants inhabiting their natural environment is critical. However, this specificity limits the ability to generalize findings to different situations or in other contexts or to infer courses of action applied to other settings or groups of people.
- The reporting of findings must take into account how the researcher themselves may have inadvertently affected respondents and their behaviors.
Historical Design
The purpose of a historical research design is to collect, verify, and synthesize evidence from the past to establish facts that defend or refute a hypothesis. It uses secondary sources and a variety of primary documentary evidence, such as, diaries, official records, reports, archives, and non-textual information [maps, pictures, audio and visual recordings]. The limitation is that the sources must be both authentic and valid.
- The historical research design is unobtrusive; the act of research does not affect the results of the study.
- The historical approach is well suited for trend analysis.
- Historical records can add important contextual background required to more fully understand and interpret a research problem.
- There is often no possibility of researcher-subject interaction that could affect the findings.
- Historical sources can be used over and over to study different research problems or to replicate a previous study.
- The ability to fulfill the aims of your research are directly related to the amount and quality of documentation available to understand the research problem.
- Since historical research relies on data from the past, there is no way to manipulate it to control for contemporary contexts.
- Interpreting historical sources can be very time consuming.
- The sources of historical materials must be archived consistently to ensure access. This may especially challenging for digital or online-only sources.
- Original authors bring their own perspectives and biases to the interpretation of past events and these biases are more difficult to ascertain in historical resources.
- Due to the lack of control over external variables, historical research is very weak with regard to the demands of internal validity.
- It is rare that the entirety of historical documentation needed to fully address a research problem is available for interpretation, therefore, gaps need to be acknowledged.
Howell, Martha C. and Walter Prevenier. From Reliable Sources: An Introduction to Historical Methods . Ithaca, NY: Cornell University Press, 2001; Lundy, Karen Saucier. "Historical Research." In The Sage Encyclopedia of Qualitative Research Methods . Lisa M. Given, editor. (Thousand Oaks, CA: Sage, 2008), pp. 396-400; Marius, Richard. and Melvin E. Page. A Short Guide to Writing about History . 9th edition. Boston, MA: Pearson, 2015; Savitt, Ronald. “Historical Research in Marketing.” Journal of Marketing 44 (Autumn, 1980): 52-58; Gall, Meredith. Educational Research: An Introduction . Chapter 16, Historical Research. 8th ed. Boston, MA: Pearson/Allyn and Bacon, 2007.
Longitudinal Design
A longitudinal study follows the same sample over time and makes repeated observations. For example, with longitudinal surveys, the same group of people is interviewed at regular intervals, enabling researchers to track changes over time and to relate them to variables that might explain why the changes occur. Longitudinal research designs describe patterns of change and help establish the direction and magnitude of causal relationships. Measurements are taken on each variable over two or more distinct time periods. This allows the researcher to measure change in variables over time. It is a type of observational study sometimes referred to as a panel study.
- Longitudinal data facilitate the analysis of the duration of a particular phenomenon.
- Enables survey researchers to get close to the kinds of causal explanations usually attainable only with experiments.
- The design permits the measurement of differences or change in a variable from one period to another [i.e., the description of patterns of change over time].
- Longitudinal studies facilitate the prediction of future outcomes based upon earlier factors.
- The data collection method may change over time.
- Maintaining the integrity of the original sample can be difficult over an extended period of time.
- It can be difficult to show more than one variable at a time.
- This design often needs qualitative research data to explain fluctuations in the results.
- A longitudinal research design assumes present trends will continue unchanged.
- It can take a long period of time to gather results.
- There is a need to have a large sample size and accurate sampling to reach representativness.
Anastas, Jeane W. Research Design for Social Work and the Human Services . Chapter 6, Flexible Methods: Relational and Longitudinal Research. 2nd ed. New York: Columbia University Press, 1999; Forgues, Bernard, and Isabelle Vandangeon-Derumez. "Longitudinal Analyses." In Doing Management Research . Raymond-Alain Thiétart and Samantha Wauchope, editors. (London, England: Sage, 2001), pp. 332-351; Kalaian, Sema A. and Rafa M. Kasim. "Longitudinal Studies." In Encyclopedia of Survey Research Methods . Paul J. Lavrakas, ed. (Thousand Oaks, CA: Sage, 2008), pp. 440-441; Menard, Scott, editor. Longitudinal Research . Thousand Oaks, CA: Sage, 2002; Ployhart, Robert E. and Robert J. Vandenberg. "Longitudinal Research: The Theory, Design, and Analysis of Change.” Journal of Management 36 (January 2010): 94-120; Longitudinal Study. Wikipedia.
Meta-Analysis Design
Meta-analysis is an analytical methodology designed to systematically evaluate and summarize the results from a number of individual studies, thereby, increasing the overall sample size and the ability of the researcher to study effects of interest. The purpose is to not simply summarize existing knowledge, but to develop a new understanding of a research problem using synoptic reasoning. The main objectives of meta-analysis include analyzing differences in the results among studies and increasing the precision by which effects are estimated. A well-designed meta-analysis depends upon strict adherence to the criteria used for selecting studies and the availability of information in each study to properly analyze their findings. Lack of information can severely limit the type of analyzes and conclusions that can be reached. In addition, the more dissimilarity there is in the results among individual studies [heterogeneity], the more difficult it is to justify interpretations that govern a valid synopsis of results. A meta-analysis needs to fulfill the following requirements to ensure the validity of your findings:
- Clearly defined description of objectives, including precise definitions of the variables and outcomes that are being evaluated;
- A well-reasoned and well-documented justification for identification and selection of the studies;
- Assessment and explicit acknowledgment of any researcher bias in the identification and selection of those studies;
- Description and evaluation of the degree of heterogeneity among the sample size of studies reviewed; and,
- Justification of the techniques used to evaluate the studies.
- Can be an effective strategy for determining gaps in the literature.
- Provides a means of reviewing research published about a particular topic over an extended period of time and from a variety of sources.
- Is useful in clarifying what policy or programmatic actions can be justified on the basis of analyzing research results from multiple studies.
- Provides a method for overcoming small sample sizes in individual studies that previously may have had little relationship to each other.
- Can be used to generate new hypotheses or highlight research problems for future studies.
- Small violations in defining the criteria used for content analysis can lead to difficult to interpret and/or meaningless findings.
- A large sample size can yield reliable, but not necessarily valid, results.
- A lack of uniformity regarding, for example, the type of literature reviewed, how methods are applied, and how findings are measured within the sample of studies you are analyzing, can make the process of synthesis difficult to perform.
- Depending on the sample size, the process of reviewing and synthesizing multiple studies can be very time consuming.
Beck, Lewis W. "The Synoptic Method." The Journal of Philosophy 36 (1939): 337-345; Cooper, Harris, Larry V. Hedges, and Jeffrey C. Valentine, eds. The Handbook of Research Synthesis and Meta-Analysis . 2nd edition. New York: Russell Sage Foundation, 2009; Guzzo, Richard A., Susan E. Jackson and Raymond A. Katzell. “Meta-Analysis Analysis.” In Research in Organizational Behavior , Volume 9. (Greenwich, CT: JAI Press, 1987), pp 407-442; Lipsey, Mark W. and David B. Wilson. Practical Meta-Analysis . Thousand Oaks, CA: Sage Publications, 2001; Study Design 101. Meta-Analysis. The Himmelfarb Health Sciences Library, George Washington University; Timulak, Ladislav. “Qualitative Meta-Analysis.” In The SAGE Handbook of Qualitative Data Analysis . Uwe Flick, editor. (Los Angeles, CA: Sage, 2013), pp. 481-495; Walker, Esteban, Adrian V. Hernandez, and Micheal W. Kattan. "Meta-Analysis: It's Strengths and Limitations." Cleveland Clinic Journal of Medicine 75 (June 2008): 431-439.
Mixed-Method Design
- Narrative and non-textual information can add meaning to numeric data, while numeric data can add precision to narrative and non-textual information.
- Can utilize existing data while at the same time generating and testing a grounded theory approach to describe and explain the phenomenon under study.
- A broader, more complex research problem can be investigated because the researcher is not constrained by using only one method.
- The strengths of one method can be used to overcome the inherent weaknesses of another method.
- Can provide stronger, more robust evidence to support a conclusion or set of recommendations.
- May generate new knowledge new insights or uncover hidden insights, patterns, or relationships that a single methodological approach might not reveal.
- Produces more complete knowledge and understanding of the research problem that can be used to increase the generalizability of findings applied to theory or practice.
- A researcher must be proficient in understanding how to apply multiple methods to investigating a research problem as well as be proficient in optimizing how to design a study that coherently melds them together.
- Can increase the likelihood of conflicting results or ambiguous findings that inhibit drawing a valid conclusion or setting forth a recommended course of action [e.g., sample interview responses do not support existing statistical data].
- Because the research design can be very complex, reporting the findings requires a well-organized narrative, clear writing style, and precise word choice.
- Design invites collaboration among experts. However, merging different investigative approaches and writing styles requires more attention to the overall research process than studies conducted using only one methodological paradigm.
- Concurrent merging of quantitative and qualitative research requires greater attention to having adequate sample sizes, using comparable samples, and applying a consistent unit of analysis. For sequential designs where one phase of qualitative research builds on the quantitative phase or vice versa, decisions about what results from the first phase to use in the next phase, the choice of samples and estimating reasonable sample sizes for both phases, and the interpretation of results from both phases can be difficult.
- Due to multiple forms of data being collected and analyzed, this design requires extensive time and resources to carry out the multiple steps involved in data gathering and interpretation.
Burch, Patricia and Carolyn J. Heinrich. Mixed Methods for Policy Research and Program Evaluation . Thousand Oaks, CA: Sage, 2016; Creswell, John w. et al. Best Practices for Mixed Methods Research in the Health Sciences . Bethesda, MD: Office of Behavioral and Social Sciences Research, National Institutes of Health, 2010Creswell, John W. Research Design: Qualitative, Quantitative, and Mixed Methods Approaches . 4th edition. Thousand Oaks, CA: Sage Publications, 2014; Domínguez, Silvia, editor. Mixed Methods Social Networks Research . Cambridge, UK: Cambridge University Press, 2014; Hesse-Biber, Sharlene Nagy. Mixed Methods Research: Merging Theory with Practice . New York: Guilford Press, 2010; Niglas, Katrin. “How the Novice Researcher Can Make Sense of Mixed Methods Designs.” International Journal of Multiple Research Approaches 3 (2009): 34-46; Onwuegbuzie, Anthony J. and Nancy L. Leech. “Linking Research Questions to Mixed Methods Data Analysis Procedures.” The Qualitative Report 11 (September 2006): 474-498; Tashakorri, Abbas and John W. Creswell. “The New Era of Mixed Methods.” Journal of Mixed Methods Research 1 (January 2007): 3-7; Zhanga, Wanqing. “Mixed Methods Application in Health Intervention Research: A Multiple Case Study.” International Journal of Multiple Research Approaches 8 (2014): 24-35 .
Observational Design
This type of research design draws a conclusion by comparing subjects against a control group, in cases where the researcher has no control over the experiment. There are two general types of observational designs. In direct observations, people know that you are watching them. Unobtrusive measures involve any method for studying behavior where individuals do not know they are being observed. An observational study allows a useful insight into a phenomenon and avoids the ethical and practical difficulties of setting up a large and cumbersome research project.
- Observational studies are usually flexible and do not necessarily need to be structured around a hypothesis about what you expect to observe [data is emergent rather than pre-existing].
- The researcher is able to collect in-depth information about a particular behavior.
- Can reveal interrelationships among multifaceted dimensions of group interactions.
- You can generalize your results to real life situations.
- Observational research is useful for discovering what variables may be important before applying other methods like experiments.
- Observation research designs account for the complexity of group behaviors.
- Reliability of data is low because seeing behaviors occur over and over again may be a time consuming task and are difficult to replicate.
- In observational research, findings may only reflect a unique sample population and, thus, cannot be generalized to other groups.
- There can be problems with bias as the researcher may only "see what they want to see."
- There is no possibility to determine "cause and effect" relationships since nothing is manipulated.
- Sources or subjects may not all be equally credible.
- Any group that is knowingly studied is altered to some degree by the presence of the researcher, therefore, potentially skewing any data collected.
Atkinson, Paul and Martyn Hammersley. “Ethnography and Participant Observation.” In Handbook of Qualitative Research . Norman K. Denzin and Yvonna S. Lincoln, eds. (Thousand Oaks, CA: Sage, 1994), pp. 248-261; Observational Research. Research Methods by Dummies. Department of Psychology. California State University, Fresno, 2006; Patton Michael Quinn. Qualitiative Research and Evaluation Methods . Chapter 6, Fieldwork Strategies and Observational Methods. 3rd ed. Thousand Oaks, CA: Sage, 2002; Payne, Geoff and Judy Payne. "Observation." In Key Concepts in Social Research . The SAGE Key Concepts series. (London, England: Sage, 2004), pp. 158-162; Rosenbaum, Paul R. Design of Observational Studies . New York: Springer, 2010;Williams, J. Patrick. "Nonparticipant Observation." In The Sage Encyclopedia of Qualitative Research Methods . Lisa M. Given, editor.(Thousand Oaks, CA: Sage, 2008), pp. 562-563.
Philosophical Design
Understood more as an broad approach to examining a research problem than a methodological design, philosophical analysis and argumentation is intended to challenge deeply embedded, often intractable, assumptions underpinning an area of study. This approach uses the tools of argumentation derived from philosophical traditions, concepts, models, and theories to critically explore and challenge, for example, the relevance of logic and evidence in academic debates, to analyze arguments about fundamental issues, or to discuss the root of existing discourse about a research problem. These overarching tools of analysis can be framed in three ways:
- Ontology -- the study that describes the nature of reality; for example, what is real and what is not, what is fundamental and what is derivative?
- Epistemology -- the study that explores the nature of knowledge; for example, by what means does knowledge and understanding depend upon and how can we be certain of what we know?
- Axiology -- the study of values; for example, what values does an individual or group hold and why? How are values related to interest, desire, will, experience, and means-to-end? And, what is the difference between a matter of fact and a matter of value?
- Can provide a basis for applying ethical decision-making to practice.
- Functions as a means of gaining greater self-understanding and self-knowledge about the purposes of research.
- Brings clarity to general guiding practices and principles of an individual or group.
- Philosophy informs methodology.
- Refine concepts and theories that are invoked in relatively unreflective modes of thought and discourse.
- Beyond methodology, philosophy also informs critical thinking about epistemology and the structure of reality (metaphysics).
- Offers clarity and definition to the practical and theoretical uses of terms, concepts, and ideas.
- Limited application to specific research problems [answering the "So What?" question in social science research].
- Analysis can be abstract, argumentative, and limited in its practical application to real-life issues.
- While a philosophical analysis may render problematic that which was once simple or taken-for-granted, the writing can be dense and subject to unnecessary jargon, overstatement, and/or excessive quotation and documentation.
- There are limitations in the use of metaphor as a vehicle of philosophical analysis.
- There can be analytical difficulties in moving from philosophy to advocacy and between abstract thought and application to the phenomenal world.
Burton, Dawn. "Part I, Philosophy of the Social Sciences." In Research Training for Social Scientists . (London, England: Sage, 2000), pp. 1-5; Chapter 4, Research Methodology and Design. Unisa Institutional Repository (UnisaIR), University of South Africa; Jarvie, Ian C., and Jesús Zamora-Bonilla, editors. The SAGE Handbook of the Philosophy of Social Sciences . London: Sage, 2011; Labaree, Robert V. and Ross Scimeca. “The Philosophical Problem of Truth in Librarianship.” The Library Quarterly 78 (January 2008): 43-70; Maykut, Pamela S. Beginning Qualitative Research: A Philosophic and Practical Guide . Washington, DC: Falmer Press, 1994; McLaughlin, Hugh. "The Philosophy of Social Research." In Understanding Social Work Research . 2nd edition. (London: SAGE Publications Ltd., 2012), pp. 24-47; Stanford Encyclopedia of Philosophy . Metaphysics Research Lab, CSLI, Stanford University, 2013.
Sequential Design
- The researcher has a limitless option when it comes to sample size and the sampling schedule.
- Due to the repetitive nature of this research design, minor changes and adjustments can be done during the initial parts of the study to correct and hone the research method.
- This is a useful design for exploratory studies.
- There is very little effort on the part of the researcher when performing this technique. It is generally not expensive, time consuming, or workforce intensive.
- Because the study is conducted serially, the results of one sample are known before the next sample is taken and analyzed. This provides opportunities for continuous improvement of sampling and methods of analysis.
- The sampling method is not representative of the entire population. The only possibility of approaching representativeness is when the researcher chooses to use a very large sample size significant enough to represent a significant portion of the entire population. In this case, moving on to study a second or more specific sample can be difficult.
- The design cannot be used to create conclusions and interpretations that pertain to an entire population because the sampling technique is not randomized. Generalizability from findings is, therefore, limited.
- Difficult to account for and interpret variation from one sample to another over time, particularly when using qualitative methods of data collection.
Betensky, Rebecca. Harvard University, Course Lecture Note slides; Bovaird, James A. and Kevin A. Kupzyk. "Sequential Design." In Encyclopedia of Research Design . Neil J. Salkind, editor. (Thousand Oaks, CA: Sage, 2010), pp. 1347-1352; Cresswell, John W. Et al. “Advanced Mixed-Methods Research Designs.” In Handbook of Mixed Methods in Social and Behavioral Research . Abbas Tashakkori and Charles Teddle, eds. (Thousand Oaks, CA: Sage, 2003), pp. 209-240; Henry, Gary T. "Sequential Sampling." In The SAGE Encyclopedia of Social Science Research Methods . Michael S. Lewis-Beck, Alan Bryman and Tim Futing Liao, editors. (Thousand Oaks, CA: Sage, 2004), pp. 1027-1028; Nataliya V. Ivankova. “Using Mixed-Methods Sequential Explanatory Design: From Theory to Practice.” Field Methods 18 (February 2006): 3-20; Bovaird, James A. and Kevin A. Kupzyk. “Sequential Design.” In Encyclopedia of Research Design . Neil J. Salkind, ed. Thousand Oaks, CA: Sage, 2010; Sequential Analysis. Wikipedia.
Systematic Review
- A systematic review synthesizes the findings of multiple studies related to each other by incorporating strategies of analysis and interpretation intended to reduce biases and random errors.
- The application of critical exploration, evaluation, and synthesis methods separates insignificant, unsound, or redundant research from the most salient and relevant studies worthy of reflection.
- They can be use to identify, justify, and refine hypotheses, recognize and avoid hidden problems in prior studies, and explain data inconsistencies and conflicts in data.
- Systematic reviews can be used to help policy makers formulate evidence-based guidelines and regulations.
- The use of strict, explicit, and pre-determined methods of synthesis, when applied appropriately, provide reliable estimates about the effects of interventions, evaluations, and effects related to the overarching research problem investigated by each study under review.
- Systematic reviews illuminate where knowledge or thorough understanding of a research problem is lacking and, therefore, can then be used to guide future research.
- The accepted inclusion of unpublished studies [i.e., grey literature] ensures the broadest possible way to analyze and interpret research on a topic.
- Results of the synthesis can be generalized and the findings extrapolated into the general population with more validity than most other types of studies .
- Systematic reviews do not create new knowledge per se; they are a method for synthesizing existing studies about a research problem in order to gain new insights and determine gaps in the literature.
- The way researchers have carried out their investigations [e.g., the period of time covered, number of participants, sources of data analyzed, etc.] can make it difficult to effectively synthesize studies.
- The inclusion of unpublished studies can introduce bias into the review because they may not have undergone a rigorous peer-review process prior to publication. Examples may include conference presentations or proceedings, publications from government agencies, white papers, working papers, and internal documents from organizations, and doctoral dissertations and Master's theses.
Denyer, David and David Tranfield. "Producing a Systematic Review." In The Sage Handbook of Organizational Research Methods . David A. Buchanan and Alan Bryman, editors. ( Thousand Oaks, CA: Sage Publications, 2009), pp. 671-689; Foster, Margaret J. and Sarah T. Jewell, editors. Assembling the Pieces of a Systematic Review: A Guide for Librarians . Lanham, MD: Rowman and Littlefield, 2017; Gough, David, Sandy Oliver, James Thomas, editors. Introduction to Systematic Reviews . 2nd edition. Los Angeles, CA: Sage Publications, 2017; Gopalakrishnan, S. and P. Ganeshkumar. “Systematic Reviews and Meta-analysis: Understanding the Best Evidence in Primary Healthcare.” Journal of Family Medicine and Primary Care 2 (2013): 9-14; Gough, David, James Thomas, and Sandy Oliver. "Clarifying Differences between Review Designs and Methods." Systematic Reviews 1 (2012): 1-9; Khan, Khalid S., Regina Kunz, Jos Kleijnen, and Gerd Antes. “Five Steps to Conducting a Systematic Review.” Journal of the Royal Society of Medicine 96 (2003): 118-121; Mulrow, C. D. “Systematic Reviews: Rationale for Systematic Reviews.” BMJ 309:597 (September 1994); O'Dwyer, Linda C., and Q. Eileen Wafford. "Addressing Challenges with Systematic Review Teams through Effective Communication: A Case Report." Journal of the Medical Library Association 109 (October 2021): 643-647; Okoli, Chitu, and Kira Schabram. "A Guide to Conducting a Systematic Literature Review of Information Systems Research." Sprouts: Working Papers on Information Systems 10 (2010); Siddaway, Andy P., Alex M. Wood, and Larry V. Hedges. "How to Do a Systematic Review: A Best Practice Guide for Conducting and Reporting Narrative Reviews, Meta-analyses, and Meta-syntheses." Annual Review of Psychology 70 (2019): 747-770; Torgerson, Carole J. “Publication Bias: The Achilles’ Heel of Systematic Reviews?” British Journal of Educational Studies 54 (March 2006): 89-102; Torgerson, Carole. Systematic Reviews . New York: Continuum, 2003.
- << Previous: Purpose of Guide
- Next: Design Flaws to Avoid >>
- Last Updated: May 30, 2024 9:38 AM
- URL: https://libguides.usc.edu/writingguide
- Company Directory
- Terms of Use
- Privacy Policy
- Sign In / Join Now
A Guide to Design Research Tools
Technology can be a great help when it comes to organizing your research on an ongoing project or in new product development. If you're looking for better ways to get organized, the platforms, apps and guides listed here can help you get there.
Created by:
- Expert Picks

"Universal Methods of Design" by Bella Martin & Bruce Hanington
Universal Methods of Design is an outstanding compilation of 100 different research methods compiled in alphabetical order. It makes research methods so easy to follow and a great recourse to comeback to time and again.

Otter.ai- Voice Meeting Notes
Otter is a simple way to transcribe speech to text. It uses machine learning and artificial intelligence to give you an accurate script of long speeches and interviews that saves you so much time.

Another Lens - A research tool for conscientious creatives
How can you design for everyone without understanding the full picture? To help examine how bias influences our worldview, Airbnb Design partnered with News Deeply, a journalism startup dedicated to providing in-depth coverage of the world’s most critical challenges. The end result was the Shadow to Light installation, an experience that pressed us to recognize our biases and grapple with our limitations. While this tool was made primarily for designers, we believe all creatives can apply aspects of it to their work. Next time you find yourself brainstorming, building, or polishing—we invite you to take a moment to challenge your reasoning. Together we can diminish the effects of bias within the creative process.

Miro provides an organized space to virtually brainstorm and share your work in realtime with your team. It gives you the freedom to organize your data just as you would in your own space. Use cases for Miro include meetings and presentations (their video feature allows for face-to-face interactions), brainstorming and ideation, strategy and research, mind mapping, product management, and more. Miro is also seamlessly integrated with other apps like Google Drive so you never have to leave the platform to find what you need.

Wordclouds is a great visual tool to add to your research. It helps analyze your text and create a word cloud with the most used words from your text. Wordcloud also gives you plenty of options to edit and personalize it to your specific needs.

Purdue Online Writing Lab
The Purdue OWL is an online resource to help perfect all your writing. It provides great guidelines for everything from general writing tips to citation and research resources.

- m Sign In with Twitter
- U Sign In with Linkedin
- j Sign In with Core77 Account
- Email or Username
- Password Forgot password?
- Keep me signed in
Don't have an account? Join Now
Create a Core77 Account
- Y Join Now with Facebook
- m Join Now with Twitter
- U Join Now with Linkedin
- j Join Now with Email
- Email Not Public
- Confirm Password
Already have an account? Sign In
By creating a Core77 account you confirm that you accept the Terms of Use
Reset Password
Please enter your email and we will send an email to reset your password.
Join over 240,000 designers who stay up-to-date with the Core77 newsletter.
Test it out; it only takes a single click to unsubscribe
- Victor Yocco
- Jun 5, 2024
Presenting UX Research And Design To Stakeholders: The Power Of Persuasion
- 25 min read
- UX Research , Communication , UX
- Share on Twitter , LinkedIn
About The Author
Victor Yocco, PhD, has over a decade of experience as a UX researcher and research director. He is currently affiliated with Allelo Design and is taking on … More about Victor ↬
Email Newsletter
Weekly tips on front-end & UX . Trusted by 200,000+ folks.
For UX researchers and designers, our journey doesn’t end with meticulously gathered data or well-crafted design concepts saved on our laptops or in the cloud. Our true impact lies in effectively communicating research findings and design concepts to key stakeholders and securing their buy-in for implementing our user-centered solutions. This is where persuasion and communication theory become powerful tools, empowering UX practitioners to bridge the gap between research and action .
I shared a framework for conducting UX research in my previous article on infusing communication theory and UX. In this article, I’ll focus on communication and persuasion considerations for presenting our research and design concepts to key stakeholder groups.
A Word On Persuasion: Guiding Understanding, Not Manipulation
UX professionals can strategically use persuasion techniques to turn complex research results into clear, practical recommendations that stakeholders can understand and act on. It’s crucial to remember that persuasion is about helping people understand what to do, not tricking them . When stakeholders see the value of designing with the user in mind, they become strong partners in creating products and services that truly meet user needs. We’re not trying to manipulate anyone; we’re trying to make sure our ideas get the attention they deserve in a busy world.
The Hovland-Yale Model Of Persuasion
The Hovland-Yale model, a framework for understanding how persuasion works, was developed by Carl Hovland and his team at Yale University in the 1950s. Their research was inspired by World War II propaganda, as they wanted to figure out what made some messages more convincing than others.
In the Hovland-Yale model, persuasion is understood as a process involving the Independent variables of Source, Message, and Audience . The elements of each factor then lead to the Audience having internal mediating processes around the topic, which, if independent variables are strong enough, can strengthen or change attitudes or behaviors. The interplay of the internal mediating processes leads to persuasion or not, which then leads to the observable effect of the communication (or not, if the message is ineffective). The model proposes that if these elements are carefully crafted and applied, the intended change in attitude or behavior (Effect) is more likely to be successful.
The diagram below helps identify the parts of persuasive communication. It shows what you can control as a presenter, how people think about the message and the impact it has. If done well, it can lead to change. I’ll focus exclusively on the independent variables in the far left side of the diagram in this article because, theoretically, this is what you, as the outside source creating a persuasive message, are in control of and, if done well, would lead to the appropriate mediating processes and desired observable effects.
Effective communication can reinforce currently held positions. You don’t always need to change minds when presenting research; much of what we find and present might align with currently held beliefs and support actions our stakeholders are already considering.
Over the years, researchers have explored the usefulness and limitations of this model in various contexts. I’ve provided a list of citations at the end of this article if you are interested in exploring academic literature on the Hovland-Yale model. Reflecting on some of the research findings can help shape how we create and deliver our persuasive communication. Some consistent from academia highlight that:
- Source credibility significantly influences the acceptance of a persuasive message. A high-credibility source is more persuasive than a low-credibility one.
- Messages that are logically structured, clear, and relatively concise are more likely to be persuasive.
- An audience’s attitude change is also dependent on the channel of communication. Mass media is found to be less effective in changing attitudes than face-to-face communication.
- The audience’s initial attitude, intelligence, and self-esteem have a significant role in the persuasion process. Research suggests that individuals with high intelligence are typically more resistant to persuasion efforts, and those with moderate self-esteem are easier to persuade than those with low or high self-esteem.
- The effect of persuasive messages tends to fade over time, especially if delivered by a non-credible source. This suggests a need to reinforce even effective messages on a regular basis to maintain an effect.
I’ll cover the impact of each of these bullets on UX research and design presentations in the relevant sections below.
It’s important to note that while the Hovland-Yale model provides valuable insight into persuasive communication, it remains a simplification of a complex process. Actual attitude change and decision-making can be influenced by a multitude of other factors not covered in this model, like emotional states, group dynamics, and more, necessitating a multi-faceted approach to persuasion. However, the model provides a manageable framework to strengthen the communication of UX research findings , with a focus on elements that are within the control of the researcher and product team. I’ll break down the process of presenting findings to various audiences in the following section.
Let’s move into applying the models to our work as UX practitioners with a focus on how the model applies to how we prepare and present our findings to various stakeholders. You can reference the diagram above as needed as we move through the Independent variables.
Applying The Hovland-Yale Model To Presenting Your UX Research Findings
Let’s break down the key parts of the Hovland-Yale model and see how we can use them when presenting our UX research and design ideas.
Revised: The Hovland-Yale model stresses that where a message comes from greatly affects how believable and effective it is. Research shows that a convincing source needs to be seen as dependable , informed , and trustworthy . In UX research, this source is usually the researcher(s) and other UX team members who present findings, suggest actions, lead workshops, and share design ideas. It’s crucial for the UX team to build trust with their audience, which often includes users, stakeholders, and designers.
You can demonstrate and strengthen your credibility throughout the research process and once again when presenting your findings.
How Can You Make Yourself More Credible?
You should start building your expertise and credibility before you even finish your research. Often, stakeholders will have already formed an opinion about your work before you even walk into the room. Here are a couple of ways to boost your reputation before or at the beginning of a project:
Case Studies
A well-written case study about your past work can be a great way to show stakeholders the benefits of user-centered design. Make sure your case studies match what your stakeholders care about. Don’t just tell an interesting story; tell a story that matters to them. Understand their priorities and tailor your case study to show how your UX work has helped achieve goals like higher ROI, happier customers, or lower turnover. Share these case studies as a document before the project starts so stakeholders can review them and get a positive impression of your work.
Thought Leadership
Sharing insights and expertise that your UX team has developed is another way to build credibility. This kind of “thought leadership” can establish your team as the experts in your field. It can take many forms, like blog posts, articles in industry publications, white papers, presentations, podcasts, or videos. You can share this content on your website, social media, or directly with stakeholders.
For example, if you’re about to start a project on gathering customer feedback, share any relevant articles or guides your team has created with your stakeholders before the project kickoff. If you are about to start developing a voice of the customer program and you happen to have Victor or Dana on your team, share their article on creating a VoC to your group of stakeholders prior to the kickoff meeting. [Shameless self-promotion and a big smile emoji].
You can also build credibility and trust while discussing your research and design, both during the project and when you present your final results.
Business Goals Alignment
To really connect with stakeholders, make sure your UX goals and the company’s business goals work together. Always tie your research findings and design ideas back to the bigger picture. This means showing how your work can affect things like customer happiness, more sales, lower costs, or other important business measures. You can even work with stakeholders to figure out which measures matter most to them. When you present your designs, point out how they’ll help the company reach its goals through good UX.
Industry Benchmarks
These days, it’s easier to find data on how other companies in your industry are doing. Use this to your advantage! Compare your findings to these benchmarks or even to your competitors. This can help stakeholders feel more confident in your work. Show them how your research fits in with industry trends or how it uncovers new ways to stand out. When you talk about your designs, highlight how you’ve used industry best practices or made changes based on what you’ve learned from users.
Methodological Transparency
Be open and honest about how you did your research. This shows you know what you’re doing and that you can be trusted. For example, if you were looking into why fewer people are renewing their subscriptions to a fitness app, explain how you planned your research, who you talked to, how you analyzed the data, and any challenges you faced. This transparency helps people accept your research results and builds trust.
Increasing Credibility Through Design Concepts
Here are some specific ways to make your design concepts more believable and trustworthy to stakeholders:
Ground Yourself in Research. You’ve done the research, so use it! Make sure your design decisions are based on your findings and user data. When you present, highlight the data that supports your choices.
Go Beyond Mockups. It’s helpful for stakeholders to see your designs in action. Static mockups are a good start, but try creating interactive prototypes that show how users will move through and use your design. This is especially important if you’re creating something new that stakeholders might have trouble visualizing.
User Quotes and Testimonials. Include quotes or stories from users in your presentation. This makes the process more personal and shows that you’re focused on user needs. You can use these quotes to explain specific design choices.
Before & After Impact. Use visuals or user journey maps to show how your design solution improves the user experience. If you’ve mapped out the current user journey or documented existing problems, show how your new design fixes those problems. Don’t leave stakeholders guessing about your design choices. Briefly explain why you made key decisions and how they help users or achieve business goals. You should have research and stakeholder input to back up your decisions.
Show Your Process. When presenting a more developed concept, show the work that led up to it. Don’t just share the final product. Include early sketches, wireframes, or simple prototypes to show how the design evolved and the reasoning behind your choices. This is especially helpful for executives or stakeholders who haven’t been involved in the whole process.
Be Open to Feedback and Iteration. Work together with stakeholders. Show that you’re open to their feedback and explain how their input can help you improve your designs.
Much of what I’ve covered above are also general best practices for presenting. Remember, these are just suggestions. You don’t have to use every single one to make your presentations more persuasive. Try different things, see what works best for you and your stakeholders, and have fun with it! The goal is to build trust and credibility with your UX team.
The Hovland-Yale model, along with most other communication models, suggests that what you communicate is just as important as how you communicate it. In UX research, your message is usually your insights, data analysis, findings, and recommendations.
I’ve touched on this in the previous section because it’s hard to separate the source (who’s talking) from the message (what they’re saying). For example, building trust involves being transparent about your research methods, which is part of your message. So, some of what I’m about to say might sound familiar.
For this article, let’s define the message as your research findings and everything that goes with them (e.g., what you say in your presentation, the slides you use, other media), as well as your design concepts (how you show your design solutions, including drawings, wireframes, prototypes, and so on).
The Hovland-Yale model says it’s important to make your message easy to understand , relevant , and impactful . For example, instead of just saying,
“30% of users found the signup process difficult.”
you could say,
“30% of users struggled to sign up because the process was too complicated. This could lead to fewer renewals. Making the signup process easier could increase renewals and improve the overall experience.”
Storytelling is also a powerful way to get your message across. Weaving your findings into a narrative helps people connect with your data on a human level and remember your key points. Using real quotes or stories from users makes your presentation even more compelling.
Here are some other tips for delivering a persuasive message:
- Practice Makes Perfect Rehearse your presentation. This will help you smooth out any rough spots, anticipate questions, and feel more confident.
- Anticipate Concerns Think about any objections stakeholders might have and be ready to address them with data.
- Welcome Feedback Encourage open discussion during your presentation. Listen to what stakeholders have to say and show that you’re willing to adapt your recommendations based on their concerns. This builds trust and makes everyone feel like they’re part of the process.
- Follow Through is Key After your presentation, send a clear summary of the main points and action items. This shows you’re professional and makes it easy for stakeholders to refer back to your findings.
When presenting design concepts, it’s important to tell , not just show, what you’re proposing. Stakeholders might not have a deep understanding of UX, so just showing them screenshots might not be enough. Use user stories to walk them through the redesigned experience. This helps them understand how users will interact with your design and what benefits it will bring. Static screens show the “what,” but user stories reveal the “why” and “how.” By focusing on the user journey, you can demonstrate how your design solves problems and improves the overall experience.
For example, if you’re suggesting changes to the search bar and adding tooltips, you could say:
“Imagine a user lands on the homepage and sees the new, larger search bar. They enter their search term and get results. If they see an unfamiliar tool or a new action, they can hover over it to see a brief description.”
Here are some other ways to make your design concepts clearer and more persuasive:
- Clear Design Language Use a consistent and visually appealing design language in your mockups and prototypes. This shows professionalism and attention to detail.
- Accessibility Best Practices Make sure your design is accessible to everyone. This shows that you care about inclusivity and user-centered design.
One final note on the message is that research has found the likelihood of an audience’s attitude change is also dependent on the channel of communication . Mass media is found to be less effective in changing attitudes than face-to-face communication. Distributed teams and remote employees can employ several strategies to compensate for any potential impact reduction of asynchronous communication:
- Interactive Elements Incorporate interactive elements into presentations, such as polls, quizzes, or clickable prototypes. This can increase engagement and make the experience more dynamic for remote viewers.
- Video Summaries Create short video summaries of key findings and recommendations. This adds a personal touch and can help convey nuances that might be lost in text or static slides.
- Virtual Q&A Sessions Schedule dedicated virtual Q&A sessions where stakeholders can ask questions and engage in discussions. This allows for real-time interaction and clarification, mimicking the benefits of face-to-face communication.
- Follow-up Communication Actively follow up with stakeholders after they’ve reviewed the materials. Offer to discuss the content, answer questions, and gather feedback. This demonstrates a commitment to communication and can help solidify key takeaways.
Framing Your Message for Maximum Impact
The way you frame an issue can greatly influence how stakeholders see it. Framing is a persuasion technique that can help your message resonate more deeply with specific stakeholders. Essentially, you want to frame your message in a way that aligns with your stakeholders’ attitudes and values and presents your solution as the next logical step. There are many resources on how to frame messages, as this technique has been used often in public safety and public health research to encourage behavior change. This article discusses applying framing techniques for digital design.
You can also frame issues in a way that motivates your stakeholders. For example, instead of calling usability issues “problems,” I like to call them “opportunities.” This emphasizes the potential for improvement. Let’s say your research on a hospital website finds that the appointment booking process is confusing. You could frame this as an opportunity to improve patient satisfaction and maybe even reduce call center volume by creating a simpler online booking system. This way, your solution is a win-win for both patients and the hospital. Highlighting the positive outcomes of your proposed changes and using language that focuses on business benefits and user satisfaction can make a big difference.
Understanding your audience’s goals is essential before embarking on any research or design project. It serves as the foundation for tailoring content, supporting decision-making processes, ensuring clarity and focus, enhancing communication effectiveness, and establishing metrics for evaluation.
One specific aspect to consider is securing buy-in from the product and delivery teams prior to beginning any research or design. Without their investment in the outcomes and input on the process, it can be challenging to find stakeholders who see value in a project you created in a vacuum. Engaging with these teams early on helps align expectations, foster collaboration, and ensure that the research and design efforts are informed by the organization’s objectives.
Once you’ve identified your key stakeholders and secured buy-in, you should then Map the Decision-Making Process or understand the decision-making process your audience goes through, including the pain points, considerations, and influencing factors.
- How are decisions made, and who makes them?
- Is it group consensus?
- Are there key voices that overrule all others?
- Is there even a decision to be made in regard to the work you will do?
Understanding the decision-making process will enable you to provide the necessary information and support at each stage.
Finally, prior to engaging in any work, set clear objectives with your key stakeholders . Your UX team needs to collaborate with the product and delivery teams to establish clear objectives for the research or design project. These objectives should align with the organization’s goals and the audience’s needs.
By understanding your audience’s goals and involving the product and delivery teams from the outset, you can create research and design outcomes that are relevant, impactful, and aligned with the organization’s objectives.
As the source of your message, it’s your job to understand who you’re talking to and how they see the issue. Different stakeholders have different interests, goals, and levels of knowledge. It’s important to tailor your communication to each of these perspectives. Adjust your language, what you emphasize, and the complexity of your message to suit your audience. Technical jargon might be fine for technical stakeholders, but it could alienate those without a technical background.
Audience Characteristics: Know Your Stakeholders
Remember, your audience’s existing opinions, intelligence, and self-esteem play a big role in how persuasive you can be. Research suggests that people with higher intelligence tend to be more resistant to persuasion, while those with moderate self-esteem are easier to persuade than those with very low or very high self-esteem. Understanding your audience is key to giving a persuasive presentation of your UX research and design concepts. Tailoring your communication to address the specific concerns and interests of your stakeholders can significantly increase the impact of your findings.
To truly know your audience, you need information about who you’ll be presenting to, and the more you know, the better. At the very least, you should identify the different groups of stakeholders in your audience. This could include designers, developers, product managers, and executives. If possible, try to learn more about your key stakeholders. You could interview them at the beginning of your process, or you could give them a short survey to gauge their attitudes and behaviors toward the area your UX team is exploring.
Then, your UX team needs to decide the following:
- How can you best keep all stakeholders engaged and informed as the project unfolds?
- How will your presentation or concepts appeal to different interests and roles?
- How can you best encourage discussion and decision-making with the different stakeholders present?
- Should you hold separate presentations because of the wide range of stakeholders you need to share your findings with?
- How will you prioritize information?
Your answers to the previous questions will help you focus on what matters most to each stakeholder group. For example, designers might be more interested in usability issues, while executives might care more about the business impact. If you’re presenting to a mixed audience, include a mix of information and be ready to highlight what’s relevant to each group in a way that grabs their attention. Adapt your communication style to match each group’s preferences. Provide technical details for developers and emphasize user experience benefits for executives.
Let’s say you did UX research for a mobile banking app, and your audience includes designers, developers, and product managers.
- Focus on: Design-related findings like what users prefer in the interface, navigation problems, and suggestions for the visual design.
- How to communicate: Use visuals like heatmaps and user journey maps to show design challenges. Talk about how fixing these issues can make the overall user experience better.
Developers:
- Focus on: Technical stuff, like performance problems, bugs, or challenges with building the app.
- How to communicate: Share code snippets or technical details about the problems you found. Discuss possible solutions that the developers can actually build. Be realistic about how much work it will take and be ready to talk about a “minimum viable product” (MVP).
Product Managers:
- Focus on: Findings that affect how users engage with the app, how long they keep using it, and the overall business goals.
- How to communicate: Use numbers and data to show how UX improvements can help the business. Explain how the research and your ideas fit into the product roadmap and long-term strategy.
By tailoring your presentation to each group, you make sure your message really hits home. This makes it more likely that they’ll support your UX research findings and work together to make decisions. “
The Effect (Impact)
The end goal of presenting your findings and design concepts is to get key stakeholders to take action based on what you learned from users. Make sure the impact of your research is crystal clear. Talk about how your findings relate to business goals, customer happiness, and market success (if those are relevant to your product). Suggest clear, actionable next steps in the form of design concepts and encourage feedback and collaboration from stakeholders . This builds excitement and gets people invested. Make sure to answer any questions and ask for more feedback to show that you value their input. Remember, stakeholders play a big role in the product’s future, so getting them involved increases the value of your research.
The Call to Action (CTA)
Your audience needs to know what you want them to do. End your presentation with a strong call to action (CTA). But to do this well, you need to be clear on what you want them to do and understand any limitations they might have.
For example, if you’re presenting to the CEO, tailor your CTA to their priorities. Focus on the return on investment (ROI) of user-centered design. Show how your recommendations can increase sales, improve customer satisfaction, or give the company a competitive edge. Use clear visuals and explain how user needs translate into business benefits. End with a strong, action-oriented statement, like
“Let’s set up a meeting to discuss how we can implement these user-centered design recommendations to reach your strategic goals.”
If you’re presenting to product managers and business unit leaders, focus on the business goals they care about, like increasing revenue or reducing customer churn. Explain your research findings in terms of ROI. For example, a strong CTA could be:
“Let’s try out the redesigned checkout process and aim for a 10% increase in conversion rates next quarter.”
Remember, the effects of persuasive messages can fade over time , especially if the source isn’t seen as credible. This means you need to keep reinforcing your message to maintain its impact.
Understanding Limitations and Addressing Concerns
Persuasion is about guiding understanding, not tricking people. Be upfront about any limitations your audience might have , like budget constraints or limited development resources. Anticipate their concerns and address them in your CTA. For example, you could say,
“I know implementing the entire redesign might need more resources, so let’s prioritize the high-impact changes we found in our research to improve the checkout process within our current budget.”
By considering both your desired outcome and your audience’s perspective, you can create a clear, compelling, and actionable CTA that resonates with stakeholders and drives user-centered design decisions.
Finally, remember that presenting your research findings and design concepts isn’t the end of the road . The effects of persuasive messages can fade over time. Your team should keep looking for ways to reinforce key messages and decisions as you move forward with implementing solutions. Keep your presentations and concepts in a shared folder, remind people of the reasoning behind decisions, and be flexible if there are multiple ways to achieve the desired outcome. Showing how you’ve addressed stakeholder goals and concerns in your solution will go a long way in maintaining credibility and trust for future projects.
A Tool to Track Your Alignment to the Hovland-Yale Model
You and your UX team are likely already incorporating elements of persuasion into your work. It might be helpful to track how you are doing this to reflect on what works, what doesn’t, and where there are gaps. I’ve provided a spreadsheet in Figure 3 below for you to modify and use as you might see fit. I’ve included sample data to provide an example of what type of information you might want to record. You can set up the structure of a spreadsheet like this as you think about kicking off your next project, or you can fill it in with information from a recently completed project and reflect on what you can incorporate more in the future.
Please use the spreadsheet below as a suggestion and make additions, deletions, or changes as best suited to meet your needs. You don’t need to be dogmatic in adhering to what I’ve covered here. Experiment, find what works best for you, and have fun.
Figure 3: Example of spreadsheet categories to track the application of the Hovland-Yale model to your presentation of UX Research findings.
Foundational Works
- Hovland, C. I., Janis, I. L., & Kelley, H. H. (1953). Communication and persuasion. New Haven, CT: Yale University Press. (The cornerstone text on the Hovland-Yale model).
- Weiner, B. J., & Hovland, C. I. (1956). Participating vs. nonparticipating persuasive presentations: A further study of the effects of audience participation. Journal of Abnormal and Social Psychology, 52(2), 105-110. (Examines the impact of audience participation in persuasive communication).
- Kelley, H. H., & Hovland, C. I. (1958). The communication of persuasive content. Psychological Review, 65(4), 314-320. (Delves into the communication of persuasive messages and their effects).
Contemporary Applications
- Pfau, M., & Dalton, M. J. (2008). The persuasive effects of fear appeals and positive emotion appeals on risky sexual behavior intentions. Journal of Communication, 58(2), 244-265. (Applies the Hovland-Yale model to study the effectiveness of fear appeals).
- Chen, G., & Sun, J. (2010). The effects of source credibility and message framing on consumer online health information seeking. Journal of Interactive Advertising, 10(2), 75-88. (Analyzes the impact of source credibility and message framing, concepts within the model, on health information seeking).
- Hornik, R., & McHale, J. L. (2009). The persuasive effects of emotional appeals: A meta-analysis of research on advertising emotions and consumer behavior. Journal of Consumer Psychology, 19(3), 394-403. (Analyzes the role of emotions in persuasion, a key aspect of the model, in advertising).
Smashing Newsletter
Tips on front-end & UX, delivered weekly in your inbox. Just the things you can actually use.
Front-End & UX Workshops, Online
With practical takeaways, live sessions, video recordings and a friendly Q&A.
TypeScript in 50 Lessons
Everything TypeScript, with code walkthroughs and examples. And other printed books.
- Quick Order
- Discovery & Translational Research
- Diagnostics & Clinical Research
- Human ID & Forensics
- Next-Generation Sequencing
- Instruments & Automation
- Informatics & Data
- OEM by QIAGEN
- Top Sellers
- DNA & RNA Purification
- Protein Purification
- Exosomes & CTCs
- Sample Collection & Stabilization
- PCR/qPCR/dPCR
- Custom LNA Oligonucleotides
- Pyrosequencing
- ISH & Northern Blotting
- Epigenetics
- Functional & Cell Analysis
- Lab Essentials
- GeneGlobe Design & Analysis Hub
RNeasy Mini Kit
High-quality total RNA in minutes.
Smart ideas, deep insights
Get inspiring content today – with a free face mask.
- TB Management
QuantiFERON-TB Gold Plus
- QuantiFERON Transplant
- artus Viral Load
- Infectious Disease
- QIAstat-Dx Syndromic Testing
- therascreen Solid Tumor
- ipsogen Leukemia
- Circulating Tumor Cells
- Sexual & Reproductive Health
- Cervical Cancer Screening
- Maternal/Fetal Testing
- STI Testing
Sample Processing
Solutions for laboratory-developed tests.
- Sample Collection
- Investigator Solutions
- Human DNA Quantification
- STR Technology
Investigator 24plex QS Kit
Multiplex amplification for human ID, with CODIS and European standard markers.
- GeneReader NGS System
- Nucleic Acid Purification
- PCR Instruments
- PCR Setup & Liquid Handling
- Quality Control & Fragment Analysis
- Service Solutions
- Accessories
- Analytics Software
- Automatable Kits
- Tissue Disruption
Monitor and manage your QIAsphere-ready instruments from anywhere, using any mobile device.
- DNA Sequencing
- RNA Sequencing
- Multianalyte Sequencing (Multimodal)
- Sample Quality Control
- Whole Genome/Transcriptome Amplification
- DNA Methylation Analysis
- Metagenomics
- Analysis & Visualization
- Interpretation & Content Databases
- Enterprise Solutions
QIAGEN Clinical Insight (QCI) Interpret
Transparent, evidence-based NGS interpretation and reporting.
Find out more
QIAGENbioinformatics.com
- OEM Reagents and Chemistries
- Point of Care Instruments
COVID-19 testing and research
Up to date protocols and list of COVID-19 testing and research solutions.
- Multianalyte & Virus
- Instruments & Equipment
- Crystallization
- Fractionation & Depletion
- Tagged Protein Expression, Purification, Detection
- Tissue/FFPE
- PCR Enzymes & Kits
- Real-Time PCR Enzymes & Kits
- qPCR Assays & Instruments
- Preamplification
- dPCR Assays Kits & Instruments
- Instruments
- Consumables
- Chromosome Conformation
- DNA Methylation
- Histone Modification
- ELISA Assays
- Gene Reporter Assays
- miRNA Functional Analysis
- RNA Silencing
- Transfection
- Buffers & Reagents
- Centrifuges
- Gel Electrophoresis
- Vacuum Manifolds & Accessories
- QIAcube Connect Kits
- QIAcube HT Kits
- QIAsymphony Kits
- Whole Genome Sequencing
- Whole Exome Sequencing
- Targeted DNA Panels
- Single Cell DNA
- Custom DNA Panels
- Whole Genome
- miRNA & Small RNAseq
- RNA Fusions
- Stranded RNAseq
- Targeted RNA Panels
- T-Cell Receptor Sequencing
- Single Cell RNA
- Ultraplex 3’ Targeted
- Ribosomal RNA & Globin mRNA Removal
- Custom RNA Panels
- Multimodal Panels
- Single Cell DNA/RNA
- Custom Multimodal Panels
- Single Cell & Low Input
- Whole Transcriptome
- Whole Genome Metagenomics
- Targeted Metagenomics
- Metatranscriptome Analysis
- End-Point PCR
- HiFidelity, Long-Range & Other PCR
- One-Step RT-PCR
- Reverse Transcription & cDNA Synthesis
- Probe-Based One-Step qRT-PCR
- Probe-Based qPCR
- Reverse Transcription & cDNA Synthesis for qPCR
- SYBR Green- or Dye-Based One-Step qRT-PCR
- SYBR Green- or Dye-Based qPCR
- CNV qPCR Assays & Arrays
- Microbial DNA qPCR Assays & Panels
- miRNA qPCR Assay & Panels
- mRNA/IncRNA qPCR Assays & Panels
- Somatic Mutations qPCR Assays & Panels
- Food Safety Testing
- Preamplification Kits
- dPCR Instruments
- dPCR Assays
- dPCR Accessories
- Bisulfite Conversion Assays
- Methylation-Specific PCR
- Cell-Free DNA
- DNA Clean Up
- Genomic DNA
- Microbial DNA
- Plasmid DNA
- Cell-Free RNA
- Microbial RNA
- RNA Clean Up
Detect TB infection with confidence.
- Cancer Research
Digital PCR
- Molecular Biology Research
- GeneGlobe Design & Analysis
- Next-generation sequencing
- Genomic Services
- Liquid Biopsy
- Partnering for Precision Diagnostics
- Plant Research
Digital is the new absolute
- Knowledge & Support Overview
Service Contact Center
- Events & Webinars
- Knowledge Hub
- Quality & Safety Data
Product & Technical Support
Ordering Support
Contact details for order support and technical support.
- Order Support Contact
- Technical Support Contact
- Service Agreements
- QIAlab Consulting
- One-Time Services
- Professional Services
- Stories & Insights
- Virtual Events
- Videos & Animations
- Virtual Demos
- Bench Guide
- Technology & Research
- Technologies & Research Topics
- Explainer Videos and Demos
- Events and Webinars
Learning Hub
Explore resources, including product documentation, software, webinars, videos, virtual demos and more.
- Certificate of Analysis
- Safety Data Sheets
- Quality Assurance
- GHS Hazard Labeling
- Protein Crystallization Production Reports
- QIAGEN Exclusion Database Service
Find quality and safety documentation for your products.
- Troubleshooting Guide
- Product FAQ
- Troubleshooting Molecular Biology Applications
- Product Selection Guides
- Product Finder
- New Lab Start-Up Program
- Green Packaging
Find out which products work together, search our FAQ database and troubleshoot.
- Marketplace Solutions
- Commercial Partner and Distributor Solutions
- Local Ordering
- Terms & Conditions
Learn about easy ordering options that offer fast and reliable delivery.
- Upcoming Live Sessions
- Webinars On-Demand
- Animal Cell Culture
- Whole Genome Amplification
- LNA Technology
- HRM Technology
- Plasmid Resource Center
- Pyrosequencing Resource Center
- Oncology Companion Diagnostics
- On-demand Sessions
- Digital PCR Technology
- Cancer – Unraveling the Complexities
- Reproducibility Through Automation
- RNA Resource Center
- Single Cell Analysis
- QuantiFERON Technology
- Biomarker Insights
- Digital Insights
- Customer Stories
- Investor Relations
- Sustainability
- Our Customers
- Our Products
- Our Global Presence
- Our History
Learn about who we are and what we do to make improvements in life possible.
- Meet the QIAGENers
- Your Path to QIAGEN
Join the QIAGEN team
Latest information on COVID-19
News, testing solutions and stories covering global efforts in the fight against COVID-19.
Our stories
Explore our digital magazine full of customer stories and videos on scientific breakthroughs and healthcare advances.
Market Strategy
Read our equity story, financial disclosures and how we create shareholder value.
- Executive Committee
- Supervisory Board
- Scientific Advisory Board
Latest News
Read up on our latest press releases or peruse our various media archives.
- Environment
- A letter from the CEO
- Order Support
- Technical Questions
- Human Resources
- Business Development
- Pharmaceutical Industry
- Media Inquiries
- Investor Relations Contacts
- Website Feedback
- Global Contacts
Thank you for choosing QIAGEN. If you have questions about QIAGEN, our products or your order, this page should help you find the answers and contacts you need.
- QIAGEN Subsidiaries
- QIAGEN Divisions
Press Release
Qiagen launches digital pcr assay design tool for qiacuity, expands customization capabilities of its research platform geneglobe, further information, weitere informationen.
- New QIAcuity digital PCR Custom Assay Design Tool for copy number variation analysis supports researchers’ customization needs, complementing QIAGEN’s existing pre-designed assays
- GeneGlobe Design and Analysis Hub receives further enhancements, improving user experience and capabilities to design panels collaboratively
- Advancements strengthen QIAGEN as a trusted partner for researchers, catering to their diverse needs to further accelerate drug discovery and other applications
Venlo, the Netherlands, June 05, 2024 (GLOBE NEWSWIRE) -- QIAGEN (NYSE: QGEN; Frankfurt Prime Standard: QIA) today announced the launch of its new digital PCR (dPCR) Custom Assay Design Tool for copy number variation (CNV) analysis for use on its digital PCR platform QIAcuity and several other enhancements in its GeneGlobe Design and Analysis Hub, a comprehensive research platform that integrates pre-designed assays with a database of more than 10,000 biological entities including genes, miRNAs, and pathways. The new advancements aim to support customers with a wide range of assay customization options, from simple to complex and validated multiplex assays, while further improving the user experience.
Genetic research is moving fast, and new target genes are rapidly evolving that are not covered by standard or pre-designed assays. To keep pace and close the need gap, the new digital PCR Custom Assay Design Tool has been developed as an interface on the GeneGlobe platform. It enables customers to design and order assays for use on QIAGEN’s digital PCR platform QIAcuity outside of QIAGEN’s comprehensive catalog of over 200 wet-lab validated assays for copy number variations profiling in translational cancer research. Copy number variations (CNVs) are a type of genetic variation where specific segments of the DNA are copied more or fewer times than normal in the genome, potentially affecting susceptibility to diseases and response to treatment.
“As certain copy number variations are associated with cancer, studying them can improve the understanding of how these variations can affect health and the responsiveness to treatments. It is therefore crucial for advancing precision medicine,” explained Nitin Sood, Senior Vice President, Head of the Life Science Business Area at QIAGEN. “Our new digital PCR Custom Assay Design Tool in GeneGlobe provides researchers with an innovative and user-friendly tool to design customized assays for QIAcuity tailored to their specific needs, streamlining research and accelerating scientific discovery.”
Additional enhancements of GeneGlobe have been launched recently or are currently in development. These include more user-friendly design pages that simplify product selection and a new tool for creating, saving and editing target gene lists, supporting researchers in creating their own panels, even collaboratively. Thanks to a software update, pathway maps from QIAGEN’s Ingenuity Pathway Analysis are now rendered faster. QIAGEN is working on improving the searchability of pathways and pathway relationships and plans to expand the interactivity of pathway diagrams, facilitating the import of selected genes into the GeneGlobe Custom Panel Design tools.
QIAGEN is building a strong pipeline for customization and plans to expand the dPCR Custom Assay Design Tool capabilities to microbial and somatic mutation assays later in 2024. When customers seek higher-order multiplexing or more complex assays, QIAGEN Genomic Services offers expert custom assay design support and assays are made available in GeneGlobe.
About GeneGlobe
QIAGEN’s proprietary research platform GeneGlobe provides researchers with easy access to an extensive range of molecular biology tools, pre-designed assays and customizable design services. The platform streamlines the process of identifying, selecting, and customizing assays, panels and pathway maps tailored to specific research needs while continuously updating its content to ensure researchers stay up to date with the latest advancements in their respective fields.
Learn more about QIAGEN's GeneGlobe Design and Analysis Hub and the latest advancements at https://geneglobe.qiagen.com/ .
About QIAcuity
QIAGEN's digital PCR platform QIAcuity uses nanoplates to disperse a sample over thousands of tiny partitions and then reads the reaction in each one simultaneously to quantify even the faintest signals from DNA and RNA. This enables specific, sensitive, and rapid detection of small copy number changes up to 5-plex.
The highly versatile QIAcuity systems integrate partitioning, thermocycling, and imaging into one workflow, cutting processing times to only two hours from six and are available in one, four and eight-plate versions. While the one-plate version processes up to 384 samples in an eight-hour shift, the eight-plate version processes up to 1,248 samples in the same time period. At the end of 2023, more than 2,000 cumulative instrument placements had been made.
About QIAGEN
QIAGEN N.V., a Netherlands-based holding company, is the leading global provider of Sample to Insight solutions that enable customers to gain valuable molecular insights from samples containing the building blocks of life. Our sample technologies isolate and process DNA, RNA and proteins from blood, tissue and other materials. Assay technologies make these biomolecules visible and ready for analysis. Bioinformatics software and knowledge bases interpret data to report relevant, actionable insights. Automation solutions tie these together in seamless and cost-effective workflows. QIAGEN provides solutions to more than 500,000 customers around the world in Molecular Diagnostics (human healthcare) and Life Sciences (academia, pharma R&D and industrial applications, primarily forensics). As of March 31, 2024, QIAGEN employed approximately 5,900 people in over 35 locations worldwide. Further information can be found at http://www.qiagen.com .
Forward-Looking Statement
Certain statements contained in this press release may be considered forward-looking statements within the meaning of Section 27A of the U.S. Securities Act of 1933, as amended, and Section 21E of the U.S. Securities Exchange Act of 1934, as amended. To the extent that any of the statements contained herein relating to QIAGEN's products, timing for launch and development, marketing and/or regulatory approvals, financial and operational outlook, growth and expansion, collaborations, markets, strategy or operating results, including without limitation its expected adjusted net sales and adjusted diluted earnings results, are forward-looking, such statements are based on current expectations and assumptions that involve a number of uncertainties and risks. Such uncertainties and risks include, but are not limited to, risks associated with management of growth and international operations (including the effects of currency fluctuations, regulatory processes and dependence on logistics), variability of operating results and allocations between customer classes, the commercial development of markets for our products to customers in academia, pharma, applied testing and molecular diagnostics; changing relationships with customers, suppliers and strategic partners; competition; rapid or unexpected changes in technologies; fluctuations in demand for QIAGEN's products (including fluctuations due to general economic conditions, the level and timing of customers' funding, budgets and other factors); our ability to obtain regulatory approval of our products; difficulties in successfully adapting QIAGEN's products to integrated solutions and producing such products; the ability of QIAGEN to identify and develop new products and to differentiate and protect our products from competitors' products; market acceptance of QIAGEN's new products and the integration of acquired technologies and businesses; actions of governments, global or regional economic developments, weather or transportation delays, natural disasters, political or public health crises, and its impact on the demand for our products and other aspects of our business, or other force majeure events; as well as the possibility that expected benefits related to recent or pending acquisitions may not materialize as expected; and the other factors discussed under the heading “Risk Factors” contained in our most recent Annual Report on Form 20-F. For further information, please refer to the discussions in reports that QIAGEN has filed with, or furnished to, the U.S. Securities and Exchange Commission.
Multimedia Files:
Press Contacts

Daniela Berheide Associate Director Public Relations
Germany: +49 2103 29 11676
Mobile: +49 152 01811676

Lisa Mannagottera Manager Public Relations
Germany: +49 2103 29 14181
Mobile: +49 152 01811381
Download VCARD

Dr. Thomas Theuringer Senior Director Corporate Communications & Head Of External Communications
Germany: +49 2103 29 11826
Mobile: +49 1520 18 11826
IR Contacts

Domenica Martorana Associate Director Global Investor Relations
Germany +49 2103 29 11244
Mobile +49 152 018 11244
+49 2103 29 11244

Alexandra Koenig Investor Relations Coordinator
Germany +49 2103 29 11709
Mobile +49 152 018 11709

John Gilardi Vice President Head of Corporate Communications and Investor Relations
Germany +49 2103 29 11711
Mobile +49 152 018 11711
U.S. +1 240 686 2222
The Netherlands +31 773 55 66 66
Email Alerts
To opt-in for investor email alerts, please enter your email address in the field below and select at least one alert option. After submitting your request, you will receive an activation email to the requested email address. You must click the activation link in order to complete your subscription. You can sign up for additional alert options at any time.
At QIAGEN N.V., we promise to treat your data with respect and will not share your information with any third party. You can unsubscribe to any of the investor alerts you are subscribed to by visiting the ?unsubscribe? section below. If you experience any issues with this process, please contact us for further assistance.
By providing your email address below, you are providing consent to QIAGEN N.V. to send you the requested Investor Email Alert updates.
Um sich für E-Mail-Benachrichtigungen für Anleger anzumelden, geben Sie bitte Ihre E-Mail-Adresse in das unten stehende Feld ein und wählen Sie mindestens eine Benachrichtigungsoption aus. Nach dem Absenden Ihrer Anfrage erhalten Sie eine Aktivierungs-E-Mail an die angegebene E-Mail-Adresse. Sie müssen den Aktivierungslink anklicken, um Ihr Abonnement abzuschließen. Sie können sich jederzeit für weitere Benachrichtigungsoptionen anmelden.
QIAGEN N.V. verpflichtet sich, Ihre Daten mit Respekt zu behandeln und sie nicht an Dritte weiterzugeben. Sie können alle von Ihnen abonnierten Investor Alerts abbestellen, indem Sie den unten stehenden Abschnitt "Abbestellen" besuchen. Sollten Sie Probleme mit diesem Vorgang haben, wenden Sie sich bitte an uns, um weitere Unterstützung zu erhalten.
Durch die Angabe Ihrer E-Mail-Adresse erklären Sie sich damit einverstanden, dass QIAGEN N.V. Ihnen die angeforderten Investor Email Alert Updates zusendet.
* Erforderlich
Email Alert Sign Up Confirmation
Anmeldebestätigung e-mail-alarm.
- linkedin open in new window
- facebook open in new window
- twitter open in new window
- youtube open in new window
This site is protected by reCAPTCHA and the Google Privacy Policy and Terms of Service apply.
Sample to Insight
- Trademarks & Disclaimers
- Privacy Policy
- Accessibility
The state of AI in early 2024: Gen AI adoption spikes and starts to generate value
If 2023 was the year the world discovered generative AI (gen AI) , 2024 is the year organizations truly began using—and deriving business value from—this new technology. In the latest McKinsey Global Survey on AI, 65 percent of respondents report that their organizations are regularly using gen AI, nearly double the percentage from our previous survey just ten months ago. Respondents’ expectations for gen AI’s impact remain as high as they were last year , with three-quarters predicting that gen AI will lead to significant or disruptive change in their industries in the years ahead.
About the authors
This article is a collaborative effort by Alex Singla , Alexander Sukharevsky , Lareina Yee , and Michael Chui , with Bryce Hall , representing views from QuantumBlack, AI by McKinsey, and McKinsey Digital.
Organizations are already seeing material benefits from gen AI use, reporting both cost decreases and revenue jumps in the business units deploying the technology. The survey also provides insights into the kinds of risks presented by gen AI—most notably, inaccuracy—as well as the emerging practices of top performers to mitigate those challenges and capture value.
AI adoption surges
Interest in generative AI has also brightened the spotlight on a broader set of AI capabilities. For the past six years, AI adoption by respondents’ organizations has hovered at about 50 percent. This year, the survey finds that adoption has jumped to 72 percent (Exhibit 1). And the interest is truly global in scope. Our 2023 survey found that AI adoption did not reach 66 percent in any region; however, this year more than two-thirds of respondents in nearly every region say their organizations are using AI. 1 Organizations based in Central and South America are the exception, with 58 percent of respondents working for organizations based in Central and South America reporting AI adoption. Looking by industry, the biggest increase in adoption can be found in professional services. 2 Includes respondents working for organizations focused on human resources, legal services, management consulting, market research, R&D, tax preparation, and training.
Also, responses suggest that companies are now using AI in more parts of the business. Half of respondents say their organizations have adopted AI in two or more business functions, up from less than a third of respondents in 2023 (Exhibit 2).
Gen AI adoption is most common in the functions where it can create the most value
Most respondents now report that their organizations—and they as individuals—are using gen AI. Sixty-five percent of respondents say their organizations are regularly using gen AI in at least one business function, up from one-third last year. The average organization using gen AI is doing so in two functions, most often in marketing and sales and in product and service development—two functions in which previous research determined that gen AI adoption could generate the most value 3 “ The economic potential of generative AI: The next productivity frontier ,” McKinsey, June 14, 2023. —as well as in IT (Exhibit 3). The biggest increase from 2023 is found in marketing and sales, where reported adoption has more than doubled. Yet across functions, only two use cases, both within marketing and sales, are reported by 15 percent or more of respondents.
Gen AI also is weaving its way into respondents’ personal lives. Compared with 2023, respondents are much more likely to be using gen AI at work and even more likely to be using gen AI both at work and in their personal lives (Exhibit 4). The survey finds upticks in gen AI use across all regions, with the largest increases in Asia–Pacific and Greater China. Respondents at the highest seniority levels, meanwhile, show larger jumps in the use of gen Al tools for work and outside of work compared with their midlevel-management peers. Looking at specific industries, respondents working in energy and materials and in professional services report the largest increase in gen AI use.
Investments in gen AI and analytical AI are beginning to create value
The latest survey also shows how different industries are budgeting for gen AI. Responses suggest that, in many industries, organizations are about equally as likely to be investing more than 5 percent of their digital budgets in gen AI as they are in nongenerative, analytical-AI solutions (Exhibit 5). Yet in most industries, larger shares of respondents report that their organizations spend more than 20 percent on analytical AI than on gen AI. Looking ahead, most respondents—67 percent—expect their organizations to invest more in AI over the next three years.
Where are those investments paying off? For the first time, our latest survey explored the value created by gen AI use by business function. The function in which the largest share of respondents report seeing cost decreases is human resources. Respondents most commonly report meaningful revenue increases (of more than 5 percent) in supply chain and inventory management (Exhibit 6). For analytical AI, respondents most often report seeing cost benefits in service operations—in line with what we found last year —as well as meaningful revenue increases from AI use in marketing and sales.
Inaccuracy: The most recognized and experienced risk of gen AI use
As businesses begin to see the benefits of gen AI, they’re also recognizing the diverse risks associated with the technology. These can range from data management risks such as data privacy, bias, or intellectual property (IP) infringement to model management risks, which tend to focus on inaccurate output or lack of explainability. A third big risk category is security and incorrect use.
Respondents to the latest survey are more likely than they were last year to say their organizations consider inaccuracy and IP infringement to be relevant to their use of gen AI, and about half continue to view cybersecurity as a risk (Exhibit 7).
Conversely, respondents are less likely than they were last year to say their organizations consider workforce and labor displacement to be relevant risks and are not increasing efforts to mitigate them.
In fact, inaccuracy— which can affect use cases across the gen AI value chain , ranging from customer journeys and summarization to coding and creative content—is the only risk that respondents are significantly more likely than last year to say their organizations are actively working to mitigate.
Some organizations have already experienced negative consequences from the use of gen AI, with 44 percent of respondents saying their organizations have experienced at least one consequence (Exhibit 8). Respondents most often report inaccuracy as a risk that has affected their organizations, followed by cybersecurity and explainability.
Our previous research has found that there are several elements of governance that can help in scaling gen AI use responsibly, yet few respondents report having these risk-related practices in place. 4 “ Implementing generative AI with speed and safety ,” McKinsey Quarterly , March 13, 2024. For example, just 18 percent say their organizations have an enterprise-wide council or board with the authority to make decisions involving responsible AI governance, and only one-third say gen AI risk awareness and risk mitigation controls are required skill sets for technical talent.
Bringing gen AI capabilities to bear
The latest survey also sought to understand how, and how quickly, organizations are deploying these new gen AI tools. We have found three archetypes for implementing gen AI solutions : takers use off-the-shelf, publicly available solutions; shapers customize those tools with proprietary data and systems; and makers develop their own foundation models from scratch. 5 “ Technology’s generational moment with generative AI: A CIO and CTO guide ,” McKinsey, July 11, 2023. Across most industries, the survey results suggest that organizations are finding off-the-shelf offerings applicable to their business needs—though many are pursuing opportunities to customize models or even develop their own (Exhibit 9). About half of reported gen AI uses within respondents’ business functions are utilizing off-the-shelf, publicly available models or tools, with little or no customization. Respondents in energy and materials, technology, and media and telecommunications are more likely to report significant customization or tuning of publicly available models or developing their own proprietary models to address specific business needs.
Respondents most often report that their organizations required one to four months from the start of a project to put gen AI into production, though the time it takes varies by business function (Exhibit 10). It also depends upon the approach for acquiring those capabilities. Not surprisingly, reported uses of highly customized or proprietary models are 1.5 times more likely than off-the-shelf, publicly available models to take five months or more to implement.
Gen AI high performers are excelling despite facing challenges
Gen AI is a new technology, and organizations are still early in the journey of pursuing its opportunities and scaling it across functions. So it’s little surprise that only a small subset of respondents (46 out of 876) report that a meaningful share of their organizations’ EBIT can be attributed to their deployment of gen AI. Still, these gen AI leaders are worth examining closely. These, after all, are the early movers, who already attribute more than 10 percent of their organizations’ EBIT to their use of gen AI. Forty-two percent of these high performers say more than 20 percent of their EBIT is attributable to their use of nongenerative, analytical AI, and they span industries and regions—though most are at organizations with less than $1 billion in annual revenue. The AI-related practices at these organizations can offer guidance to those looking to create value from gen AI adoption at their own organizations.
To start, gen AI high performers are using gen AI in more business functions—an average of three functions, while others average two. They, like other organizations, are most likely to use gen AI in marketing and sales and product or service development, but they’re much more likely than others to use gen AI solutions in risk, legal, and compliance; in strategy and corporate finance; and in supply chain and inventory management. They’re more than three times as likely as others to be using gen AI in activities ranging from processing of accounting documents and risk assessment to R&D testing and pricing and promotions. While, overall, about half of reported gen AI applications within business functions are utilizing publicly available models or tools, gen AI high performers are less likely to use those off-the-shelf options than to either implement significantly customized versions of those tools or to develop their own proprietary foundation models.
What else are these high performers doing differently? For one thing, they are paying more attention to gen-AI-related risks. Perhaps because they are further along on their journeys, they are more likely than others to say their organizations have experienced every negative consequence from gen AI we asked about, from cybersecurity and personal privacy to explainability and IP infringement. Given that, they are more likely than others to report that their organizations consider those risks, as well as regulatory compliance, environmental impacts, and political stability, to be relevant to their gen AI use, and they say they take steps to mitigate more risks than others do.
Gen AI high performers are also much more likely to say their organizations follow a set of risk-related best practices (Exhibit 11). For example, they are nearly twice as likely as others to involve the legal function and embed risk reviews early on in the development of gen AI solutions—that is, to “ shift left .” They’re also much more likely than others to employ a wide range of other best practices, from strategy-related practices to those related to scaling.
In addition to experiencing the risks of gen AI adoption, high performers have encountered other challenges that can serve as warnings to others (Exhibit 12). Seventy percent say they have experienced difficulties with data, including defining processes for data governance, developing the ability to quickly integrate data into AI models, and an insufficient amount of training data, highlighting the essential role that data play in capturing value. High performers are also more likely than others to report experiencing challenges with their operating models, such as implementing agile ways of working and effective sprint performance management.
About the research
The online survey was in the field from February 22 to March 5, 2024, and garnered responses from 1,363 participants representing the full range of regions, industries, company sizes, functional specialties, and tenures. Of those respondents, 981 said their organizations had adopted AI in at least one business function, and 878 said their organizations were regularly using gen AI in at least one function. To adjust for differences in response rates, the data are weighted by the contribution of each respondent’s nation to global GDP.
Alex Singla and Alexander Sukharevsky are global coleaders of QuantumBlack, AI by McKinsey, and senior partners in McKinsey’s Chicago and London offices, respectively; Lareina Yee is a senior partner in the Bay Area office, where Michael Chui , a McKinsey Global Institute partner, is a partner; and Bryce Hall is an associate partner in the Washington, DC, office.
They wish to thank Kaitlin Noe, Larry Kanter, Mallika Jhamb, and Shinjini Srivastava for their contributions to this work.
This article was edited by Heather Hanselman, a senior editor in McKinsey’s Atlanta office.
Explore a career with us
Related articles.

Moving past gen AI’s honeymoon phase: Seven hard truths for CIOs to get from pilot to scale

A generative AI reset: Rewiring to turn potential into value in 2024

Implementing generative AI with speed and safety
Researchers at UC Davis and Oak Ridge National Laboratory Develop New Tool for Neuron Experiments
- by College of Engineering Communications
- June 04, 2024
A collaboration between Adam Moulé , the Joe and Essie Smith Endowed Chair of Chemical Engineering at the University of California, Davis, former UC Davis Ph.D. student Daniel Vong, and Luke Daemen, a researcher at Oak Ridge National Laboratory, or ORNL, has resulted in rotating sample holder that enables new types of neuron experiments.

The sample holder tumbles powdered photochemical materials within a neutron beamline. The rotating holder exposes more of the material to light for increased photoactivation and better photochemistry data capture. Conventional sample holders were unable to rotate, or tumble, powdered samples, which meant light could only reach and activate molecules on the sample’s surface, reducing the amount and quality of data that could be captured.
The new sample holder has already enabled the first neutron scattering observations of an optically excited photon splitting into two particles — a process that could lead to increased solar energy conversion efficiency in photovoltaic devices, such as solar cells or solar panels, and industrial processes.
Vong, the first author of the paper for this research , was a researcher in Moulé’s Renewable Energy Electronics Lab while pursuing his doctorate in materials science and engineering at UC Davis. He spent a year at ORNL collaborating with Daemon on developing the new sample environment based on Moulé’s ideas.
Vong is now at Intel in Portland, Oregon, and Moulé and his lab group continue to collaborate with Daemon. They plan to do more experiments this year.
“The collaboration was a win-win, demonstrating how the university and ORNL scientists can work together successfully,” said Moulé. “It was a great opportunity for one of our researchers to intern at ORNL, learning from an expert instrument scientist and having access to the resources needed to build such an innovative sample holder.”
Read about the collaborative research at ORNL
Primary Category
Secondary categories.
The Great Misalignment: Addressing the Mismatch between the Supply of Certificates and Associate’s Degrees and the Future Demand for Workers in 565 US Labor Markets
The great misalignment, addressing the mismatch between the supply of certificates and associate’s degrees and the future demand for workers in 565 us labor markets, full report, press release.
Los Angeles. Atlanta. Savannah. Pittsburgh. Hundreds of local labor markets fuel the American economy, and each one is driven by the needs of the local area’s mix of industries and the skills of its workers. When these needs and skills align, everyone can benefit. But many local economies are struggling to achieve strong alignment between the demand for middle-skills credentials (certificates and associate’s degrees) and the supply of these credentials produced by local institutions.
The Great Misalignment: Addressing the Mismatch between the Supply of Certificates and Associate’s Degrees and the Future Demand for Workers in 565 US Labor Markets demonstrates that in half of the nation’s labor markets, at least 50 percent of all middle-skills credentials would need to be granted in different fields of study to meet projected labor demand through 2031.
Source: Georgetown University Center on Education and the Workforce (GUCEW) analysis of data from the US Census Bureau, American Community Survey (ACS), 2012–21; US Department of Education, Integrated Postsecondary Education Data System (IPEDS), 2019–21; and GUCEW State Job Projections data set, 2023.
Note: Values may not sum to 100 percent due to rounding.
Middle-Skills Misalignment in 565 Local Labor Markets
The extent of middle-skills misalignment varies widely across the 565 local labor markets in the US that have at least one middle-skills credential provider. One-quarter of these local labor markets would need to redistribute up to 42 percent of the middle-skills credentials conferred locally to align the distribution of credentials with the distribution of projected job openings. Another one-quarter would need to redistribute more than 60 percent of middle-skills credentials. For example, the level of credentials-to-jobs misalignment is more than 70 percent higher in Los Angeles than in Atlanta.
Use the map to explore alignment metrics for each local area.
Source: Georgetown University Center on Education and the Workforce (GUCEW) analysis of data from the US Census Bureau, American Community Survey (ACS), 2012–21; US Department of Agriculture, Commuting Zones and Labor Market Areas, 2012; US Department of Education, Integrated Postsecondary Education Data System (IPEDS), 2019–21; and GUCEW State Job Projections data set, 2023.
Sources of Middle-Skills Misalignment
An important driver of misalignment in a local economy is the number of middle-skills providers in the area. Labor markets served by more middle-skills education and training providers tend to experience lower levels of credentials-to-jobs misalignment than those served by fewer providers. Our research suggests that this is because each provider prioritizes programs that fill different, but complementary, labor-market needs. Given that rural areas often have fewer providers, misalignment is typically higher in rural labor markets than in urban ones.
Another major source of middle-skills misalignment is the large percentage of credentials that have little or no direct connection to a specific occupational cluster. For example, 28 percent of all middle-skills credentials awarded nationwide have no direct occupational match. More than 90 percent of these credentials are granted in liberal arts, general studies, and humanities programs. While it is very likely that students pursuing credentials in these fields do so for reasons other than workforce preparation, such as anticipated transfer to a four-year institution, only 42 percent of certificate and associate’s degree completers in liberal arts, general studies, and humanities programs transfer to four-year institutions within six years. Given the risk that they will not successfully transfer to a four-year program, graduates in fields with no direct connection to an occupation may experience particularly difficult transitions from school to work.
Racial/Ethnic Disparities
Where individuals live has always affected their access to educational and professional opportunities. Most working-age adults in the US live within commuting distance of a local middle-skills provider. However, American Indian/Alaska Native adults are 3 to 18 times more likely than working-age adults in other racial/ethnic groups to live in an area without a local middle-skills provider, and living on tribal lands explains only some of this difference.
Additional racial/ethnic disparities arise when considering areas served by at least one middle-skills provider. In these areas, for example, Hispanic/Latino adults are 1.3 to 1.6 times more likely than adults of other racial/ethnic backgrounds to live in areas with poor alignment. Thus, the geography of opportunity is not providing middle-skills graduates of different racial/ethnic backgrounds with equal chances of working in jobs that align with their knowledge, training, and skills.
Note: The sample is restricted to adults ages 18–65 living in labor markets served by at least one middle-skills education or training provider.
Recommendations
Policymakers and stakeholders need to help middle-skills providers be more responsive to the needs of their students and economies by
- focusing on alignment across institutions to foster more coordination across local providers,
- improving data practices so efforts to align credential production with projected demand are well-informed,
- investing in counseling services that maximize students’ use of data when they select education and career paths, and
- improving career preparation and transfer pathways to bachelor’s degree programs in fields with no direct occupational match.
The Great Misalignment: Addressing the Mismatch between the Supply of Certificates and Associate’s Degrees and the Future Demand for Workers in 565 US Labor Markets examines the extent to which middle-skills providers are awarding credentials in fields that align with local workforce needs.
Comments are closed.

Home Resource Library Press Room Projects
About CEW Maps & Directions Reprint Permission Privacy Policy EIT accessibility
- Newsletters
- Infographics
- Press Releases
- Media Mentions
- Media Inquiries
- Explore Our ROI Rankings
- COVID-19 Research
- Good Jobs Data
- State Research

Semantic Kernel
The latest news from the Semantic Kernel team for developers

New LinkedIn Learning Course on Semantic Kernel Fundamentals
Build 2024 Recap: Bridging the chasm between your ML and app devs

Announcing the Release of Semantic Kernel Python 1.0.0

Announcing the General Availability of Semantic Kernel for Java
Semantic Kernel Time Plugin with Python
Use semantic kernel to create a restaurant bookings sample with python, connect logic apps’ 1,400 connectors to semantic kernel.

Meet the Semantic Kernel Team at Microsoft BUILD
Customer Case Study: Fujitsu Composite AI and Semantic Kernel
Use semantic kernel to create a restaurant bookings sample with .net.


Watch these Dates for Key Market Research Reports

Make Your Voice Count in the Capital
- News & Media
- Florida Realtors News
‘Entangled’ Landscapes Soften Outdoor Design

Landscape architects are moving away from straight edges and borders, incorporating more plants and hardscape elements.
NEW YORK – “Entangling” is a new buzzword in landscaping design as outdoor trends move away from clearly defined straight edges and borders. As the name implies, “entangled landscaping” mixes in a blend of plants and hardscapes.
"Whether driven by aesthetic requests or as a byproduct of maintaining onsite drainage, we're seeing increased interest" in this trend, according to the “2024 U.S. Houzz Home Design Predictions” report. The design offers a more natural look that can soften pathways by breaking up large expanses of a hardscape.
With “entangled” design, the edges in the landscape appear to have no clear break. The look often incorporates natural stone transitions, blending crooked edges with boulders and grass, and weaves in native plants to make an outdoor space mimic its natural surroundings. For example, a manicured pathway may wind through meadows of native grasses.
A popular technique to achieve an entangled design is called “fading,” which allows hardscapes to blend into the turf or grass. This can be done with stone pavers that appear jagged and protruding from the surface, which can help soften an outdoor space without being perfectly aligned.
Another technique to entangled design is called “outcropping,” which incorporates large stone boulders nestled throughout the landscape.
One caveat to entangled design is that maintenance can become a chore. Wilder, natural elements can quickly start to overwhelm a landscape, making upkeep essential.
“The pioneers of recent entangled design tended to be those who were environmentally conscious and appreciated the fusion of native plantings combined with clean hardscape architecture,” says Jackie Mosher, co-founder of Dzinly, a company that provides digital exterior designs for inspiration. “With social media inspiration, it has now become a trend and a look people are gravitating toward.”
© 2024 National Association of Realtors® (NAR)
You May Also Like
- Black Homeownership Up, but Not to 2004 Level
- Which AI Chatbot Is Best for Your Business?
- Rental Market Settling in Most Florida Cities
COMMENTS
A research design is a strategy for answering your research question using empirical data. Creating a research design means making decisions about: Your overall research objectives and approach. Whether you'll rely on primary research or secondary research. Your sampling methods or criteria for selecting subjects. Your data collection methods.
d.school Mixtapes. Three "mixtapes" of methods to jumpstart your work: Understand - Experiment - Ideate. Gamestorming. "A toolkit of co-creation tools for innovators, rule-breakers and changemakers.". IBM Design Research Resources Toolkit. "New methods and models created by IBMers, for IBMers.". IDEO Method Cards.
Some of the popular tools that designers use today include: Adobe XD: This all-in-one UX/UI design software allows for wireframing, prototyping, and collaboration in the same platform. Figma: Known for its cloud-based interface, Figma enables real-time collaboration, making it a favorite among design teams.
Step 1: Consider your aims and approach. Step 2: Choose a type of research design. Step 3: Identify your population and sampling method. Step 4: Choose your data collection methods. Step 5: Plan your data collection procedures. Step 6: Decide on your data analysis strategies. Frequently asked questions.
What is Design Research? Design research is the practice of gaining insights by observing users and understanding industry and market shifts. For example, in service design it involves designers' using ethnography—an area of anthropology—to access study participants, to gain the best insights and so be able to start to design popular ...
Design tools are essential to the UX research process, as they let you bring your ideas to life and turn the precious user feedback that you collected beforehand into new products and features. Here are our top 3 UI design tools that build new products and features: 9. Figma. Figma's design platform connects everyone in the design process so ...
4. UsabilityHub. UsabilityHub is a remote research platform that offers a range of testing tools, including first click testing, design surveys, preference tests, and five-second tests. These tests enable you to collect data and validate design decisions.
Types of Research Designs Compared | Guide & Examples. Published on June 20, 2019 by Shona McCombes.Revised on June 22, 2023. When you start planning a research project, developing research questions and creating a research design, you will have to make various decisions about the type of research you want to do.. There are many ways to categorize different types of research.
Research design is the framework of research methods and techniques chosen by a researcher to conduct a study. The design allows researchers to sharpen the research methods suitable for the subject matter and set up their studies for success. Creating a research topic explains the type of research (experimental,survey research,correlational ...
Typeform. Typeform is one of the most intuitive user research tools available and is great for surveys. It's easy to set up and is known for its colorful UI. Its highlights include: A variety of templates for web/app surveys, quizzes, and polls. Integrations with primary tools like Slack, Zapier, Hubspot, and Google Docs.
The purpose of research design is to plan and structure a research study in a way that enables the researcher to achieve the desired research goals with accuracy, validity, and reliability. Research design is the blueprint or the framework for conducting a study that outlines the methods, procedures, techniques, and tools for data collection ...
UX Research Tools. Human-centered design is all the rage right now—and justifiably so. People belong at the forefront of any experience design and UX research tools and toolkits help design teams deliver experiences. This is an age where people have more options and greater access to those options than ever before.
Run remote design sprints. Run an engaging design thinking workshop to build and test prototypes by combining content and data from design, research, and BI tools. Facilitate an inclusive working session with distributed teammates with features like timer, voting, private mode, and breakout boards.
Research design methods refer to the systematic approaches and techniques used to plan, structure, and conduct a research study. The choice of research design method depends on the research questions, objectives, and the nature of the study. Here are some key research design methods commonly used in various fields: 1.
5. Maze for user surveys, concept validation, and wireframe & prototype testing. Maze is another UX research all-rounder with a focus on rapid testing. You can use it for card sorting, tree testing, 5-second tests, surveys, and to test wireframes and prototypes on real users.
Research design is a plan to answer your research question. A research method is a strategy used to implement that plan. Research design and methods are different but closely related, because good research design ensures that the data you obtain will help you answer your research question more effectively. Which research method should I choose?
Design research focuses on understanding user needs, behaviors and experiences to inform and improve product or service design. Market research, on the other hand, is more concerned with the broader market dynamics, identifying opportunities, and maximizing sales and profitability. Both are essential for the success of a product or service, but ...
The research design categories under this are descriptive, experimental, correlational, diagnostic, and explanatory. Data analysis involves interpretation and narrative analysis. Data analysis involves statistical analysis and hypothesis testing. The reasoning used to synthesize data is inductive.
Before beginning your paper, you need to decide how you plan to design the study.. The research design refers to the overall strategy and analytical approach that you have chosen in order to integrate, in a coherent and logical way, the different components of the study, thus ensuring that the research problem will be thoroughly investigated. It constitutes the blueprint for the collection ...
Submitted by: Kavneet Kaur. Universal Methods of Design is an outstanding compilation of 100 different research methods compiled in alphabetical order. It makes research methods so easy to follow and a great recourse to comeback to time and again. See at amazon.com. Z.
Research design is the plan, structure and strategy and investigation concaved so as to obtain search question and control variance" (Borwankar, 1995). ... What are the methods/tools of data ...
Our true impact lies in effectively communicating research findings and design concepts to key stakeholders and securing their buy-in for implementing our user-centered solutions. This is where persuasion and communication theory become powerful tools, empowering UX practitioners to bridge the gap between research and action.
New QIAcuity digital PCR Custom Assay Design Tool for copy number variation analysis supports researchers' customization needs, complementing QIAGEN's existing pre-designed assays // GeneGlobe Design and Analysis Hub receives further enhancements, improving user experience and capabilities to design panels collaboratively // Advancements strengthen QIAGEN as a trusted partner for ...
If 2023 was the year the world discovered generative AI (gen AI), 2024 is the year organizations truly began using—and deriving business value from—this new technology. In the latest McKinsey Global Survey on AI, 65 percent of respondents report that their organizations are regularly using gen AI, nearly double the percentage from our ...
A collaboration between Adam Moulé, the Joe and Essie Smith Endowed Chair of Chemical Engineering at the University of California, Davis, former UC Davis Ph.D. student Daniel Vong, and Luke Daemen, a researcher at Oak Ridge National Laboratory, or ORNL, has resulted in rotating sample holder that enables new types of neuron experiments.
Qualitative research involves collecting and analyzing non-numerical data (e.g., text, video, or audio) to understand concepts, opinions, or experiences. It can be used to gather in-depth insights into a problem or generate new ideas for research. Qualitative research is the opposite of quantitative research, which involves collecting and ...
Labor markets served by more middle-skills education and training providers tend to experience lower levels of credentials-to-jobs misalignment than those served by fewer providers. Our research suggests that this is because each provider prioritizes programs that fill different, but complementary, labor-market needs.
May 22, 2024. Evan Mattson, Eduard van Valkenburg. We are thrilled to announce the release of the long-awaited Semantic Kernel Python SDK 1.0.0! This milestone version brings a plethora of enhancements and new features designed to empower AI and app developers with more robust and versatile tools.
Landscape architects are moving away from straight edges and borders, incorporating more plants and hardscape elements. NEW YORK - "Entangling" is a new buzzword in landscaping design as outdoor trends move away from clearly defined straight edges and borders. As the name implies, "entangled landscaping" mixes in a blend of plants and ...