Chapter 3: Probability Topics

Chapter 3 Homework
Section 3.1.

The graph in [link] displays the sample sizes and percentages of people in different age and gender groups who were polled concerning their approval of Mayor Ford’s actions in office. The total number in the sample of all the age groups is 1,045.
- Define three events in the graph.
- Describe in words what the entry 40 means.
- Describe in words the complement of the entry in question 2.
- Describe in words what the entry 30 means.
- Out of the males and females, what percent are males?
- Out of the females, what percent disapprove of Mayor Ford?
- Out of all the age groups, what percent approve of Mayor Ford?
- Find P (Approve|Male).
- Out of the age groups, what percent are more than 44 years old?
- Find P (Approve|Age < 35).
Explain what is wrong with the following statements. Use complete sentences.
- If there is a 60% chance of rain on Saturday and a 70% chance of rain on Sunday, then there is a 130% chance of rain over the weekend.
- The probability that a baseball player hits a home run is greater than the probability that he gets a successful hit.
- You can’t calculate the joint probability knowing the probability of both events occurring, which is not in the information given; the probabilities should be multiplied, not added; and probability is never greater than 100%
- A home run by definition is a successful hit, so he has to have at least as many successful hits as home runs.
Section 3.2
Use the following information to answer the next 12 exercises. The graph shown is based on more than 170,000 interviews done by Gallup that took place from January through December 2012. The sample consists of employed Americans 18 years of age or older. The Emotional Health Index Scores are the sample space. We randomly sample one Emotional Health Index Score.

Find the probability that an Emotional Health Index Score is 82.7.
Find the probability that an Emotional Health Index Score is 81.0.
Find the probability that an Emotional Health Index Score is more than 81?
Find the probability that an Emotional Health Index Score is between 80.5 and 82?
If we know an Emotional Health Index Score is 81.5 or more, what is the probability that it is 82.7?
What is the probability that an Emotional Health Index Score is 80.7 or 82.7?
What is the probability that an Emotional Health Index Score is less than 80.2 given that it is already less than 81.
What occupation has the highest emotional index score?
Physician (83.7)
What occupation has the lowest emotional index score?
What is the range of the data?
83.7 − 79.6 = 4.1
Compute the average EHIS.
If all occupations are equally likely for a certain individual, what is the probability that he or she will have an occupation with lower than average EHIS?
P (Occupation < 81.3) = 0.5
Bringing It Together
A previous year, the weights of the members of the San Francisco 49ers and the Dallas Cowboys were published in the San Jose Mercury News . The factual data are compiled into [link] .
For the following, suppose that you randomly select one player from the 49ers or Cowboys.
If having a shirt number from one to 33 and weighing at most 210 pounds were independent events, then what should be true about P (Shirt# 1–33|≤ 210 pounds)?
The probability that a male develops some form of cancer in his lifetime is 0.4567. The probability that a male has at least one false positive test result (meaning the test comes back for cancer when the man does not have it) is 0.51. Some of the following questions do not have enough information for you to answer them. Write “not enough information” for those answers. Let C = a man develops cancer in his lifetime and P = man has at least one false positive.
- P ( C ) = 0.4567
- not enough information
- No, because over half (0.51) of men have at least one false positive text
Given events G and H : P ( G ) = 0.43; P ( H ) = 0.26; P ( H AND G ) = 0.14
- Find P ( H OR G ).
- Find the probability of the complement of event ( H AND G ).
- Find the probability of the complement of event ( H OR G ).
Given events J and K : P ( J ) = 0.18; P ( K ) = 0.37; P ( J OR K ) = 0.45
- Find P ( J AND K ).
- Find the probability of the complement of event ( J AND K ).
- P ( J OR K ) = P ( J ) + P ( K ) − P ( J AND K ); 0.45 = 0.18 + 0.37 – P ( J AND K ); solve to find P ( J AND K ) = 0.10
- P (NOT ( J AND K )) = 1 – P ( J AND K ) = 1 – 0.10 = 0.90
- P (NOT ( J OR K )) = 1 – P ( J OR K ) = 1 – 0.45 = 0.55
Section 3.3
On February 28, 2013, a Field Poll Survey reported that 61% of California registered voters approved of allowing two people of the same gender to marry and have regular marriage laws apply to them. Among 18 to 39 year olds (California registered voters), the approval rating was 78%. Six in ten California registered voters said that the upcoming Supreme Court’s ruling about the constitutionality of California’s Proposition 8 was either very or somewhat important to them. Out of those CA registered voters who support same-sex marriage, 75% say the ruling is important to them.
In this problem, let:
- C = California registered voters who support same-sex marriage.
- B = California registered voters who say the Supreme Court’s ruling about the constitutionality of California’s Proposition 8 is very or somewhat important to them
- A = California registered voters who are 18 to 39 years old.
- Find P ( C ).
- Find P ( B ).
- Find P ( C | A ).
- Find P ( B | C ).
- In words, what is C | A ?
- In words, what is B | C ?
- Find P ( C AND B ).
- In words, what is C AND B ?
- Find P ( C OR B ).
- Are C and B mutually exclusive events? Show why or why not.
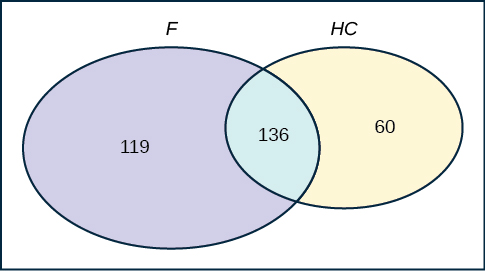
After Rob Ford, the mayor of Toronto, announced his plans to cut budget costs in late 2011, the Forum Research polled 1,046 people to measure the mayor’s popularity. Everyone polled expressed either approval or disapproval. These are the results their poll produced:
- In early 2011, 60 percent of the population approved of Mayor Ford’s actions in office.
- In mid-2011, 57 percent of the population approved of his actions.
- In late 2011, the percentage of popular approval was measured at 42 percent.
- What is the sample size for this study?
- What proportion in the poll disapproved of Mayor Ford, according to the results from late 2011?
- How many people polled responded that they approved of Mayor Ford in late 2011?
- What is the probability that a person supported Mayor Ford, based on the data collected in mid-2011?
- What is the probability that a person supported Mayor Ford, based on the data collected in early 2011?
- The Forum Research surveyed 1,046 Torontonians.
- 42% of 1,046 = 439 (rounding to the nearest integer)
Use the following information to answer the next three exercises. The casino game, roulette, allows the gambler to bet on the probability of a ball, which spins in the roulette wheel, landing on a particular color, number, or range of numbers. The table used to place bets contains 38 numbers, and each number is assigned to a color and a range.

- List the sample space of the 38 possible outcomes in roulette.
- You bet on red. Find P (red).
- You bet on -1st 12- (1st Dozen). Find P (-1st 12-).
- You bet on an even number. Find P (even number).
- Is getting an odd number the complement of getting an even number? Why?
- Find two mutually exclusive events.
- Are the events Even and 1st Dozen independent?
Compute the probability of winning the following types of bets:
- Betting on two lines that touch each other on the table as in 1-2-3-4-5-6
- Betting on three numbers in a line, as in 1-2-3
- Betting on one number
- Betting on four numbers that touch each other to form a square, as in 10-11-13-14
- Betting on two numbers that touch each other on the table, as in 10-11 or 10-13
- Betting on 0-00-1-2-3
- Betting on 0-1-2; or 0-00-2; or 00-2-3
- P (Betting on two line that touch each other on the table) = [latex]\frac{6}{38}[/latex]
- P (Betting on three numbers in a line) = [latex]\frac{3}{38}[/latex]
- P (Betting on one number) = [latex]\frac{1}{38}[/latex]
- P (Betting on four number that touch each other to form a square) = [latex]\frac{4}{38}[/latex]
- P (Betting on two number that touch each other on the table) = [latex]\frac{2}{38}[/latex]
- P (Betting on 0-00-1-2-3) = [latex]\frac{5}{38}[/latex]
- P (Betting on 0-1-2; or 0-00-2; or 00-2-3) = [latex]\frac{3}{38}[/latex]
- Betting on a color
- Betting on one of the dozen groups
- Betting on the range of numbers from 1 to 18
- Betting on the range of numbers 19–36
- Betting on one of the columns
- Betting on an even or odd number (excluding zero)
Suppose that you have eight cards. Five are green and three are yellow. The five green cards are numbered 1, 2, 3, 4, and 5. The three yellow cards are numbered 1, 2, and 3. The cards are well shuffled. You randomly draw one card.
- G = card drawn is green
- List the sample space.
- P ( G ) = _____
- P ( G | E ) = _____
- P ( G AND E ) = _____
- P ( G OR E ) = _____
- Are G and E mutually exclusive? Justify your answer numerically.
- { G 1, G 2, G 3, G 4, G 5, Y 1, Y 2, Y 3}
- [latex]\frac{5}{8}\text{}[/latex]
- [latex]\frac{2}{3}\text{}[/latex]
- [latex]\frac{2}{8}\text{}[/latex]
- [latex]\frac{6}{8}\text{}[/latex]
- No, because P ( G AND E ) does not equal 0.
Roll two fair dice. Each die has six faces.
- Let A be the event that either a three or four is rolled first, followed by an even number. Find P ( A ).
- Let B be the event that the sum of the two rolls is at most seven. Find P ( B ).
- In words, explain what “ P ( A | B )” represents. Find P ( A | B ).
- Are A and B mutually exclusive events? Explain your answer in one to three complete sentences, including numerical justification.
- Are A and B independent events? Explain your answer in one to three complete sentences, including numerical justification.
A special deck of cards has ten cards. Four are green, three are blue, and three are red. When a card is picked, its color is recorded. An experiment consists of first picking a card and then tossing a coin.
- Let A be the event that a blue card is picked first, followed by landing a head on the coin toss. Find P ( A ).
- Let B be the event that a red or green is picked, followed by landing a head on the coin toss. Are the events A and B mutually exclusive? Explain your answer in one to three complete sentences, including numerical justification.
- Let C be the event that a red or blue is picked, followed by landing a head on the coin toss. Are the events A and C mutually exclusive? Explain your answer in one to three complete sentences, including numerical justification.
The coin toss is independent of the card picked first.
- {( G , H ) ( G , T ) ( B , H ) ( B , T ) ( R , H ) ( R , T )}
- P ( A ) = P (blue) P (head) = [latex]\left(\frac{3}{10}\right)[/latex][latex]\left(\frac{1}{2}\right)[/latex] = [latex]\frac{3}{20}[/latex]
- Yes, A and B are mutually exclusive because they cannot happen at the same time; you cannot pick a card that is both blue and also (red or green). P ( A AND B ) = 0
- No, A and C are not mutually exclusive because they can occur at the same time. In fact, C includes all of the outcomes of A ; if the card chosen is blue it is also (red or blue). P ( A AND C ) = P ( A ) = [latex]\frac{3}{20}[/latex]
An experiment consists of first rolling a die and then tossing a coin.
- Let A be the event that either a three or a four is rolled first, followed by landing a head on the coin toss. Find P ( A ).
- Let B be the event that the first and second tosses land on heads. Are the events A and B mutually exclusive? Explain your answer in one to three complete sentences, including numerical justification.
An experiment consists of tossing a nickel, a dime, and a quarter. Of interest is the side the coin lands on.
- Let A be the event that there are at least two tails. Find P ( A ).
- Let B be the event that the first and second tosses land on heads. Are the events A and B mutually exclusive? Explain your answer in one to three complete sentences, including justification.
- S = {( HHH ), ( HHT ), ( HTH ), ( HTT ), ( THH ), ( THT ), ( TTH ), ( TTT )}
- [latex]\frac{4}{8}[/latex]
- Yes, because if A has occurred, it is impossible to obtain two tails. In other words, P ( A AND B ) = 0.
Consider the following scenario:
Let P ( C ) = 0.4.
Let P ( D ) = 0.5.
Let P ( C | D ) = 0.6.
Y and Z are independent events.
- Rewrite the basic Addition Rule P ( Y OR Z ) = P ( Y ) + P ( Z ) – P ( Y AND Z ) using the information that Y and Z are independent events.
- Use the rewritten rule to find P ( Z ) if P ( Y OR Z ) = 0.71 and P ( Y ) = 0.42.
- If Y and Z are independent, then P ( Y AND Z ) = P ( Y ) P ( Z ), so P ( Y OR Z ) = P ( Y ) + P ( Z ) – P ( Y ) P ( Z ).
G and H are mutually exclusive events. P ( G ) = 0.5 P ( H ) = 0.3
- Explain why the following statement MUST be false: P ( H | G ) = 0.4.
- Are G and H independent or dependent events? Explain in a complete sentence.
Approximately 281,000,000 people over age five live in the United States. Of these people, 55,000,000 speak a language other than English at home. Of those who speak another language at home, 62.3% speak Spanish.
Let: E = speaks English at home; E′ = speaks another language at home; S = speaks Spanish;
Finish each probability statement by matching the correct answer.
iii i iv ii
1994, the U.S. government held a lottery to issue 55,000 Green Cards (permits for non-citizens to work legally in the U.S.). Renate Deutsch, from Germany, was one of approximately 6.5 million people who entered this lottery. Let G = won green card.
- What was Renate’s chance of winning a Green Card? Write your answer as a probability statement.
- In the summer of 1994, Renate received a letter stating she was one of 110,000 finalists chosen. Once the finalists were chosen, assuming that each finalist had an equal chance to win, what was Renate’s chance of winning a Green Card? Write your answer as a conditional probability statement. Let F = was a finalist.
- Are G and F independent or dependent events? Justify your answer numerically and also explain why.
- Are G and F mutually exclusive events? Justify your answer numerically and explain why.
Three professors at George Washington University did an experiment to determine if economists are more selfish than other people. They dropped 64 stamped, addressed envelopes with 💲10 cash in different classrooms on the George Washington campus. 44% were returned overall. From the economics classes 56% of the envelopes were returned. From the business, psychology, and history classes 31% were returned.
Let: R = money returned; E = economics classes; O = other classes
- Write a probability statement for the overall percent of money returned.
- Write a probability statement for the percent of money returned out of the economics classes.
- Write a probability statement for the percent of money returned out of the other classes.
- Is money being returned independent of the class? Justify your answer numerically and explain it.
- Based upon this study, do you think that economists are more selfish than other people? Explain why or why not. Include numbers to justify your answer.
- P ( R ) = 0.44
- P ( R | E ) = 0.56
- P ( R | O ) = 0.31
- No, whether the money is returned is not independent of which class the money was placed in. There are several ways to justify this mathematically, but one is that the money placed in economics classes is not returned at the same overall rate; P ( R | E ) ≠ P ( R ).
- No, this study definitely does not support that notion; in fact , it suggests the opposite. The money placed in the economics classrooms was returned at a higher rate than the money place in all classes collectively; P ( R | E ) > P ( R ).
The following table of data obtained from www.baseball-almanac.com shows hit information for four players. Suppose that one hit from the table is randomly selected.
Are “the hit being made by Hank Aaron” and “the hit being a double” independent events?
- Yes, because P (hit by Hank Aaron|hit is a double) = P (hit by Hank Aaron)
- No, because P (hit by Hank Aaron|hit is a double) ≠ P (hit is a double)
- No, because P (hit is by Hank Aaron|hit is a double) ≠ P (hit by Hank Aaron)
- Yes, because P (hit is by Hank Aaron|hit is a double) = P (hit is a double)
United Blood Services is a blood bank that serves more than 500 hospitals in 18 states. According to their website, a person with type O blood and a negative Rh factor (Rh-) can donate blood to any person with any blood type. Their data show that 43% of people have type O blood and 15% of people have Rh- factor; 52% of people have type O or Rh- factor.
- Find the probability that a person has both type O blood and the Rh- factor.
- Find the probability that a person does NOT have both type O blood and the Rh- factor.
P (type O OR Rh-) = P (type O) + P (Rh-) – P (type O AND Rh-)
0.52 = 0.43 + 0.15 – P (type O AND Rh-); solve to find P (type O AND Rh-) = 0.06
6% of people have type O, Rh- blood
P (NOT(type O AND Rh-)) = 1 – P (type O AND Rh-) = 1 – 0.06 = 0.94
94% of people do not have type O, Rh- blood
At a college, 72% of courses have final exams and 46% of courses require research papers. Suppose that 32% of courses have a research paper and a final exam. Let F be the event that a course has a final exam. Let R be the event that a course requires a research paper.
- Find the probability that a course has a final exam or a research project.
- Find the probability that a course has NEITHER of these two requirements.
In a box of assorted cookies, 36% contain chocolate and 12% contain nuts. Of those, 8% contain both chocolate and nuts. Sean is allergic to both chocolate and nuts.
- Find the probability that a cookie contains chocolate or nuts (he can’t eat it).
- Find the probability that a cookie does not contain chocolate or nuts (he can eat it).
- Let C = be the event that the cookie contains chocolate. Let N = the event that the cookie contains nuts.
- P ( C OR N ) = P ( C ) + P ( N ) – P ( C AND N ) = 0.36 + 0.12 – 0.08 = 0.40
- P (NEITHER chocolate NOR nuts) = 1 – P ( C OR N ) = 1 – 0.40 = 0.60
A college finds that 10% of students have taken a distance learning class and that 40% of students are part time students. Of the part time students, 20% have taken a distance learning class. Let D = event that a student takes a distance learning class and E = event that a student is a part time student
- Find P ( D AND E ).
- Find P ( E | D ).
- Find P ( D OR E ).
- Using an appropriate test, show whether D and E are independent.
- Using an appropriate test, show whether D and E are mutually exclusive.
Section 3.4
Use the information in the [link] to answer the next eight exercises. The table shows the political party affiliation of each of 67 members of the US Senate in June 2012, and when they are up for reelection.
What is the probability that a randomly selected senator has an “Other” affiliation?
What is the probability that a randomly selected senator is up for reelection in November 2016?
What is the probability that a randomly selected senator is a Democrat and up for reelection in November 2016?
[latex]\frac{10}{67}[/latex]
What is the probability that a randomly selected senator is a Republican or is up for reelection in November 2014?
Suppose that a member of the US Senate is randomly selected. Given that the randomly selected senator is up for reelection in November 2016, what is the probability that this senator is a Democrat?
[latex]\frac{10}{34}[/latex]
Suppose that a member of the US Senate is randomly selected. What is the probability that the senator is up for reelection in November 2014, knowing that this senator is a Republican?
The events “Republican” and “Up for reelection in 2016” are ________
- mutually exclusive.
- independent.
- both mutually exclusive and independent.
- neither mutually exclusive nor independent.
The events “Other” and “Up for reelection in November 2016” are ________
[link] gives the number of suicides estimated in the U.S. for a recent year by age, race (black or white), and sex. We are interested in possible relationships between age, race, and sex. We will let suicide victims be our population.
Do not include “all others” for parts f and g.
- [latex]\frac{\text{22,050}}{\text{29,760}}[/latex]
- [latex]\frac{\text{330}}{\text{29,760}}[/latex]
- [latex]\frac{\text{2,000}}{\text{29,760}}[/latex]
- [latex]\frac{\text{23,720}}{\text{29,760}}[/latex]
- [latex]\frac{\text{5,010}}{\text{6,020}}[/latex]
Use the following information to answer the next two exercises. The table of data obtained from www.baseball-almanac.com shows hit information for four well known baseball players. Suppose that one hit from the table is randomly selected.
Find P (hit was made by Babe Ruth).
- [latex]\frac{1518}{2873}[/latex]
- [latex]\frac{2873}{12351}[/latex]
- [latex]\frac{583}{12351}[/latex]
- [latex]\frac{4189}{12351}[/latex]
Find P (hit was made by Ty Cobb|The hit was a Home Run).
- [latex]\frac{114}{1720}[/latex]
- [latex]\frac{1720}{4189}[/latex]
- [latex]\frac{114}{12351}[/latex]
[link] identifies a group of children by one of four hair colors, and by type of hair.
- Complete the table.
- What is the probability that a randomly selected child will have wavy hair?
- What is the probability that a randomly selected child will have either brown or blond hair?
- What is the probability that a randomly selected child will have wavy brown hair?
- What is the probability that a randomly selected child will have red hair, given that he or she has straight hair?
- If B is the event of a child having brown hair, find the probability of the complement of B .
- In words, what does the complement of B represent?
In a previous year, the weights of the members of the San Francisco 49ers and the Dallas Cowboys were published in the San Jose Mercury News . The factual data were compiled into the following table.
- [latex]\frac{26}{106}[/latex]
- [latex]\frac{33}{106}[/latex]
- [latex]\frac{21}{106}[/latex]
- [latex]\left(\frac{26}{106}\right)[/latex] + [latex]\left(\frac{33}{106}\right)[/latex] – [latex]\left(\frac{21}{106}\right)[/latex] = [latex]\left(\frac{38}{106}\right)[/latex]
- [latex]\frac{21}{33}[/latex]
Use the following information to answer the next seven exercises. An article in the New England Journal of Medicine , reported about a study of smokers in California and Hawaii. In one part of the report, the self-reported ethnicity and smoking levels per day were given. Of the people smoking at most ten cigarettes per day, there were 9,886 African Americans, 2,745 Native Hawaiians, 12,831 Latinos, 8,378 Japanese Americans, and 7,650 Whites. Of the people smoking 11 to 20 cigarettes per day, there were 6,514 African Americans, 3,062 Native Hawaiians, 4,932 Latinos, 10,680 Japanese Americans, and 9,877 Whites. Of the people smoking 21 to 30 cigarettes per day, there were 1,671 African Americans, 1,419 Native Hawaiians, 1,406 Latinos, 4,715 Japanese Americans, and 6,062 Whites. Of the people smoking at least 31 cigarettes per day, there were 759 African Americans, 788 Native Hawaiians, 800 Latinos, 2,305 Japanese Americans, and 3,970 Whites.
Complete the table using the data provided. Suppose that one person from the study is randomly selected. Find the probability that person smoked 11 to 20 cigarettes per day.
Suppose that one person from the study is randomly selected. Find the probability that person smoked 11 to 20 cigarettes per day.
[latex]\frac{35,065}{100,450}[/latex]
Find the probability that the person was Latino.
In words, explain what it means to pick one person from the study who is “Japanese American AND smokes 21 to 30 cigarettes per day.” Also, find the probability.
To pick one person from the study who is Japanese American AND smokes 21 to 30 cigarettes per day means that the person has to meet both criteria: both Japanese American and smokes 21 to 30 cigarettes. The sample space should include everyone in the study. The probability is [latex]\frac{4,715}{100,450}[/latex].
In words, explain what it means to pick one person from the study who is “Japanese American OR smokes 21 to 30 cigarettes per day.” Also, find the probability.
In words, explain what it means to pick one person from the study who is “Japanese American GIVEN that person smokes 21 to 30 cigarettes per day.” Also, find the probability.
To pick one person from the study who is Japanese American given that person smokes 21-30 cigarettes per day, means that the person must fulfill both criteria and the sample space is reduced to those who smoke 21-30 cigarettes per day. The probability is [latex]\frac{4715}{15,273}[/latex].
Prove that smoking level/day and ethnicity are dependent events.
Use the following information to answer the next two exercises. This tree diagram shows the tossing of an unfair coin followed by drawing one bead from a cup containing three red ( R ), four yellow ( Y ) and five blue ( B ) beads. For the coin, P ( H ) = [latex]\frac{2}{3}[/latex] and P ( T ) = [latex]\frac{1}{3}[/latex] where H is heads and T is tails.

Find P (tossing a Head on the coin AND a Red bead)
- [latex]\frac{2}{3}[/latex]
- [latex]\frac{5}{15}[/latex]
- [latex]\frac{6}{36}[/latex]
- [latex]\frac{5}{36}[/latex]
Find P (Blue bead).
- [latex]\frac{15}{36}[/latex]
- [latex]\frac{10}{36}[/latex]
- [latex]\frac{10}{12}[/latex]
A box of cookies contains three chocolate and seven butter cookies. Miguel randomly selects a cookie and eats it. Then he randomly selects another cookie and eats it. (How many cookies did he take?)
- Draw the tree that represents the possibilities for the cookie selections. Write the probabilities along each branch of the tree.
- Are the probabilities for the flavor of the SECOND cookie that Miguel selects independent of his first selection? Explain.
- For each complete path through the tree, write the event it represents and find the probabilities.
- Let S be the event that both cookies selected were the same flavor. Find P ( S ).
- Let T be the event that the cookies selected were different flavors. Find P ( T ) by two different methods: by using the complement rule and by using the branches of the tree. Your answers should be the same with both methods.
- Let U be the event that the second cookie selected is a butter cookie. Find P ( U ).
Use the following information to answer the next two exercises. Suppose that you have eight cards. Five are green and three are yellow. The cards are well shuffled.
Suppose that you randomly draw two cards, one at a time, with replacement .
Let G 1 = first card is green
Let G 2 = second card is green
- Draw a tree diagram of the situation.
- Find P ( G 1 AND G 2 ).
- Find P (at least one green).
- Find P ( G 2 | G 1 ).
- Are G 2 and G 1 independent events? Explain why or why not.

- P ( GG ) = [latex]\left(\frac{5}{8}\right)\left(\frac{5}{8}\right)[/latex] = [latex]\frac{25}{64}[/latex]
- P (at least one green) = P ( GG ) + P ( GY ) + P ( YG ) = [latex]\frac{25}{64}[/latex] + [latex]\frac{15}{64}[/latex] + [latex]\frac{15}{64}[/latex] = [latex]\frac{55}{64}[/latex]
- P ( G | G ) = [latex]\frac{5}{8}[/latex]
- Yes, they are independent because the first card is placed back in the bag before the second card is drawn; the composition of cards in the bag remains the same from draw one to draw two.
Suppose that you randomly draw two cards, one at a time, without replacement .
G 1 = first card is green
G 2 = second card is green
Use the following information to answer the next two exercises. The percent of licensed U.S. drivers (from a recent year) that are female is 48.60. Of the females, 5.03% are age 19 and under; 81.36% are age 20–64; 13.61% are age 65 or over. Of the licensed U.S. male drivers, 5.04% are age 19 and under; 81.43% are age 20–64; 13.53% are age 65 or over.
Complete the following.
- Construct a table or a tree diagram of the situation.
- Find P (driver is female).
- Find P (driver is age 65 or over|driver is female).
- Find P (driver is age 65 or over AND female).
- In words, explain the difference between the probabilities in part c and part d.
- Find P (driver is age 65 or over).
- Are being age 65 or over and being female mutually exclusive events? How do you know?
- P ( F ) = 0.486
- P (>64| F ) = 0.1361
- P (>64 and F ) = P ( F ) P (>64| F ) = (0.486)(0.1361) = 0.0661
- P (>64| F ) is the percentage of female drivers who are 65 or older and P (>64 and F ) is the percentage of drivers who are female and 65 or older.
- P (> 64 ) = P (>64 and F ) + P (>64 and M ) = 0.1356
- No, being female and 65 or older are not mutually exclusive because they can occur at the same time P(>64 and F ) = 0.0661.
Suppose that 10,000 U.S. licensed drivers are randomly selected.
- How many would you expect to be male?
- Using the table or tree diagram, construct a contingency table of gender versus age group.
- Using the contingency table, find the probability that out of the age 20–64 group, a randomly selected driver is female.
Approximately 86.5% of Americans commute to work by car, truck, or van. Out of that group, 84.6% drive alone and 15.4% drive in a carpool. Approximately 3.9% walk to work and approximately 5.3% take public transportation.
- Construct a table or a tree diagram of the situation. Include a branch for all other modes of transportation to work.
- Assuming that the walkers walk alone, what percent of all commuters travel alone to work?
- Suppose that 1,000 workers are randomly selected. How many would you expect to travel alone to work?
- Suppose that 1,000 workers are randomly selected. How many would you expect to drive in a carpool?
- If we assume that all walkers are alone and that none from the other two groups travel alone (which is a big assumption) we have: P (Alone) = 0.7318 + 0.0390 = 0.7708.
- Make the same assumptions as in (b) we have: (0.7708)(1,000) = 771
- (0.1332)(1,000) = 133
When the Euro coin was introduced in 2002, two math professors had their statistics students test whether the Belgian one Euro coin was a fair coin. They spun the coin rather than tossing it and found that out of 250 spins, 140 showed a head (event H ) while 110 showed a tail (event T ). On that basis, they claimed that it is not a fair coin.
- Based on the given data, find P ( H ) and P ( T ).
- Use a tree to find the probabilities of each possible outcome for the experiment of tossing the coin twice.
- Use the tree to find the probability of obtaining exactly one head in two tosses of the coin.
- Use the tree to find the probability of obtaining at least one head.
Use the following information to answer the next two exercises. The following are real data from Santa Clara County, CA. As of a certain time, there had been a total of 3,059 documented cases of AIDS in the county. They were grouped into the following categories:
Suppose a person with AIDS in Santa Clara County is randomly selected.
- Find P (Person is female).
- Find P (Person has a risk factor heterosexual contact).
- Find P (Person is female OR has a risk factor of IV drug user).
- Find P (Person is female AND has a risk factor of homosexual/bisexual).
- Find P (Person is male AND has a risk factor of IV drug user).
- Find P (Person is female GIVEN person got the disease from heterosexual contact).
- Construct a Venn diagram. Make one group females and the other group heterosexual contact.
The completed contingency table is as follows:
- [latex]\frac{255}{3059}[/latex]
- [latex]\frac{196}{3059}[/latex]
- [latex]\frac{718}{3059}[/latex]
- [latex]\frac{463}{3059}[/latex]
- [latex]\frac{136}{196}[/latex]
Answer these questions using probability rules. Do NOT use the contingency table. Three thousand fifty-nine cases of AIDS had been reported in Santa Clara County, CA, through a certain date. Those cases will be our population. Of those cases, 6.4% obtained the disease through heterosexual contact and 7.4% are female. Out of the females with the disease, 53.3% got the disease from heterosexual contact.
- Find P (Person obtained the disease through heterosexual contact).
- Find P (Person is female GIVEN person got the disease from heterosexual contact)
- Construct a Venn diagram representing this situation. Make one group females and the other group heterosexual contact. Fill in all values as probabilities.
Introductory Statistics Copyright © 2024 by LOUIS: The Louisiana Library Network is licensed under a Creative Commons Attribution-ShareAlike 4.0 International License , except where otherwise noted.
Share This Book
Please ensure that your password is at least 8 characters and contains each of the following:
- a special character: @$#!%*?&
Cookies on GOV.UK
We use some essential cookies to make this website work.
We’d like to set additional cookies to understand how you use GOV.UK, remember your settings and improve government services.
We also use cookies set by other sites to help us deliver content from their services.
You have accepted additional cookies. You can change your cookie settings at any time.
You have rejected additional cookies. You can change your cookie settings at any time.
- Entering and staying in the UK
- Border control
- Immigration system statistics, year ending March 2024
- Home Office
Why do people come to the UK? To study
Published 23 May 2024

© Crown copyright 2024
This publication is licensed under the terms of the Open Government Licence v3.0 except where otherwise stated. To view this licence, visit nationalarchives.gov.uk/doc/open-government-licence/version/3 or write to the Information Policy Team, The National Archives, Kew, London TW9 4DU, or email: [email protected] .
Where we have identified any third party copyright information you will need to obtain permission from the copyright holders concerned.
This publication is available at https://www.gov.uk/government/statistics/immigration-system-statistics-year-ending-march-2024/why-do-people-come-to-the-uk-to-study
Back to ‘Immigration system statistics, year ending March 2024’ contents page .
Data relates to the year ending March 2024 and all comparisons are with the year ending March 2023 (unless indicated otherwise). All data includes dependants, unless indicated otherwise.
1. Sponsored study visas
In the year ending March 2024, there were 446,924 sponsored study visas granted to main applicants, 6% fewer than in the year ending March 2023 but 66% higher than 2019, prior to the onset of the COVID-19 pandemic.
Between 2011 and 2016 sponsored study visa grants to main applicants were relatively stable at around 200,000 per year (see Figure 1). After 2016 the numbers steadily increased, reaching 268,674 in 2019. Following a fall in numbers during the COVID-19 pandemic, the number of visas issued have subsequently increased sharply, reaching a peak of 498,626 in the year ending June 2023. The number of visas issued in the latest year are slightly lower than the peak, at 446,924.
The large increase between mid-2020 and mid-2023 was in part due to immigration levels increasing as COVID-19 related restrictions were eased and followed the UK’s departure from the EU which ended free movement for many EEA nationals (excluding those with status on the EU Settlement Scheme) and introduced a new Immigration System.
In the year ending March 2024 there were 111,481 visas issued to student dependants, 25% fewer compared to the previous year but almost 7 times higher than in 2019.
The decrease in dependants of students follows a recent policy change for courses starting on or after 1 January 2024, where only researched-based postgraduate students are allowed to bring dependants (partners and children) to the UK. The number of sponsored study dependent visas granted in quarter one (January to March) of 2024 fell by 80%, compared to the same period in 2023, to 7,908. Over the same period, the number of main applicants granted a visa decreased by 22% to 37,451. Policy changes are one of a number of factors that may have impacted visa application volumes and it will be necessary to await the peak in student applications for the next academic year (which usually comes in August/September) before we can see the full effect of recent policy changes and any other impacts.
Figure 1: Sponsored study visas granted by applicant type, between the year ending March 2011 and the year ending March 2024
Source: Entry clearance visa applications and outcomes – Vis_D02
Figure 1 shows sharp increases in both the number of main applicant and dependant visas granted, following the COVID-19 pandemic and UK’s departure from the EU . The number of dependants has grown at a faster rate than main applicants in recent years. The numbers peaked in the year ending March 2023 with around 3 dependants for every 10 main applicants. However, the number of main applicants and dependants have since fallen with dependants decreasing at a faster rate in the first quarter (January to March) of 2024. In the year ending March 2024, one-fifth (20%) of sponsored study visas were issued to dependants.
Figure 2: Sponsored study visas granted to the top 5 nationalities (main applicants), between the year ending March 2019 and the year ending March 2024
Figure 2 shows that most of the increase in main applicants between 2019 and 2023 were from Indian and Nigerian nationals, but numbers for these nationalities have fallen in the latest year (by 16% and 38% respectively).
There were 116,455 sponsored study visa grants to main applicants that are Indian nationals in the year ending March 2024, (26% of the total), 21,717 fewer than the previous year. The majority (94,149, or 81%) of Indian students come to the UK to study at masters level and the recent decrease in Indian students was driven by 21,800 fewer Indian nationals coming to study at masters level. Chinese nationals are the second most common nationality granted sponsored study visas (108,582), accounting for 24% of the total, with the majority (63,027, 58%) also studying at masters level.
Figure 3: Student visas granted to main applicants by course level, between the year ending March 2019 and the year ending March 2024
Source: Sponsored study visas by course level – Edu_D02
‘Other and unknown’ includes visas issued to courses below bachelors level, pre-sessional English courses, courses not able to be identified, and a small number of visas which couldn’t be matched to a Confirmation of Acceptance for Studies.
Does not include child student routes.
Figure 3 shows that two-thirds (66%) of student visas granted in the year ending March 2024 were for masters level courses. The number of grants to students coming to study at masters level has increased each year between the year ending March 2019 (prior to the pandemic) and the year ending March 2023 (to 313,670), but fell slightly in the latest year to 283,595.
After masters, the most common level for student visas granted to main applicants was bachelors with 106,544 grants (25% of the total). The number of visas granted for bachelors level courses are higher than pre-pandemic levels, but have remained stable in the last few years.
Visas for students at doctoral level or other course levels made up a smaller proportion (9%) of grants in the latest year.
2. Extensions of Study
The Graduate route allows students who have successfully completed a bachelor’s degree, postgraduate degree or other eligible course to stay in the UK for a period after their studies to work or look for work. Statistics on extensions granted on the Graduate route are included in ‘Why do people come to the UK? To work’ .
The Home Office have also published a report ‘Analysis of migrants use of the Graduate route’ on the 14 May 2024, providing an in-depth analysis of those who enter and leave the Graduate route using Migrant Journey data and insights on earnings by linking Home Office visa records to HMRC income data. This report complements the Migration Advisory Committee’s (MAC’s) ‘Rapid Review of the Graduate Route’ published on the same date.
In the year ending March 2024, grants of extensions into Sponsored study routes for main applicants decreased by 38% to 35,175, compared with the year ending March 2023, (56,736).
In the year ending March 2024, a total of 41,983 extensions were granted into Sponsored study routes, for all applicants. Of these, 84% (35,175) were to main applicants, and 16% (6,808) were to dependants.
Analysis linking the current category of leave to the previous category of leave shows that of the main applicants granted a study visa extension in the year ending March 2024, 87% held a study visa before their current study extension was granted. A further 9% previously held a work visa, and the remaining 4% previously held a visa in the Other or Unknown categories.
Analysis from the Migrant Journey: 2023 report shows that most foreign students do not remain in the UK indefinitely. Since 2007, fewer than 10% of people who came to study in the UK had indefinite leave to remain 10 years later (compared to over 20% who came for work and over 80% for family reasons). The 2020 cohort is the first for which students of any course length could transfer directly to the graduate route. For this cohort of students 57% still held valid or indefinite leave 3 years later, at the end of 2023, compared to 39% in the 2019 cohort and 34% for students arriving between 2011 and 2018.
3. About these statistics
The statistics in this section provide an indication of the number of people who have an intention to enter the UK for study reasons. Further information on the statistics in this section can be found in the user guide . Before 2021, due to freedom of movement for European Union ( EU ) nationals, the vast majority of UK immigration control statistics related to non-European Economic Area ( EEA ) nationals. From 2021, unless otherwise stated, the statistics in this release relate to both EEA and non- EEA nationals.
Entry clearance visas allow an individual to enter and stay in the UK within the period for which the visa is valid. Data in this section refers to the number of Entry clearance visas granted for study reasons within the period. If an individual was granted a visa more than once in a given period, this has been counted as multiple grants in the statistics.
Year-on-year comparisons of the number of decisions can be affected by quarterly fluctuations in the data. These fluctuations can be examined in the quarterly data in the published tables. Year ending comparisons will also include impacts resulting from the travel restrictions put in place during the COVID-19 pandemic.
3.1 Confirmation of Acceptance for Studies
In order to be granted a sponsored study visa, a main applicant must get a ‘Confirmation of Acceptance for Studies’ ( CAS ) from their educational provider as evidence of an unconditional offer to study a course with a licensed student sponsor. Around 9 in 10 sponsored study visa applications are for the Higher Education Sector (such as universities), which has accounted for most of the growth in students in recent years.
3.2 Extension of temporary stay in the UK
Extensions of temporary stay in the UK relate to individuals inside the UK extending or changing the status of their right to stay in the UK. An individual is required to apply for an extension or change in status before their existing permission to enter or stay in the UK expires.
The statistics in this section show the number of grants and refusals on applications for extension of temporary stay in the UK. One individual may have made multiple applications for an extension, so may account for multiple decisions. Data in this section account for the outcomes of reconsiderations and appeals. The statistics do not show the number of people applying to extend their temporary stay in the UK, nor do they show how long an individual stayed in the UK following their extension.
3.3 Other sources
The Office for National Statistics ( ONS ) publish long-term international migration estimates . These are statistics under development that estimate the number of people immigrating to and emigrating from the UK for 12 months or more.
In January 2023, HESA published its latest ‘Higher Education Student Statistics UK’ for the academic year 2021 to 2022. HESA publishes data on new entrants to UK higher education providers for both EEA and non- EEA nationals.
In December 2023, the Migration Advisory Committee (MAC) published their fourth annual report . This report includes analysis of how the immigration system is being used within and across the nations of the UK.
4. Data tables
Data on student immigration can be found in the following tables:
- Entry clearance visas summary tables
- Detailed Entry clearance visa datasets
- Sponsorship summary tables
- Detailed sponsorship datasets
- Detailed education datasets
- Admissions summary tables
- Extensions summary tables
- Detailed extensions datasets
- Migrant journey summary tables
- Migrant journey: 2023 dataset
We welcome your feedback
If you have any comments or suggestions for the development of this report, please provide feedback by emailing [email protected] . Please include the words ‘PUBLICATION FEEDBACK’ in the subject of your email.
We’re always looking to improve the accessibility of our documents. If you find any problems or have any feedback relating to accessibility, please email us.
See section 6 of the ‘About this release’ section for more details.
Is this page useful?
- Yes this page is useful
- No this page is not useful
Help us improve GOV.UK
Don’t include personal or financial information like your National Insurance number or credit card details.
To help us improve GOV.UK, we’d like to know more about your visit today. Please fill in this survey (opens in a new tab) .
2.1 Stem-and-Leaf Graphs (Stemplots), Line Graphs, and Bar Graphs
Student grades on a chemistry exam were: 77, 78, 76, 81, 86, 51, 79, 82, 84, 99
- Construct a stem-and-leaf plot of the data.
- Are there any potential outliers? If so, which scores are they? Why do you consider them outliers?
Table 2.61 contains the 2010 obesity rates in U.S. states and Washington, DC.
- Use a random number generator to randomly pick eight states. Construct a bar graph of the obesity rates of those eight states.
- Construct a bar graph for all the states beginning with the letter "A."
- Construct a bar graph for all the states beginning with the letter "M."
2.2 Histograms, Frequency Polygons, and Time Series Graphs
Suppose that three book publishers were interested in the number of fiction paperbacks adult consumers purchase per month. Each publisher conducted a survey. In the survey, adult consumers were asked the number of fiction paperbacks they had purchased the previous month. The results are as follows:
- Find the relative frequencies for each survey. Write them in the charts.
- Using either a graphing calculator, computer, or by hand, use the frequency column to construct a histogram for each publisher's survey. For Publishers A and B, make bar widths of one. For Publisher C, make bar widths of two.
- In complete sentences, give two reasons why the graphs for Publishers A and B are not identical.
- Would you have expected the graph for Publisher C to look like the other two graphs? Why or why not?
- Make new histograms for Publisher A and Publisher B. This time, make bar widths of two.
- Now, compare the graph for Publisher C to the new graphs for Publishers A and B. Are the graphs more similar or more different? Explain your answer.
Often, cruise ships conduct all on-board transactions, with the exception of gambling, on a cashless basis. At the end of the cruise, guests pay one bill that covers all onboard transactions. Suppose that 60 single travelers and 70 couples were surveyed as to their on-board bills for a seven-day cruise from Los Angeles to the Mexican Riviera. Following is a summary of the bills for each group.
- Fill in the relative frequency for each group.
- Construct a histogram for the singles group. Scale the x -axis by $50 widths. Use relative frequency on the y -axis.
- Construct a histogram for the couples group. Scale the x -axis by $50 widths. Use relative frequency on the y -axis.
- List two similarities between the graphs.
- List two differences between the graphs.
- Overall, are the graphs more similar or different?
- Construct a new graph for the couples by hand. Since each couple is paying for two individuals, instead of scaling the x -axis by $50, scale it by $100. Use relative frequency on the y -axis.
- How did scaling the couples graph differently change the way you compared it to the singles graph?
- Based on the graphs, do you think that individuals spend the same amount, more or less, as singles as they do person by person as a couple? Explain why in one or two complete sentences.
Twenty-five randomly selected students were asked the number of movies they watched the previous week. The results are as follows.
- Construct a histogram of the data.
- Complete the columns of the chart.
Use the following information to answer the next two exercises: Suppose one hundred eleven people who shopped in a special t-shirt store were asked the number of t-shirts they own costing more than $19 each.
The percentage of people who own at most three t-shirts costing more than $19 each is approximately:
- Cannot be determined
If the data were collected by asking the first 111 people who entered the store, then the type of sampling is:
- simple random
- convenience
Following are the 2010 obesity rates by U.S. states and Washington, DC.
Construct a bar graph of obesity rates of your state and the four states closest to your state. Hint: Label the x -axis with the states.
2.3 Measures of the Location of the Data
The median age for Black people in the U.S. currently is 30.9 years; for U.S. White people it is 42.3 years.
- Based upon this information, give two reasons why the Black median age could be lower than the White median age.
- Does the lower median age for Black people necessarily mean that Blackpeople die younger than White people? Why or why not?
- How might it be possible for Black people and White people to die at approximately the same age, but for the median age for White people to be higher?
Six hundred adult Americans were asked by telephone poll, "What do you think constitutes a middle-class income?" The results are in Table 2.69 . Also, include left endpoint, but not the right endpoint.
- What percentage of the survey answered "not sure"?
- What percentage think that middle-class is from $25,000 to $50,000?
- Should all bars have the same width, based on the data? Why or why not?
- How should the <20,000 and the 100,000+ intervals be handled? Why?
- Find the 40 th and 80 th percentiles
- Construct a bar graph of the data
Given the following box plot:
- which quarter has the smallest spread of data? What is that spread?
- which quarter has the largest spread of data? What is that spread?
- find the interquartile range ( IQR ).
- are there more data in the interval 5–10 or in the interval 10–13? How do you know this?
- need more information
The following box plot shows the U.S. population for 1990, the latest available year.
- Are there fewer or more children (age 17 and under) than senior citizens (age 65 and over)? How do you know?
- 12.6% are age 65 and over. Approximately what percentage of the population are working age adults (above age 17 to age 65)?
2.4 Box Plots
In a survey of 20-year-olds in China, Germany, and the United States, people were asked the number of foreign countries they had visited in their lifetime. The following box plots display the results.
- In complete sentences, describe what the shape of each box plot implies about the distribution of the data collected.
- Have more Americans or more Germans surveyed been to over eight foreign countries?
- Compare the three box plots. What do they imply about the foreign travel of 20-year-old residents of the three countries when compared to each other?
Given the following box plot, answer the questions.
- Think of an example (in words) where the data might fit into the above box plot. In 2–5 sentences, write down the example.
- What does it mean to have the first and second quartiles so close together, while the second to third quartiles are far apart?
Given the following box plots, answer the questions.
- Data 1 has more data values above two than Data 2 has above two.
- The data sets cannot have the same mode.
- For Data 1 , there are more data values below four than there are above four.
- For which group, Data 1 or Data 2, is the value of “7” more likely to be an outlier? Explain why in complete sentences.
A survey was conducted of 130 purchasers of new BMW 3 series cars, 130 purchasers of new BMW 5 series cars, and 130 purchasers of new BMW 7 series cars. In it, people were asked the age they were when they purchased their car. The following box plots display the results.
- In complete sentences, describe what the shape of each box plot implies about the distribution of the data collected for that car series.
- Which group is most likely to have an outlier? Explain how you determined that.
- Compare the three box plots. What do they imply about the age of purchasing a BMW from the series when compared to each other?
- Look at the BMW 5 series. Which quarter has the smallest spread of data? What is the spread?
- Look at the BMW 5 series. Which quarter has the largest spread of data? What is the spread?
- Look at the BMW 5 series. Estimate the interquartile range (IQR).
- Look at the BMW 5 series. Are there more data in the interval 31 to 38 or in the interval 45 to 55? How do you know this?
Twenty-five randomly selected students were asked the number of movies they watched the previous week. The results are as follows:
Construct a box plot of the data.
2.5 Measures of the Center of the Data
The most obese countries in the world have obesity rates that range from 11.4% to 74.6%. This data is summarized in the following table.
- What is the best estimate of the average obesity percentage for these countries?
- The United States has an average obesity rate of 33.9%. Is this rate above average or below?
- How does the United States compare to other countries?
Table 2.72 gives the percent of children under five considered to be underweight. What is the best estimate for the mean percentage of underweight children?
2.6 Skewness and the Mean, Median, and Mode
The median age of the U.S. population in 1980 was 30.0 years. In 1991, the median age was 33.1 years.
- What does it mean for the median age to rise?
- Give two reasons why the median age could rise.
- For the median age to rise, is the actual number of children less in 1991 than it was in 1980? Why or why not?
2.7 Measures of the Spread of the Data
Use the following information to answer the next nine exercises: The population parameters below describe the full-time equivalent number of students (FTES) each year at Lake Tahoe Community College from 1976–1977 through 2004–2005.
- μ = 1000 FTES
- median = 1,014 FTES
- σ = 474 FTES
- first quartile = 528.5 FTES
- third quartile = 1,447.5 FTES
- n = 29 years
A sample of 11 years is taken. About how many are expected to have a FTES of 1014 or above? Explain how you determined your answer.
75% of all years have an FTES:
- at or below: _____
- at or above: _____
The population standard deviation = _____
What percent of the FTES were from 528.5 to 1447.5? How do you know?
What is the IQR ? What does the IQR represent?
How many standard deviations away from the mean is the median?
Additional Information: The population FTES for 2005–2006 through 2010–2011 was given in an updated report. The data are reported here.
Calculate the mean, median, standard deviation, the first quartile, the third quartile and the IQR . Round to one decimal place.
What additional information is needed to construct a box plot for the FTES for 2005-2006 through 2010-2011 and a box plot for the FTES for 1976-1977 through 2004-2005?
Compare the IQR for the FTES for 1976–77 through 2004–2005 with the IQR for the FTES for 2005-2006 through 2010–2011. Why do you suppose the IQR s are so different?
Three students were applying to the same graduate school. They came from schools with different grading systems. Which student had the best GPA when compared to other students at his school? Explain how you determined your answer.
A music school has budgeted to purchase three musical instruments. They plan to purchase a piano costing $3,000, a guitar costing $550, and a drum set costing $600. The mean cost for a piano is $4,000 with a standard deviation of $2,500. The mean cost for a guitar is $500 with a standard deviation of $200. The mean cost for drums is $700 with a standard deviation of $100. Which cost is the lowest, when compared to other instruments of the same type? Which cost is the highest when compared to other instruments of the same type. Justify your answer.
An elementary school class ran one mile with a mean of 11 minutes and a standard deviation of three minutes. Rachel, a student in the class, ran one mile in eight minutes. A junior high school class ran one mile with a mean of nine minutes and a standard deviation of two minutes. Kenji, a student in the class, ran 1 mile in 8.5 minutes. A high school class ran one mile with a mean of seven minutes and a standard deviation of four minutes. Nedda, a student in the class, ran one mile in eight minutes.
- Why is Kenji considered a better runner than Nedda, even though Nedda ran faster than he?
- Who is the fastest runner with respect to his or her class? Explain why.
The most obese countries in the world have obesity rates that range from 11.4% to 74.6%. This data is summarized in Table 14 .
What is the best estimate of the average obesity percentage for these countries? What is the standard deviation for the listed obesity rates? The United States has an average obesity rate of 33.9%. Is this rate above average or below? How “unusual” is the United States’ obesity rate compared to the average rate? Explain.
Table 2.76 gives the percent of children under five considered to be underweight.
What is the best estimate for the mean percentage of underweight children? What is the standard deviation? Which interval(s) could be considered unusual? Explain.
As an Amazon Associate we earn from qualifying purchases.
This book may not be used in the training of large language models or otherwise be ingested into large language models or generative AI offerings without OpenStax's permission.
Want to cite, share, or modify this book? This book uses the Creative Commons Attribution License and you must attribute OpenStax.
Access for free at https://openstax.org/books/introductory-statistics/pages/1-introduction
- Authors: Barbara Illowsky, Susan Dean
- Publisher/website: OpenStax
- Book title: Introductory Statistics
- Publication date: Sep 19, 2013
- Location: Houston, Texas
- Book URL: https://openstax.org/books/introductory-statistics/pages/1-introduction
- Section URL: https://openstax.org/books/introductory-statistics/pages/2-homework
© Jun 23, 2022 OpenStax. Textbook content produced by OpenStax is licensed under a Creative Commons Attribution License . The OpenStax name, OpenStax logo, OpenStax book covers, OpenStax CNX name, and OpenStax CNX logo are not subject to the Creative Commons license and may not be reproduced without the prior and express written consent of Rice University.
IMAGES
VIDEO
COMMENTS
213. 272. 190. 182. Range = 158 dollars. Standard Deviation (sample) = 52.9 dollars. Variance (sample) = 2796.8 dollars^2. Question = The measures of variation are not very useful because when searching for a room, low prices, location, and good accommodations are more important than the amount of variation in the area.
Introduction; 9.1 Null and Alternative Hypotheses; 9.2 Outcomes and the Type I and Type II Errors; 9.3 Distribution Needed for Hypothesis Testing; 9.4 Rare Events, the Sample, and the Decision and Conclusion; 9.5 Additional Information and Full Hypothesis Test Examples; 9.6 Hypothesis Testing of a Single Mean and Single Proportion; Key Terms; Chapter Review; Formula Review
Introduction; 9.1 Null and Alternative Hypotheses; 9.2 Outcomes and the Type I and Type II Errors; 9.3 Distribution Needed for Hypothesis Testing; 9.4 Rare Events, the Sample, and the Decision and Conclusion; 9.5 Additional Information and Full Hypothesis Test Examples; 9.6 Hypothesis Testing of a Single Mean and Single Proportion; Key Terms; Chapter Review; Formula Review
Statistics and Probability questions and answers; Homework: 3-2: Measures of Variation Save HW Score: 14.78 %, 14.93 of 101 pts Score: 0 of 10 pts 8 of 10 (3 complete) 3.2.24 Assigned Media EQuestion Help all customers enter a single waiting line and a bank where customers wait in individual lines at three different teller windows are listed below.
See Answer. Question: Introduction to Statistics Homework: Section 3.2 Homework HW Score: 8.33% 5 of 12 (1 complete) Score: 0 of 1 pt 3.2.17 Questio The following data represent exam scores in a statistics class taught using traditional lecture and a class taught using a "flipped classroom. Complete parts (a) through (c) below.
The percent of licensed U.S. drivers (from a recent year) that are female is 48.60. Of the females, 5.03% are age 19 and under; 81.36% are age 20-64; 13.61% are age 65 or over. Of the licensed U.S. male drivers, 5.04% are age 19 and under; 81.43% are age 20-64; 13.53% are age 65 or over. Complete the following.
The school plans to purchase a piano costing $3,000, a guitar costing $550, and a drum set costing $600. The mean cost for a piano is $4,000 with a standard deviation of $2,500. The mean cost for a guitar is $500 with a standard deviation of $200. The mean cost for drums is $700 with a standard deviation of $100.
Introduction to Statistics Homework: Section 3.2 Homework Score: 0 of 1 pt 2 of 12 (1 cc 3.2.5 Find the sample variance and standard deviation 19, 11, 2, 6, 10 Choose the correct answer below. Fill in the answer box to complete your choice. (Type an integer or a decimal. Round to one decimal place as needed.) A. 32 B. 02- Click to select and ...
Free math problem solver answers your statistics homework questions with step-by-step explanations. Mathway. Visit Mathway on the web. Start 7-day free trial on the app. Start 7-day free trial on the app. Download free on Amazon. Download free in Windows Store. get Go. Statistics. Basic Math. Pre-Algebra. Algebra. Trigonometry. Precalculus.
Step 2 of 6. The closure of the set is called the support of the distribution of x. Step 3 of 6. Every probability density function must satisfy the following condition. Step 4 of 6. For all x, and. Step 5 of 6. Step 6 of 6. Let X be a random variable with p.d.f. specified as.
Ch. 2 Bringing It Together: Homework - Introductory Statistics 2e | OpenStax. 108. A certain small town in the United states has a population of 27,873 people. Their ages are as follows: Age Group. Percent of Community. 0-17. 18.9.
Access Elementary Statistics: A Step by Step Approach with Connect Math hosted by ALEKS Access Card 8th Edition Chapter 3.2 solutions now. Our solutions are written by Chegg experts so you can be assured of the highest quality!
The majority (94,149, or 81%) of Indian students come to the UK to study at masters level and the recent decrease in Indian students was driven by 21,800 fewer Indian nationals coming to study at ...
Crime-related and demographic statistics for 47 US states in 1960 were collected from government agencies, including the FBI's Uniform Crime Report. One analysis of this data found a strong connection between education and crime indicating that higher levels of education in a community correspond to higher crime rates.
some taken from the 221 homework code base. We used git for version control and also created several test scripts to store models and capture and graph scores achieved over time for di erent agents. 4. STATES, REWARDS, AND FEATURES 4.1 The State At each game frame, the game engine provides informa-tion of the state. This state is then used to ...
Question: Chapter 3.2 Homework MATH-1342.MSW: Elementary Statistical Methods (Maymester 20) Homework: Chapter 3.2 Homework Score: 0 of 1 pt 3 of 12 (2 complete) 3.2.7 Find the population variance and standard deviation 5, 11, 19, 23, 27 Choose the correct answer below. Fill in the answer box to complete your choice. (Type an integer or a decimal.
Find step-by-step solutions and answers to Elementary Statistics - 9781259969454, as well as thousands of textbooks so you can move forward with confidence. ... Now, with expert-verified solutions from Elementary Statistics 3rd Edition, you'll learn how to solve your toughest homework problems. Our resource for Elementary Statistics includes ...
2. 8-9. 1. Table 2.64 Publisher C. Find the relative frequencies for each survey. Write them in the charts. Using either a graphing calculator, computer, or by hand, use the frequency column to construct a histogram for each publisher's survey. For Publishers A and B, make bar widths of one. For Publisher C, make bar widths of two.
CH8.3. Problem. 1CYU. Step-by-step solution. Step 1 of 4. The data represent the proportion of third-graders in the school districts whose reading scores would improve after completing the program. a) A point estimate for the proportion of third-graders in the school districts whose reading scores would improve after completing the program is ...