What is visual representation?
In the vast landscape of communication, where words alone may fall short, visual representation emerges as a powerful ally. In a world inundated with information, the ability to convey complex ideas, emotions, and data through visual means is becoming increasingly crucial. But what exactly is visual representation, and why does it hold such sway in our understanding?

Defining Visual Representation:
Visual representation is the act of conveying information, ideas, or concepts through visual elements such as images, charts, graphs, maps, and other graphical forms. It’s a means of translating the abstract into the tangible, providing a visual language that transcends the limitations of words alone.
The Power of Images:
The adage “a picture is worth a thousand words” encapsulates the essence of visual representation. Images have an unparalleled ability to evoke emotions, tell stories, and communicate complex ideas in an instant. Whether it’s a photograph capturing a poignant moment or an infographic distilling intricate data, images possess a unique capacity to resonate with and engage the viewer on a visceral level.
Facilitating Understanding:
One of the primary functions of visual representation is to enhance understanding. Humans are inherently visual creatures, and we often process and retain visual information more effectively than text. Complex concepts that might be challenging to grasp through written explanations can be simplified and clarified through visual aids. This is particularly valuable in fields such as science, where intricate processes and structures can be elucidated through diagrams and illustrations.
Visual representation also plays a crucial role in education. In classrooms around the world, teachers leverage visual aids to facilitate learning, making lessons more engaging and accessible. From simple charts that break down historical timelines to interactive simulations that bring scientific principles to life, visual representation is a cornerstone of effective pedagogy.
Data Visualization:
In an era dominated by big data, the importance of data visualization cannot be overstated. Raw numbers and statistics can be overwhelming and abstract, but when presented visually, they transform into meaningful insights. Graphs, charts, and maps are powerful tools for conveying trends, patterns, and correlations, enabling decision-makers to glean actionable intelligence from vast datasets.
Consider the impact of a well-crafted infographic that distills complex research findings into a visually digestible format. Data visualization not only simplifies information but also allows for more informed decision-making in fields ranging from business and healthcare to social sciences and environmental studies.
Cultural and Artistic Expression:
Visual representation extends beyond the realm of information and education; it is also a potent form of cultural and artistic expression. Paintings, sculptures, photographs, and other visual arts serve as mediums through which individuals can convey their emotions, perspectives, and cultural narratives. Artistic visual representation has the power to transcend language barriers, fostering a shared human experience that resonates universally.
Conclusion:
In a world inundated with information, visual representation stands as a beacon of clarity and understanding. Whether it’s simplifying complex concepts, conveying data-driven insights, or expressing the depth of human emotion, visual elements enrich our communication in ways that words alone cannot. As we navigate an increasingly visual society, recognizing and harnessing the power of visual representation is not just a skill but a necessity for effective communication and comprehension. So, let us embrace the visual language that surrounds us, unlocking a deeper, more nuanced understanding of the world.
- Open access
- Published: 19 July 2015
The role of visual representations in scientific practices: from conceptual understanding and knowledge generation to ‘seeing’ how science works
- Maria Evagorou 1 ,
- Sibel Erduran 2 &
- Terhi Mäntylä 3
International Journal of STEM Education volume 2 , Article number: 11 ( 2015 ) Cite this article
73k Accesses
78 Citations
13 Altmetric
Metrics details
The use of visual representations (i.e., photographs, diagrams, models) has been part of science, and their use makes it possible for scientists to interact with and represent complex phenomena, not observable in other ways. Despite a wealth of research in science education on visual representations, the emphasis of such research has mainly been on the conceptual understanding when using visual representations and less on visual representations as epistemic objects. In this paper, we argue that by positioning visual representations as epistemic objects of scientific practices, science education can bring a renewed focus on how visualization contributes to knowledge formation in science from the learners’ perspective.
This is a theoretical paper, and in order to argue about the role of visualization, we first present a case study, that of the discovery of the structure of DNA that highlights the epistemic components of visual information in science. The second case study focuses on Faraday’s use of the lines of magnetic force. Faraday is known of his exploratory, creative, and yet systemic way of experimenting, and the visual reasoning leading to theoretical development was an inherent part of the experimentation. Third, we trace a contemporary account from science focusing on the experimental practices and how reproducibility of experimental procedures can be reinforced through video data.
Conclusions
Our conclusions suggest that in teaching science, the emphasis in visualization should shift from cognitive understanding—using the products of science to understand the content—to engaging in the processes of visualization. Furthermore, we suggest that is it essential to design curriculum materials and learning environments that create a social and epistemic context and invite students to engage in the practice of visualization as evidence, reasoning, experimental procedure, or a means of communication and reflect on these practices. Implications for teacher education include the need for teacher professional development programs to problematize the use of visual representations as epistemic objects that are part of scientific practices.
During the last decades, research and reform documents in science education across the world have been calling for an emphasis not only on the content but also on the processes of science (Bybee 2014 ; Eurydice 2012 ; Duschl and Bybee 2014 ; Osborne 2014 ; Schwartz et al. 2012 ), in order to make science accessible to the students and enable them to understand the epistemic foundation of science. Scientific practices, part of the process of science, are the cognitive and discursive activities that are targeted in science education to develop epistemic understanding and appreciation of the nature of science (Duschl et al. 2008 ) and have been the emphasis of recent reform documents in science education across the world (Achieve 2013 ; Eurydice 2012 ). With the term scientific practices, we refer to the processes that take place during scientific discoveries and include among others: asking questions, developing and using models, engaging in arguments, and constructing and communicating explanations (National Research Council 2012 ). The emphasis on scientific practices aims to move the teaching of science from knowledge to the understanding of the processes and the epistemic aspects of science. Additionally, by placing an emphasis on engaging students in scientific practices, we aim to help students acquire scientific knowledge in meaningful contexts that resemble the reality of scientific discoveries.
Despite a wealth of research in science education on visual representations, the emphasis of such research has mainly been on the conceptual understanding when using visual representations and less on visual representations as epistemic objects. In this paper, we argue that by positioning visual representations as epistemic objects, science education can bring a renewed focus on how visualization contributes to knowledge formation in science from the learners’ perspective. Specifically, the use of visual representations (i.e., photographs, diagrams, tables, charts) has been part of science and over the years has evolved with the new technologies (i.e., from drawings to advanced digital images and three dimensional models). Visualization makes it possible for scientists to interact with complex phenomena (Richards 2003 ), and they might convey important evidence not observable in other ways. Visual representations as a tool to support cognitive understanding in science have been studied extensively (i.e., Gilbert 2010 ; Wu and Shah 2004 ). Studies in science education have explored the use of images in science textbooks (i.e., Dimopoulos et al. 2003 ; Bungum 2008 ), students’ representations or models when doing science (i.e., Gilbert et al. 2008 ; Dori et al. 2003 ; Lehrer and Schauble 2012 ; Schwarz et al. 2009 ), and students’ images of science and scientists (i.e., Chambers 1983 ). Therefore, studies in the field of science education have been using the term visualization as “the formation of an internal representation from an external representation” (Gilbert et al. 2008 , p. 4) or as a tool for conceptual understanding for students.
In this paper, we do not refer to visualization as mental image, model, or presentation only (Gilbert et al. 2008 ; Philips et al. 2010 ) but instead focus on visual representations or visualization as epistemic objects. Specifically, we refer to visualization as a process for knowledge production and growth in science. In this respect, modeling is an aspect of visualization, but what we are focusing on with visualization is not on the use of model as a tool for cognitive understanding (Gilbert 2010 ; Wu and Shah 2004 ) but the on the process of modeling as a scientific practice which includes the construction and use of models, the use of other representations, the communication in the groups with the use of the visual representation, and the appreciation of the difficulties that the science phase in this process. Therefore, the purpose of this paper is to present through the history of science how visualization can be considered not only as a cognitive tool in science education but also as an epistemic object that can potentially support students to understand aspects of the nature of science.
Scientific practices and science education
According to the New Generation Science Standards (Achieve 2013 ), scientific practices refer to: asking questions and defining problems; developing and using models; planning and carrying out investigations; analyzing and interpreting data; using mathematical and computational thinking; constructing explanations and designing solutions; engaging in argument from evidence; and obtaining, evaluating, and communicating information. A significant aspect of scientific practices is that science learning is more than just about learning facts, concepts, theories, and laws. A fuller appreciation of science necessitates the understanding of the science relative to its epistemological grounding and the process that are involved in the production of knowledge (Hogan and Maglienti 2001 ; Wickman 2004 ).
The New Generation Science Standards is, among other changes, shifting away from science inquiry and towards the inclusion of scientific practices (Duschl and Bybee 2014 ; Osborne 2014 ). By comparing the abilities to do scientific inquiry (National Research Council 2000 ) with the set of scientific practices, it is evident that the latter is about engaging in the processes of doing science and experiencing in that way science in a more authentic way. Engaging in scientific practices according to Osborne ( 2014 ) “presents a more authentic picture of the endeavor that is science” (p.183) and also helps the students to develop a deeper understanding of the epistemic aspects of science. Furthermore, as Bybee ( 2014 ) argues, by engaging students in scientific practices, we involve them in an understanding of the nature of science and an understanding on the nature of scientific knowledge.
Science as a practice and scientific practices as a term emerged by the philosopher of science, Kuhn (Osborne 2014 ), refers to the processes in which the scientists engage during knowledge production and communication. The work that is followed by historians, philosophers, and sociologists of science (Latour 2011 ; Longino 2002 ; Nersessian 2008 ) revealed the scientific practices in which the scientists engage in and include among others theory development and specific ways of talking, modeling, and communicating the outcomes of science.
Visualization as an epistemic object
Schematic, pictorial symbols in the design of scientific instruments and analysis of the perceptual and functional information that is being stored in those images have been areas of investigation in philosophy of scientific experimentation (Gooding et al. 1993 ). The nature of visual perception, the relationship between thought and vision, and the role of reproducibility as a norm for experimental research form a central aspect of this domain of research in philosophy of science. For instance, Rothbart ( 1997 ) has argued that visualizations are commonplace in the theoretical sciences even if every scientific theory may not be defined by visualized models.
Visual representations (i.e., photographs, diagrams, tables, charts, models) have been used in science over the years to enable scientists to interact with complex phenomena (Richards 2003 ) and might convey important evidence not observable in other ways (Barber et al. 2006 ). Some authors (e.g., Ruivenkamp and Rip 2010 ) have argued that visualization is as a core activity of some scientific communities of practice (e.g., nanotechnology) while others (e.g., Lynch and Edgerton 1988 ) have differentiated the role of particular visualization techniques (e.g., of digital image processing in astronomy). Visualization in science includes the complex process through which scientists develop or produce imagery, schemes, and graphical representation, and therefore, what is of importance in this process is not only the result but also the methodology employed by the scientists, namely, how this result was produced. Visual representations in science may refer to objects that are believed to have some kind of material or physical existence but equally might refer to purely mental, conceptual, and abstract constructs (Pauwels 2006 ). More specifically, visual representations can be found for: (a) phenomena that are not observable with the eye (i.e., microscopic or macroscopic); (b) phenomena that do not exist as visual representations but can be translated as such (i.e., sound); and (c) in experimental settings to provide visual data representations (i.e., graphs presenting velocity of moving objects). Additionally, since science is not only about replicating reality but also about making it more understandable to people (either to the public or other scientists), visual representations are not only about reproducing the nature but also about: (a) functioning in helping solving a problem, (b) filling gaps in our knowledge, and (c) facilitating knowledge building or transfer (Lynch 2006 ).
Using or developing visual representations in the scientific practice can range from a straightforward to a complicated situation. More specifically, scientists can observe a phenomenon (i.e., mitosis) and represent it visually using a picture or diagram, which is quite straightforward. But they can also use a variety of complicated techniques (i.e., crystallography in the case of DNA studies) that are either available or need to be developed or refined in order to acquire the visual information that can be used in the process of theory development (i.e., Latour and Woolgar 1979 ). Furthermore, some visual representations need decoding, and the scientists need to learn how to read these images (i.e., radiologists); therefore, using visual representations in the process of science requires learning a new language that is specific to the medium/methods that is used (i.e., understanding an X-ray picture is different from understanding an MRI scan) and then communicating that language to other scientists and the public.
There are much intent and purposes of visual representations in scientific practices, as for example to make a diagnosis, compare, describe, and preserve for future study, verify and explore new territory, generate new data (Pauwels 2006 ), or present new methodologies. According to Latour and Woolgar ( 1979 ) and Knorr Cetina ( 1999 ), visual representations can be used either as primary data (i.e., image from a microscope). or can be used to help in concept development (i.e., models of DNA used by Watson and Crick), to uncover relationships and to make the abstract more concrete (graphs of sound waves). Therefore, visual representations and visual practices, in all forms, are an important aspect of the scientific practices in developing, clarifying, and transmitting scientific knowledge (Pauwels 2006 ).
Methods and Results: Merging Visualization and scientific practices in science
In this paper, we present three case studies that embody the working practices of scientists in an effort to present visualization as a scientific practice and present our argument about how visualization is a complex process that could include among others modeling and use of representation but is not only limited to that. The first case study explores the role of visualization in the construction of knowledge about the structure of DNA, using visuals as evidence. The second case study focuses on Faraday’s use of the lines of magnetic force and the visual reasoning leading to the theoretical development that was an inherent part of the experimentation. The third case study focuses on the current practices of scientists in the context of a peer-reviewed journal called the Journal of Visualized Experiments where the methodology is communicated through videotaped procedures. The three case studies represent the research interests of the three authors of this paper and were chosen to present how visualization as a practice can be involved in all stages of doing science, from hypothesizing and evaluating evidence (case study 1) to experimenting and reasoning (case study 2) to communicating the findings and methodology with the research community (case study 3), and represent in this way the three functions of visualization as presented by Lynch ( 2006 ). Furthermore, the last case study showcases how the development of visualization technologies has contributed to the communication of findings and methodologies in science and present in that way an aspect of current scientific practices. In all three cases, our approach is guided by the observation that the visual information is an integral part of scientific practices at the least and furthermore that they are particularly central in the scientific practices of science.
Case study 1: use visual representations as evidence in the discovery of DNA
The focus of the first case study is the discovery of the structure of DNA. The DNA was first isolated in 1869 by Friedrich Miescher, and by the late 1940s, it was known that it contained phosphate, sugar, and four nitrogen-containing chemical bases. However, no one had figured the structure of the DNA until Watson and Crick presented their model of DNA in 1953. Other than the social aspects of the discovery of the DNA, another important aspect was the role of visual evidence that led to knowledge development in the area. More specifically, by studying the personal accounts of Watson ( 1968 ) and Crick ( 1988 ) about the discovery of the structure of the DNA, the following main ideas regarding the role of visual representations in the production of knowledge can be identified: (a) The use of visual representations was an important part of knowledge growth and was often dependent upon the discovery of new technologies (i.e., better microscopes or better techniques in crystallography that would provide better visual representations as evidence of the helical structure of the DNA); and (b) Models (three-dimensional) were used as a way to represent the visual images (X-ray images) and connect them to the evidence provided by other sources to see whether the theory can be supported. Therefore, the model of DNA was built based on the combination of visual evidence and experimental data.
An example showcasing the importance of visual representations in the process of knowledge production in this case is provided by Watson, in his book The Double Helix (1968):
…since the middle of the summer Rosy [Rosalind Franklin] had had evidence for a new three-dimensional form of DNA. It occurred when the DNA 2molecules were surrounded by a large amount of water. When I asked what the pattern was like, Maurice went into the adjacent room to pick up a print of the new form they called the “B” structure. The instant I saw the picture, my mouth fell open and my pulse began to race. The pattern was unbelievably simpler than those previously obtained (A form). Moreover, the black cross of reflections which dominated the picture could arise only from a helical structure. With the A form the argument for the helix was never straightforward, and considerable ambiguity existed as to exactly which type of helical symmetry was present. With the B form however, mere inspection of its X-ray picture gave several of the vital helical parameters. (p. 167-169)
As suggested by Watson’s personal account of the discovery of the DNA, the photo taken by Rosalind Franklin (Fig. 1 ) convinced him that the DNA molecule must consist of two chains arranged in a paired helix, which resembles a spiral staircase or ladder, and on March 7, 1953, Watson and Crick finished and presented their model of the structure of DNA (Watson and Berry 2004 ; Watson 1968 ) which was based on the visual information provided by the X-ray image and their knowledge of chemistry.
X-ray chrystallography of DNA
In analyzing the visualization practice in this case study, we observe the following instances that highlight how the visual information played a role:
Asking questions and defining problems: The real world in the model of science can at some points only be observed through visual representations or representations, i.e., if we are using DNA as an example, the structure of DNA was only observable through the crystallography images produced by Rosalind Franklin in the laboratory. There was no other way to observe the structure of DNA, therefore the real world.
Analyzing and interpreting data: The images that resulted from crystallography as well as their interpretations served as the data for the scientists studying the structure of DNA.
Experimenting: The data in the form of visual information were used to predict the possible structure of the DNA.
Modeling: Based on the prediction, an actual three-dimensional model was prepared by Watson and Crick. The first model did not fit with the real world (refuted by Rosalind Franklin and her research group from King’s College) and Watson and Crick had to go through the same process again to find better visual evidence (better crystallography images) and create an improved visual model.
Example excerpts from Watson’s biography provide further evidence for how visualization practices were applied in the context of the discovery of DNA (Table 1 ).
In summary, by examining the history of the discovery of DNA, we showcased how visual data is used as scientific evidence in science, identifying in that way an aspect of the nature of science that is still unexplored in the history of science and an aspect that has been ignored in the teaching of science. Visual representations are used in many ways: as images, as models, as evidence to support or rebut a model, and as interpretations of reality.
Case study 2: applying visual reasoning in knowledge production, the example of the lines of magnetic force
The focus of this case study is on Faraday’s use of the lines of magnetic force. Faraday is known of his exploratory, creative, and yet systemic way of experimenting, and the visual reasoning leading to theoretical development was an inherent part of this experimentation (Gooding 2006 ). Faraday’s articles or notebooks do not include mathematical formulations; instead, they include images and illustrations from experimental devices and setups to the recapping of his theoretical ideas (Nersessian 2008 ). According to Gooding ( 2006 ), “Faraday’s visual method was designed not to copy apparent features of the world, but to analyse and replicate them” (2006, p. 46).
The lines of force played a central role in Faraday’s research on electricity and magnetism and in the development of his “field theory” (Faraday 1852a ; Nersessian 1984 ). Before Faraday, the experiments with iron filings around magnets were known and the term “magnetic curves” was used for the iron filing patterns and also for the geometrical constructs derived from the mathematical theory of magnetism (Gooding et al. 1993 ). However, Faraday used the lines of force for explaining his experimental observations and in constructing the theory of forces in magnetism and electricity. Examples of Faraday’s different illustrations of lines of magnetic force are given in Fig. 2 . Faraday gave the following experiment-based definition for the lines of magnetic forces:
a Iron filing pattern in case of bar magnet drawn by Faraday (Faraday 1852b , Plate IX, p. 158, Fig. 1), b Faraday’s drawing of lines of magnetic force in case of cylinder magnet, where the experimental procedure, knife blade showing the direction of lines, is combined into drawing (Faraday, 1855, vol. 1, plate 1)
A line of magnetic force may be defined as that line which is described by a very small magnetic needle, when it is so moved in either direction correspondent to its length, that the needle is constantly a tangent to the line of motion; or it is that line along which, if a transverse wire be moved in either direction, there is no tendency to the formation of any current in the wire, whilst if moved in any other direction there is such a tendency; or it is that line which coincides with the direction of the magnecrystallic axis of a crystal of bismuth, which is carried in either direction along it. The direction of these lines about and amongst magnets and electric currents, is easily represented and understood, in a general manner, by the ordinary use of iron filings. (Faraday 1852a , p. 25 (3071))
The definition describes the connection between the experiments and the visual representation of the results. Initially, the lines of force were just geometric representations, but later, Faraday treated them as physical objects (Nersessian 1984 ; Pocovi and Finlay 2002 ):
I have sometimes used the term lines of force so vaguely, as to leave the reader doubtful whether I intended it as a merely representative idea of the forces, or as the description of the path along which the power was continuously exerted. … wherever the expression line of force is taken simply to represent the disposition of forces, it shall have the fullness of that meaning; but that wherever it may seem to represent the idea of the physical mode of transmission of the force, it expresses in that respect the opinion to which I incline at present. The opinion may be erroneous, and yet all that relates or refers to the disposition of the force will remain the same. (Faraday, 1852a , p. 55-56 (3075))
He also felt that the lines of force had greater explanatory power than the dominant theory of action-at-a-distance:
Now it appears to me that these lines may be employed with great advantage to represent nature, condition, direction and comparative amount of the magnetic forces; and that in many cases they have, to the physical reasoned at least, a superiority over that method which represents the forces as concentrated in centres of action… (Faraday, 1852a , p. 26 (3074))
For giving some insight to Faraday’s visual reasoning as an epistemic practice, the following examples of Faraday’s studies of the lines of magnetic force (Faraday 1852a , 1852b ) are presented:
(a) Asking questions and defining problems: The iron filing patterns formed the empirical basis for the visual model: 2D visualization of lines of magnetic force as presented in Fig. 2 . According to Faraday, these iron filing patterns were suitable for illustrating the direction and form of the magnetic lines of force (emphasis added):
It must be well understood that these forms give no indication by their appearance of the relative strength of the magnetic force at different places, inasmuch as the appearance of the lines depends greatly upon the quantity of filings and the amount of tapping; but the direction and forms of these lines are well given, and these indicate, in a considerable degree, the direction in which the forces increase and diminish . (Faraday 1852b , p.158 (3237))
Despite being static and two dimensional on paper, the lines of magnetic force were dynamical (Nersessian 1992 , 2008 ) and three dimensional for Faraday (see Fig. 2 b). For instance, Faraday described the lines of force “expanding”, “bending,” and “being cut” (Nersessian 1992 ). In Fig. 2 b, Faraday has summarized his experiment (bar magnet and knife blade) and its results (lines of force) in one picture.
(b) Analyzing and interpreting data: The model was so powerful for Faraday that he ended up thinking them as physical objects (e.g., Nersessian 1984 ), i.e., making interpretations of the way forces act. Of course, he made a lot of experiments for showing the physical existence of the lines of force, but he did not succeed in it (Nersessian 1984 ). The following quote illuminates Faraday’s use of the lines of force in different situations:
The study of these lines has, at different times, been greatly influential in leading me to various results, which I think prove their utility as well as fertility. Thus, the law of magneto-electric induction; the earth’s inductive action; the relation of magnetism and light; diamagnetic action and its law, and magnetocrystallic action, are the cases of this kind… (Faraday 1852a , p. 55 (3174))
(c) Experimenting: In Faraday's case, he used a lot of exploratory experiments; in case of lines of magnetic force, he used, e.g., iron filings, magnetic needles, or current carrying wires (see the quote above). The magnetic field is not directly observable and the representation of lines of force was a visual model, which includes the direction, form, and magnitude of field.
(d) Modeling: There is no denying that the lines of magnetic force are visual by nature. Faraday’s views of lines of force developed gradually during the years, and he applied and developed them in different contexts such as electromagnetic, electrostatic, and magnetic induction (Nersessian 1984 ). An example of Faraday’s explanation of the effect of the wire b’s position to experiment is given in Fig. 3 . In Fig. 3 , few magnetic lines of force are drawn, and in the quote below, Faraday is explaining the effect using these magnetic lines of force (emphasis added):
Picture of an experiment with different arrangements of wires ( a , b’ , b” ), magnet, and galvanometer. Note the lines of force drawn around the magnet. (Faraday 1852a , p. 34)
It will be evident by inspection of Fig. 3 , that, however the wires are carried away, the general result will, according to the assumed principles of action, be the same; for if a be the axial wire, and b’, b”, b”’ the equatorial wire, represented in three different positions, whatever magnetic lines of force pass across the latter wire in one position, will also pass it in the other, or in any other position which can be given to it. The distance of the wire at the place of intersection with the lines of force, has been shown, by the experiments (3093.), to be unimportant. (Faraday 1852a , p. 34 (3099))
In summary, by examining the history of Faraday’s use of lines of force, we showed how visual imagery and reasoning played an important part in Faraday’s construction and representation of his “field theory”. As Gooding has stated, “many of Faraday’s sketches are far more that depictions of observation, they are tools for reasoning with and about phenomena” (2006, p. 59).
Case study 3: visualizing scientific methods, the case of a journal
The focus of the third case study is the Journal of Visualized Experiments (JoVE) , a peer-reviewed publication indexed in PubMed. The journal devoted to the publication of biological, medical, chemical, and physical research in a video format. The journal describes its history as follows:
JoVE was established as a new tool in life science publication and communication, with participation of scientists from leading research institutions. JoVE takes advantage of video technology to capture and transmit the multiple facets and intricacies of life science research. Visualization greatly facilitates the understanding and efficient reproduction of both basic and complex experimental techniques, thereby addressing two of the biggest challenges faced by today's life science research community: i) low transparency and poor reproducibility of biological experiments and ii) time and labor-intensive nature of learning new experimental techniques. ( http://www.jove.com/ )
By examining the journal content, we generate a set of categories that can be considered as indicators of relevance and significance in terms of epistemic practices of science that have relevance for science education. For example, the quote above illustrates how scientists view some norms of scientific practice including the norms of “transparency” and “reproducibility” of experimental methods and results, and how the visual format of the journal facilitates the implementation of these norms. “Reproducibility” can be considered as an epistemic criterion that sits at the heart of what counts as an experimental procedure in science:
Investigating what should be reproducible and by whom leads to different types of experimental reproducibility, which can be observed to play different roles in experimental practice. A successful application of the strategy of reproducing an experiment is an achievement that may depend on certain isiosyncratic aspects of a local situation. Yet a purely local experiment that cannot be carried out by other experimenters and in other experimental contexts will, in the end be unproductive in science. (Sarkar and Pfeifer 2006 , p.270)
We now turn to an article on “Elevated Plus Maze for Mice” that is available for free on the journal website ( http://www.jove.com/video/1088/elevated-plus-maze-for-mice ). The purpose of this experiment was to investigate anxiety levels in mice through behavioral analysis. The journal article consists of a 9-min video accompanied by text. The video illustrates the handling of the mice in soundproof location with less light, worksheets with characteristics of mice, computer software, apparatus, resources, setting up the computer software, and the video recording of mouse behavior on the computer. The authors describe the apparatus that is used in the experiment and state how procedural differences exist between research groups that lead to difficulties in the interpretation of results:
The apparatus consists of open arms and closed arms, crossed in the middle perpendicularly to each other, and a center area. Mice are given access to all of the arms and are allowed to move freely between them. The number of entries into the open arms and the time spent in the open arms are used as indices of open space-induced anxiety in mice. Unfortunately, the procedural differences that exist between laboratories make it difficult to duplicate and compare results among laboratories.
The authors’ emphasis on the particularity of procedural context echoes in the observations of some philosophers of science:
It is not just the knowledge of experimental objects and phenomena but also their actual existence and occurrence that prove to be dependent on specific, productive interventions by the experimenters” (Sarkar and Pfeifer 2006 , pp. 270-271)
The inclusion of a video of the experimental procedure specifies what the apparatus looks like (Fig. 4 ) and how the behavior of the mice is captured through video recording that feeds into a computer (Fig. 5 ). Subsequently, a computer software which captures different variables such as the distance traveled, the number of entries, and the time spent on each arm of the apparatus. Here, there is visual information at different levels of representation ranging from reconfiguration of raw video data to representations that analyze the data around the variables in question (Fig. 6 ). The practice of levels of visual representations is not particular to the biological sciences. For instance, they are commonplace in nanotechnological practices:
Visual illustration of apparatus
Video processing of experimental set-up
Computer software for video input and variable recording
In the visualization processes, instruments are needed that can register the nanoscale and provide raw data, which needs to be transformed into images. Some Imaging Techniques have software incorporated already where this transformation automatically takes place, providing raw images. Raw data must be translated through the use of Graphic Software and software is also used for the further manipulation of images to highlight what is of interest to capture the (inferred) phenomena -- and to capture the reader. There are two levels of choice: Scientists have to choose which imaging technique and embedded software to use for the job at hand, and they will then have to follow the structure of the software. Within such software, there are explicit choices for the scientists, e.g. about colour coding, and ways of sharpening images. (Ruivenkamp and Rip 2010 , pp.14–15)
On the text that accompanies the video, the authors highlight the role of visualization in their experiment:
Visualization of the protocol will promote better understanding of the details of the entire experimental procedure, allowing for standardization of the protocols used in different laboratories and comparisons of the behavioral phenotypes of various strains of mutant mice assessed using this test.
The software that takes the video data and transforms it into various representations allows the researchers to collect data on mouse behavior more reliably. For instance, the distance traveled across the arms of the apparatus or the time spent on each arm would have been difficult to observe and record precisely. A further aspect to note is how the visualization of the experiment facilitates control of bias. The authors illustrate how the olfactory bias between experimental procedures carried on mice in sequence is avoided by cleaning the equipment.
Our discussion highlights the role of visualization in science, particularly with respect to presenting visualization as part of the scientific practices. We have used case studies from the history of science highlighting a scientist’s account of how visualization played a role in the discovery of DNA and the magnetic field and from a contemporary illustration of a science journal’s practices in incorporating visualization as a way to communicate new findings and methodologies. Our implicit aim in drawing from these case studies was the need to align science education with scientific practices, particularly in terms of how visual representations, stable or dynamic, can engage students in the processes of science and not only to be used as tools for cognitive development in science. Our approach was guided by the notion of “knowledge-as-practice” as advanced by Knorr Cetina ( 1999 ) who studied scientists and characterized their knowledge as practice, a characterization which shifts focus away from ideas inside scientists’ minds to practices that are cultural and deeply contextualized within fields of science. She suggests that people working together can be examined as epistemic cultures whose collective knowledge exists as practice.
It is important to stress, however, that visual representations are not used in isolation, but are supported by other types of evidence as well, or other theories (i.e., in order to understand the helical form of DNA, or the structure, chemistry knowledge was needed). More importantly, this finding can also have implications when teaching science as argument (e.g., Erduran and Jimenez-Aleixandre 2008 ), since the verbal evidence used in the science classroom to maintain an argument could be supported by visual evidence (either a model, representation, image, graph, etc.). For example, in a group of students discussing the outcomes of an introduced species in an ecosystem, pictures of the species and the ecosystem over time, and videos showing the changes in the ecosystem, and the special characteristics of the different species could serve as visual evidence to help the students support their arguments (Evagorou et al. 2012 ). Therefore, an important implication for the teaching of science is the use of visual representations as evidence in the science curriculum as part of knowledge production. Even though studies in the area of science education have focused on the use of models and modeling as a way to support students in the learning of science (Dori et al. 2003 ; Lehrer and Schauble 2012 ; Mendonça and Justi 2013 ; Papaevripidou et al. 2007 ) or on the use of images (i.e., Korfiatis et al. 2003 ), with the term using visuals as evidence, we refer to the collection of all forms of visuals and the processes involved.
Another aspect that was identified through the case studies is that of the visual reasoning (an integral part of Faraday’s investigations). Both the verbalization and visualization were part of the process of generating new knowledge (Gooding 2006 ). Even today, most of the textbooks use the lines of force (or just field lines) as a geometrical representation of field, and the number of field lines is connected to the quantity of flux. Often, the textbooks use the same kind of visual imagery than in what is used by scientists. However, when using images, only certain aspects or features of the phenomena or data are captured or highlighted, and often in tacit ways. Especially in textbooks, the process of producing the image is not presented and instead only the product—image—is left. This could easily lead to an idea of images (i.e., photos, graphs, visual model) being just representations of knowledge and, in the worse case, misinterpreted representations of knowledge as the results of Pocovi and Finlay ( 2002 ) in case of electric field lines show. In order to avoid this, the teachers should be able to explain how the images are produced (what features of phenomena or data the images captures, on what ground the features are chosen to that image, and what features are omitted); in this way, the role of visualization in knowledge production can be made “visible” to students by engaging them in the process of visualization.
The implication of these norms for science teaching and learning is numerous. The classroom contexts can model the generation, sharing and evaluation of evidence, and experimental procedures carried out by students, thereby promoting not only some contemporary cultural norms in scientific practice but also enabling the learning of criteria, standards, and heuristics that scientists use in making decisions on scientific methods. As we have demonstrated with the three case studies, visual representations are part of the process of knowledge growth and communication in science, as demonstrated with two examples from the history of science and an example from current scientific practices. Additionally, visual information, especially with the use of technology is a part of students’ everyday lives. Therefore, we suggest making use of students’ knowledge and technological skills (i.e., how to produce their own videos showing their experimental method or how to identify or provide appropriate visual evidence for a given topic), in order to teach them the aspects of the nature of science that are often neglected both in the history of science and the design of curriculum. Specifically, what we suggest in this paper is that students should actively engage in visualization processes in order to appreciate the diverse nature of doing science and engage in authentic scientific practices.
However, as a word of caution, we need to distinguish the products and processes involved in visualization practices in science:
If one considers scientific representations and the ways in which they can foster or thwart our understanding, it is clear that a mere object approach, which would devote all attention to the representation as a free-standing product of scientific labor, is inadequate. What is needed is a process approach: each visual representation should be linked with its context of production (Pauwels 2006 , p.21).
The aforementioned suggests that the emphasis in visualization should shift from cognitive understanding—using the products of science to understand the content—to engaging in the processes of visualization. Therefore, an implication for the teaching of science includes designing curriculum materials and learning environments that create a social and epistemic context and invite students to engage in the practice of visualization as evidence, reasoning, experimental procedure, or a means of communication (as presented in the three case studies) and reflect on these practices (Ryu et al. 2015 ).
Finally, a question that arises from including visualization in science education, as well as from including scientific practices in science education is whether teachers themselves are prepared to include them as part of their teaching (Bybee 2014 ). Teacher preparation programs and teacher education have been critiqued, studied, and rethought since the time they emerged (Cochran-Smith 2004 ). Despite the years of history in teacher training and teacher education, the debate about initial teacher training and its content still pertains in our community and in policy circles (Cochran-Smith 2004 ; Conway et al. 2009 ). In the last decades, the debate has shifted from a behavioral view of learning and teaching to a learning problem—focusing on that way not only on teachers’ knowledge, skills, and beliefs but also on making the connection of the aforementioned with how and if pupils learn (Cochran-Smith 2004 ). The Science Education in Europe report recommended that “Good quality teachers, with up-to-date knowledge and skills, are the foundation of any system of formal science education” (Osborne and Dillon 2008 , p.9).
However, questions such as what should be the emphasis on pre-service and in-service science teacher training, especially with the new emphasis on scientific practices, still remain unanswered. As Bybee ( 2014 ) argues, starting from the new emphasis on scientific practices in the NGSS, we should consider teacher preparation programs “that would provide undergraduates opportunities to learn the science content and practices in contexts that would be aligned with their future work as teachers” (p.218). Therefore, engaging pre- and in-service teachers in visualization as a scientific practice should be one of the purposes of teacher preparation programs.
Achieve. (2013). The next generation science standards (pp. 1–3). Retrieved from http://www.nextgenscience.org/ .
Google Scholar
Barber, J, Pearson, D, & Cervetti, G. (2006). Seeds of science/roots of reading . California: The Regents of the University of California.
Bungum, B. (2008). Images of physics: an explorative study of the changing character of visual images in Norwegian physics textbooks. NorDiNa, 4 (2), 132–141.
Bybee, RW. (2014). NGSS and the next generation of science teachers. Journal of Science Teacher Education, 25 (2), 211–221. doi: 10.1007/s10972-014-9381-4 .
Article Google Scholar
Chambers, D. (1983). Stereotypic images of the scientist: the draw-a-scientist test. Science Education, 67 (2), 255–265.
Cochran-Smith, M. (2004). The problem of teacher education. Journal of Teacher Education, 55 (4), 295–299. doi: 10.1177/0022487104268057 .
Conway, PF, Murphy, R, & Rath, A. (2009). Learning to teach and its implications for the continuum of teacher education: a nine-country cross-national study .
Crick, F. (1988). What a mad pursuit . USA: Basic Books.
Dimopoulos, K, Koulaidis, V, & Sklaveniti, S. (2003). Towards an analysis of visual images in school science textbooks and press articles about science and technology. Research in Science Education, 33 , 189–216.
Dori, YJ, Tal, RT, & Tsaushu, M. (2003). Teaching biotechnology through case studies—can we improve higher order thinking skills of nonscience majors? Science Education, 87 (6), 767–793. doi: 10.1002/sce.10081 .
Duschl, RA, & Bybee, RW. (2014). Planning and carrying out investigations: an entry to learning and to teacher professional development around NGSS science and engineering practices. International Journal of STEM Education, 1 (1), 12. doi: 10.1186/s40594-014-0012-6 .
Duschl, R., Schweingruber, H. A., & Shouse, A. (2008). Taking science to school . Washington DC: National Academies Press.
Erduran, S, & Jimenez-Aleixandre, MP (Eds.). (2008). Argumentation in science education: perspectives from classroom-based research . Dordrecht: Springer.
Eurydice. (2012). Developing key competencies at school in Europe: challenges and opportunities for policy – 2011/12 (pp. 1–72).
Evagorou, M, Jimenez-Aleixandre, MP, & Osborne, J. (2012). “Should we kill the grey squirrels?” A study exploring students’ justifications and decision-making. International Journal of Science Education, 34 (3), 401–428. doi: 10.1080/09500693.2011.619211 .
Faraday, M. (1852a). Experimental researches in electricity. – Twenty-eighth series. Philosophical Transactions of the Royal Society of London, 142 , 25–56.
Faraday, M. (1852b). Experimental researches in electricity. – Twenty-ninth series. Philosophical Transactions of the Royal Society of London, 142 , 137–159.
Gilbert, JK. (2010). The role of visual representations in the learning and teaching of science: an introduction (pp. 1–19).
Gilbert, J., Reiner, M. & Nakhleh, M. (2008). Visualization: theory and practice in science education . Dordrecht, The Netherlands: Springer.
Gooding, D. (2006). From phenomenology to field theory: Faraday’s visual reasoning. Perspectives on Science, 14 (1), 40–65.
Gooding, D, Pinch, T, & Schaffer, S (Eds.). (1993). The uses of experiment: studies in the natural sciences . Cambridge: Cambridge University Press.
Hogan, K, & Maglienti, M. (2001). Comparing the epistemological underpinnings of students’ and scientists’ reasoning about conclusions. Journal of Research in Science Teaching, 38 (6), 663–687.
Knorr Cetina, K. (1999). Epistemic cultures: how the sciences make knowledge . Cambridge: Harvard University Press.
Korfiatis, KJ, Stamou, AG, & Paraskevopoulos, S. (2003). Images of nature in Greek primary school textbooks. Science Education, 88 (1), 72–89. doi: 10.1002/sce.10133 .
Latour, B. (2011). Visualisation and cognition: drawing things together (pp. 1–32).
Latour, B, & Woolgar, S. (1979). Laboratory life: the construction of scientific facts . Princeton: Princeton University Press.
Lehrer, R, & Schauble, L. (2012). Seeding evolutionary thinking by engaging children in modeling its foundations. Science Education, 96 (4), 701–724. doi: 10.1002/sce.20475 .
Longino, H. E. (2002). The fate of knowledge . Princeton: Princeton University Press.
Lynch, M. (2006). The production of scientific images: vision and re-vision in the history, philosophy, and sociology of science. In L Pauwels (Ed.), Visual cultures of science: rethinking representational practices in knowledge building and science communication (pp. 26–40). Lebanon, NH: Darthmouth College Press.
Lynch, M. & S. Y. Edgerton Jr. (1988). ‘Aesthetic and digital image processing representational craft in contemporary astronomy’, in G. Fyfe & J. Law (eds), Picturing Power; Visual Depictions and Social Relations (London, Routledge): 184 – 220.
Mendonça, PCC, & Justi, R. (2013). An instrument for analyzing arguments produced in modeling-based chemistry lessons. Journal of Research in Science Teaching, 51 (2), 192–218. doi: 10.1002/tea.21133 .
National Research Council (2000). Inquiry and the national science education standards . Washington DC: National Academies Press.
National Research Council (2012). A framework for K-12 science education . Washington DC: National Academies Press.
Nersessian, NJ. (1984). Faraday to Einstein: constructing meaning in scientific theories . Dordrecht: Martinus Nijhoff Publishers.
Book Google Scholar
Nersessian, NJ. (1992). How do scientists think? Capturing the dynamics of conceptual change in science. In RN Giere (Ed.), Cognitive Models of Science (pp. 3–45). Minneapolis: University of Minnesota Press.
Nersessian, NJ. (2008). Creating scientific concepts . Cambridge: The MIT Press.
Osborne, J. (2014). Teaching scientific practices: meeting the challenge of change. Journal of Science Teacher Education, 25 (2), 177–196. doi: 10.1007/s10972-014-9384-1 .
Osborne, J. & Dillon, J. (2008). Science education in Europe: critical reflections . London: Nuffield Foundation.
Papaevripidou, M, Constantinou, CP, & Zacharia, ZC. (2007). Modeling complex marine ecosystems: an investigation of two teaching approaches with fifth graders. Journal of Computer Assisted Learning, 23 (2), 145–157. doi: 10.1111/j.1365-2729.2006.00217.x .
Pauwels, L. (2006). A theoretical framework for assessing visual representational practices in knowledge building and science communications. In L Pauwels (Ed.), Visual cultures of science: rethinking representational practices in knowledge building and science communication (pp. 1–25). Lebanon, NH: Darthmouth College Press.
Philips, L., Norris, S. & McNab, J. (2010). Visualization in mathematics, reading and science education . Dordrecht, The Netherlands: Springer.
Pocovi, MC, & Finlay, F. (2002). Lines of force: Faraday’s and students’ views. Science & Education, 11 , 459–474.
Richards, A. (2003). Argument and authority in the visual representations of science. Technical Communication Quarterly, 12 (2), 183–206. doi: 10.1207/s15427625tcq1202_3 .
Rothbart, D. (1997). Explaining the growth of scientific knowledge: metaphors, models and meaning . Lewiston, NY: Mellen Press.
Ruivenkamp, M, & Rip, A. (2010). Visualizing the invisible nanoscale study: visualization practices in nanotechnology community of practice. Science Studies, 23 (1), 3–36.
Ryu, S, Han, Y, & Paik, S-H. (2015). Understanding co-development of conceptual and epistemic understanding through modeling practices with mobile internet. Journal of Science Education and Technology, 24 (2-3), 330–355. doi: 10.1007/s10956-014-9545-1 .
Sarkar, S, & Pfeifer, J. (2006). The philosophy of science, chapter on experimentation (Vol. 1, A-M). New York: Taylor & Francis.
Schwartz, RS, Lederman, NG, & Abd-el-Khalick, F. (2012). A series of misrepresentations: a response to Allchin’s whole approach to assessing nature of science understandings. Science Education, 96 (4), 685–692. doi: 10.1002/sce.21013 .
Schwarz, CV, Reiser, BJ, Davis, EA, Kenyon, L, Achér, A, Fortus, D, et al. (2009). Developing a learning progression for scientific modeling: making scientific modeling accessible and meaningful for learners. Journal of Research in Science Teaching, 46 (6), 632–654. doi: 10.1002/tea.20311 .
Watson, J. (1968). The Double Helix: a personal account of the discovery of the structure of DNA . New York: Scribner.
Watson, J, & Berry, A. (2004). DNA: the secret of life . New York: Alfred A. Knopf.
Wickman, PO. (2004). The practical epistemologies of the classroom: a study of laboratory work. Science Education, 88 , 325–344.
Wu, HK, & Shah, P. (2004). Exploring visuospatial thinking in chemistry learning. Science Education, 88 (3), 465–492. doi: 10.1002/sce.10126 .
Download references
Acknowledgements
The authors would like to acknowledge all reviewers for their valuable comments that have helped us improve the manuscript.
Author information
Authors and affiliations.
University of Nicosia, 46, Makedonitissa Avenue, Egkomi, 1700, Nicosia, Cyprus
Maria Evagorou
University of Limerick, Limerick, Ireland
Sibel Erduran
University of Tampere, Tampere, Finland
Terhi Mäntylä
You can also search for this author in PubMed Google Scholar
Corresponding author
Correspondence to Maria Evagorou .
Additional information
Competing interests.
The authors declare that they have no competing interests.
Authors’ contributions
ME carried out the introductory literature review, the analysis of the first case study, and drafted the manuscript. SE carried out the analysis of the third case study and contributed towards the “Conclusions” section of the manuscript. TM carried out the second case study. All authors read and approved the final manuscript.
Rights and permissions
Open Access This article is distributed under the terms of the Creative Commons Attribution 4.0 International License ( https://creativecommons.org/licenses/by/4.0 ), which permits use, duplication, adaptation, distribution, and reproduction in any medium or format, as long as you give appropriate credit to the original author(s) and the source, provide a link to the Creative Commons license, and indicate if changes were made.
Reprints and permissions
About this article
Cite this article.
Evagorou, M., Erduran, S. & Mäntylä, T. The role of visual representations in scientific practices: from conceptual understanding and knowledge generation to ‘seeing’ how science works. IJ STEM Ed 2 , 11 (2015). https://doi.org/10.1186/s40594-015-0024-x
Download citation
Received : 29 September 2014
Accepted : 16 May 2015
Published : 19 July 2015
DOI : https://doi.org/10.1186/s40594-015-0024-x
Share this article
Anyone you share the following link with will be able to read this content:
Sorry, a shareable link is not currently available for this article.
Provided by the Springer Nature SharedIt content-sharing initiative
- Visual representations
- Epistemic practices
- Science learning
tableau.com is not available in your region.
- Business Essentials
- Leadership & Management
- Credential of Leadership, Impact, and Management in Business (CLIMB)
- Entrepreneurship & Innovation
- Digital Transformation
- Finance & Accounting
- Business in Society
- For Organizations
- Support Portal
- Media Coverage
- Founding Donors
- Leadership Team

- Harvard Business School →
- HBS Online →
- Business Insights →
Business Insights
Harvard Business School Online's Business Insights Blog provides the career insights you need to achieve your goals and gain confidence in your business skills.
- Career Development
- Communication
- Decision-Making
- Earning Your MBA
- Negotiation
- News & Events
- Productivity
- Staff Spotlight
- Student Profiles
- Work-Life Balance
- AI Essentials for Business
- Alternative Investments
- Business Analytics
- Business Strategy
- Business and Climate Change
- Design Thinking and Innovation
- Digital Marketing Strategy
- Disruptive Strategy
- Economics for Managers
- Entrepreneurship Essentials
- Financial Accounting
- Global Business
- Launching Tech Ventures
- Leadership Principles
- Leadership, Ethics, and Corporate Accountability
- Leading Change and Organizational Renewal
- Leading with Finance
- Management Essentials
- Negotiation Mastery
- Organizational Leadership
- Power and Influence for Positive Impact
- Strategy Execution
- Sustainable Business Strategy
- Sustainable Investing
- Winning with Digital Platforms
17 Data Visualization Techniques All Professionals Should Know

- 17 Sep 2019
There’s a growing demand for business analytics and data expertise in the workforce. But you don’t need to be a professional analyst to benefit from data-related skills.
Becoming skilled at common data visualization techniques can help you reap the rewards of data-driven decision-making , including increased confidence and potential cost savings. Learning how to effectively visualize data could be the first step toward using data analytics and data science to your advantage to add value to your organization.
Several data visualization techniques can help you become more effective in your role. Here are 17 essential data visualization techniques all professionals should know, as well as tips to help you effectively present your data.
Access your free e-book today.
What Is Data Visualization?
Data visualization is the process of creating graphical representations of information. This process helps the presenter communicate data in a way that’s easy for the viewer to interpret and draw conclusions.
There are many different techniques and tools you can leverage to visualize data, so you want to know which ones to use and when. Here are some of the most important data visualization techniques all professionals should know.
Data Visualization Techniques
The type of data visualization technique you leverage will vary based on the type of data you’re working with, in addition to the story you’re telling with your data .
Here are some important data visualization techniques to know:
- Gantt Chart
- Box and Whisker Plot
- Waterfall Chart
- Scatter Plot
- Pictogram Chart
- Highlight Table
- Bullet Graph
- Choropleth Map
- Network Diagram
- Correlation Matrices
1. Pie Chart

Pie charts are one of the most common and basic data visualization techniques, used across a wide range of applications. Pie charts are ideal for illustrating proportions, or part-to-whole comparisons.
Because pie charts are relatively simple and easy to read, they’re best suited for audiences who might be unfamiliar with the information or are only interested in the key takeaways. For viewers who require a more thorough explanation of the data, pie charts fall short in their ability to display complex information.
2. Bar Chart

The classic bar chart , or bar graph, is another common and easy-to-use method of data visualization. In this type of visualization, one axis of the chart shows the categories being compared, and the other, a measured value. The length of the bar indicates how each group measures according to the value.
One drawback is that labeling and clarity can become problematic when there are too many categories included. Like pie charts, they can also be too simple for more complex data sets.
3. Histogram

Unlike bar charts, histograms illustrate the distribution of data over a continuous interval or defined period. These visualizations are helpful in identifying where values are concentrated, as well as where there are gaps or unusual values.
Histograms are especially useful for showing the frequency of a particular occurrence. For instance, if you’d like to show how many clicks your website received each day over the last week, you can use a histogram. From this visualization, you can quickly determine which days your website saw the greatest and fewest number of clicks.
4. Gantt Chart

Gantt charts are particularly common in project management, as they’re useful in illustrating a project timeline or progression of tasks. In this type of chart, tasks to be performed are listed on the vertical axis and time intervals on the horizontal axis. Horizontal bars in the body of the chart represent the duration of each activity.
Utilizing Gantt charts to display timelines can be incredibly helpful, and enable team members to keep track of every aspect of a project. Even if you’re not a project management professional, familiarizing yourself with Gantt charts can help you stay organized.
5. Heat Map

A heat map is a type of visualization used to show differences in data through variations in color. These charts use color to communicate values in a way that makes it easy for the viewer to quickly identify trends. Having a clear legend is necessary in order for a user to successfully read and interpret a heatmap.
There are many possible applications of heat maps. For example, if you want to analyze which time of day a retail store makes the most sales, you can use a heat map that shows the day of the week on the vertical axis and time of day on the horizontal axis. Then, by shading in the matrix with colors that correspond to the number of sales at each time of day, you can identify trends in the data that allow you to determine the exact times your store experiences the most sales.
6. A Box and Whisker Plot

A box and whisker plot , or box plot, provides a visual summary of data through its quartiles. First, a box is drawn from the first quartile to the third of the data set. A line within the box represents the median. “Whiskers,” or lines, are then drawn extending from the box to the minimum (lower extreme) and maximum (upper extreme). Outliers are represented by individual points that are in-line with the whiskers.
This type of chart is helpful in quickly identifying whether or not the data is symmetrical or skewed, as well as providing a visual summary of the data set that can be easily interpreted.
7. Waterfall Chart

A waterfall chart is a visual representation that illustrates how a value changes as it’s influenced by different factors, such as time. The main goal of this chart is to show the viewer how a value has grown or declined over a defined period. For example, waterfall charts are popular for showing spending or earnings over time.
8. Area Chart

An area chart , or area graph, is a variation on a basic line graph in which the area underneath the line is shaded to represent the total value of each data point. When several data series must be compared on the same graph, stacked area charts are used.
This method of data visualization is useful for showing changes in one or more quantities over time, as well as showing how each quantity combines to make up the whole. Stacked area charts are effective in showing part-to-whole comparisons.
9. Scatter Plot

Another technique commonly used to display data is a scatter plot . A scatter plot displays data for two variables as represented by points plotted against the horizontal and vertical axis. This type of data visualization is useful in illustrating the relationships that exist between variables and can be used to identify trends or correlations in data.
Scatter plots are most effective for fairly large data sets, since it’s often easier to identify trends when there are more data points present. Additionally, the closer the data points are grouped together, the stronger the correlation or trend tends to be.
10. Pictogram Chart

Pictogram charts , or pictograph charts, are particularly useful for presenting simple data in a more visual and engaging way. These charts use icons to visualize data, with each icon representing a different value or category. For example, data about time might be represented by icons of clocks or watches. Each icon can correspond to either a single unit or a set number of units (for example, each icon represents 100 units).
In addition to making the data more engaging, pictogram charts are helpful in situations where language or cultural differences might be a barrier to the audience’s understanding of the data.
11. Timeline

Timelines are the most effective way to visualize a sequence of events in chronological order. They’re typically linear, with key events outlined along the axis. Timelines are used to communicate time-related information and display historical data.
Timelines allow you to highlight the most important events that occurred, or need to occur in the future, and make it easy for the viewer to identify any patterns appearing within the selected time period. While timelines are often relatively simple linear visualizations, they can be made more visually appealing by adding images, colors, fonts, and decorative shapes.
12. Highlight Table

A highlight table is a more engaging alternative to traditional tables. By highlighting cells in the table with color, you can make it easier for viewers to quickly spot trends and patterns in the data. These visualizations are useful for comparing categorical data.
Depending on the data visualization tool you’re using, you may be able to add conditional formatting rules to the table that automatically color cells that meet specified conditions. For instance, when using a highlight table to visualize a company’s sales data, you may color cells red if the sales data is below the goal, or green if sales were above the goal. Unlike a heat map, the colors in a highlight table are discrete and represent a single meaning or value.
13. Bullet Graph

A bullet graph is a variation of a bar graph that can act as an alternative to dashboard gauges to represent performance data. The main use for a bullet graph is to inform the viewer of how a business is performing in comparison to benchmarks that are in place for key business metrics.
In a bullet graph, the darker horizontal bar in the middle of the chart represents the actual value, while the vertical line represents a comparative value, or target. If the horizontal bar passes the vertical line, the target for that metric has been surpassed. Additionally, the segmented colored sections behind the horizontal bar represent range scores, such as “poor,” “fair,” or “good.”
14. Choropleth Maps

A choropleth map uses color, shading, and other patterns to visualize numerical values across geographic regions. These visualizations use a progression of color (or shading) on a spectrum to distinguish high values from low.
Choropleth maps allow viewers to see how a variable changes from one region to the next. A potential downside to this type of visualization is that the exact numerical values aren’t easily accessible because the colors represent a range of values. Some data visualization tools, however, allow you to add interactivity to your map so the exact values are accessible.
15. Word Cloud

A word cloud , or tag cloud, is a visual representation of text data in which the size of the word is proportional to its frequency. The more often a specific word appears in a dataset, the larger it appears in the visualization. In addition to size, words often appear bolder or follow a specific color scheme depending on their frequency.
Word clouds are often used on websites and blogs to identify significant keywords and compare differences in textual data between two sources. They are also useful when analyzing qualitative datasets, such as the specific words consumers used to describe a product.
16. Network Diagram

Network diagrams are a type of data visualization that represent relationships between qualitative data points. These visualizations are composed of nodes and links, also called edges. Nodes are singular data points that are connected to other nodes through edges, which show the relationship between multiple nodes.
There are many use cases for network diagrams, including depicting social networks, highlighting the relationships between employees at an organization, or visualizing product sales across geographic regions.
17. Correlation Matrix

A correlation matrix is a table that shows correlation coefficients between variables. Each cell represents the relationship between two variables, and a color scale is used to communicate whether the variables are correlated and to what extent.
Correlation matrices are useful to summarize and find patterns in large data sets. In business, a correlation matrix might be used to analyze how different data points about a specific product might be related, such as price, advertising spend, launch date, etc.
Other Data Visualization Options
While the examples listed above are some of the most commonly used techniques, there are many other ways you can visualize data to become a more effective communicator. Some other data visualization options include:
- Bubble clouds
- Circle views
- Dendrograms
- Dot distribution maps
- Open-high-low-close charts
- Polar areas
- Radial trees
- Ring Charts
- Sankey diagram
- Span charts
- Streamgraphs
- Wedge stack graphs
- Violin plots

Tips For Creating Effective Visualizations
Creating effective data visualizations requires more than just knowing how to choose the best technique for your needs. There are several considerations you should take into account to maximize your effectiveness when it comes to presenting data.
Related : What to Keep in Mind When Creating Data Visualizations in Excel
One of the most important steps is to evaluate your audience. For example, if you’re presenting financial data to a team that works in an unrelated department, you’ll want to choose a fairly simple illustration. On the other hand, if you’re presenting financial data to a team of finance experts, it’s likely you can safely include more complex information.
Another helpful tip is to avoid unnecessary distractions. Although visual elements like animation can be a great way to add interest, they can also distract from the key points the illustration is trying to convey and hinder the viewer’s ability to quickly understand the information.
Finally, be mindful of the colors you utilize, as well as your overall design. While it’s important that your graphs or charts are visually appealing, there are more practical reasons you might choose one color palette over another. For instance, using low contrast colors can make it difficult for your audience to discern differences between data points. Using colors that are too bold, however, can make the illustration overwhelming or distracting for the viewer.
Related : Bad Data Visualization: 5 Examples of Misleading Data
Visuals to Interpret and Share Information
No matter your role or title within an organization, data visualization is a skill that’s important for all professionals. Being able to effectively present complex data through easy-to-understand visual representations is invaluable when it comes to communicating information with members both inside and outside your business.
There’s no shortage in how data visualization can be applied in the real world. Data is playing an increasingly important role in the marketplace today, and data literacy is the first step in understanding how analytics can be used in business.
Are you interested in improving your analytical skills? Learn more about Business Analytics , our eight-week online course that can help you use data to generate insights and tackle business decisions.
This post was updated on January 20, 2022. It was originally published on September 17, 2019.

About the Author
Step 2: Understanding Visual Representation(s)
- First Online: 28 September 2021
Cite this chapter

- Daniel Bühler 2
504 Accesses
In the second HCD step, the context of use, including the users and the user tasks and goals, needs to be identified, described, and analyzed. This step usually consists in a close examination of real situations in which existing products are used by actual users. Since the context of use in the UIPP project was specified by the Universal Cognitive User Interface project, this chapter discusses universal characteristics of visual representations in HCI. That is, it describes in detail central properties and relations, it discusses existing pictogram systems, and it proposes a taxonomy of visual representations. For example, it argues that always two central properties must be considered: the design and the reference relation. The goal of the chapter is to achieve a general understanding of visual representations that might be the basis for the following steps in the process as much as for other design projects.
This is a preview of subscription content, log in via an institution to check access.
Access this chapter
- Available as EPUB and PDF
- Read on any device
- Instant download
- Own it forever
- Durable hardcover edition
- Dispatched in 3 to 5 business days
- Free shipping worldwide - see info
- Compact, lightweight edition
Tax calculation will be finalised at checkout
Purchases are for personal use only
Institutional subscriptions
De Souza has argued as early as in 1993 (pp. 771–772) that, in addition to findings in cognitive sciences, semiotics would lead to a better understanding of HCI.
Author information
Authors and affiliations.
Berlin, Germany
Daniel Bühler
You can also search for this author in PubMed Google Scholar
Corresponding author
Correspondence to Daniel Bühler .
Rights and permissions
Reprints and permissions
Copyright information
© 2021 The Author(s), under exclusive license to Springer Fachmedien Wiesbaden GmbH, part of Springer Nature
About this chapter
Bühler, D. (2021). Step 2: Understanding Visual Representation(s). In: Universal, Intuitive, and Permanent Pictograms. Springer, Wiesbaden. https://doi.org/10.1007/978-3-658-32310-3_2
Download citation
DOI : https://doi.org/10.1007/978-3-658-32310-3_2
Published : 28 September 2021
Publisher Name : Springer, Wiesbaden
Print ISBN : 978-3-658-32309-7
Online ISBN : 978-3-658-32310-3
eBook Packages : Computer Science Computer Science (R0)
Share this chapter
Anyone you share the following link with will be able to read this content:
Sorry, a shareable link is not currently available for this article.
Provided by the Springer Nature SharedIt content-sharing initiative
- Publish with us
Policies and ethics
- Find a journal
- Track your research
- X (Twitter)
Painting Pictures with Data: The Power of Visual Representations

Picture this. A chaotic world of abstract concepts and complex data, like a thousand-piece jigsaw puzzle. Each piece, a different variable, a unique detail.
Alone, they’re baffling, nearly indecipherable.
But together? They’re a masterpiece of visual information, a detailed illustration.
American data pioneer Edward Tufte , a notable figure in the graphics press, believed that the art of seeing is not limited to the physical objects around us. He stated, “The commonality between science and art is in trying to see profoundly – to develop strategies of seeing and showing.”
It’s in this context that we delve into the world of data visualization. This is a process where you create visual representations that foster understanding and enhance decision making.
It’s the transformation of data into visual formats. The information could be anything from theoretical frameworks and research findings to word problems. Or anything in-between. And it has the power to change the way you learn, work, and more.
And with the help of modern technology, you can take advantage of data visualization easier than ever today.
What are Visual Representations?
Think of visuals, a smorgasbord of graphical representation, images, pictures, and drawings. Now blend these with ideas, abstract concepts, and data.
You get visual representations . A powerful, potent blend of communication and learning.
As a more formal definition, visual representation is the use of images to represent different types of data and ideas.
They’re more than simply a picture. Visual representations organize information visually , creating a deeper understanding and fostering conceptual understanding. These can be concrete objects or abstract symbols or forms, each telling a unique story. And they can be used to improve understanding everywhere, from a job site to an online article. University professors can even use them to improve their teaching.
But this only scratches the surface of what can be created via visual representation.
Types of Visual Representation for Improving Conceptual Understanding
Graphs, spider diagrams, cluster diagrams – the list is endless!
Each type of visual representation has its specific uses. A mind map template can help you create a detailed illustration of your thought process. It illustrates your ideas or data in an engaging way and reveals how they connect.
Here are a handful of different types of data visualization tools that you can begin using right now.
1. Spider Diagrams

Spider diagrams , or mind maps, are the master web-weavers of visual representation.
They originate from a central concept and extend outwards like a spider’s web. Different ideas or concepts branch out from the center area, providing a holistic view of the topic.
This form of representation is brilliant for showcasing relationships between concepts, fostering a deeper understanding of the subject at hand.
2. Cluster Diagrams

As champions of grouping and classifying information, cluster diagrams are your go-to tools for usability testing or decision making. They help you group similar ideas together, making it easier to digest and understand information.
They’re great for exploring product features, brainstorming solutions, or sorting out ideas.
3. Pie Charts

Pie charts are the quintessential representatives of quantitative information.
They are a type of visual diagrams that transform complex data and word problems into simple symbols. Each slice of the pie is a story, a visual display of the part-to-whole relationship.
Whether you’re presenting survey results, market share data, or budget allocation, a pie chart offers a straightforward, easily digestible visual representation.
4. Bar Charts

If you’re dealing with comparative data or need a visual for data analysis, bar charts or graphs come to the rescue.
Bar graphs represent different variables or categories against a quantity, making them perfect for representing quantitative information. The vertical or horizontal bars bring the data to life, translating numbers into visual elements that provide context and insights at a glance.
Visual Representations Benefits
1. deeper understanding via visual perception.
Visual representations aren’t just a feast for the eyes; they’re food for thought. They offer a quick way to dig down into more detail when examining an issue.
They mold abstract concepts into concrete objects, breathing life into the raw, quantitative information. As you glimpse into the world of data through these visualization techniques , your perception deepens.
You no longer just see the data; you comprehend it, you understand its story. Complex data sheds its mystifying cloak, revealing itself in a visual format that your mind grasps instantly. It’s like going from a two dimensional to a three dimensional picture of the world.
2. Enhanced Decision Making
Navigating through different variables and relationships can feel like walking through a labyrinth. But visualize these with a spider diagram or cluster diagram, and the path becomes clear. Visual representation is one of the most efficient decision making techniques .
Visual representations illuminate the links and connections, presenting a fuller picture. It’s like having a compass in your decision-making journey, guiding you toward the correct answer.
3. Professional Development
Whether you’re presenting research findings, sharing theoretical frameworks, or revealing historical examples, visual representations are your ace. They equip you with a new language, empowering you to convey your message compellingly.
From the conference room to the university lecture hall, they enhance your communication and teaching skills, propelling your professional development. Try to create a research mind map and compare it to a plain text document full of research documentation and see the difference.
4. Bridging the Gap in Data Analysis
What is data visualization if not the mediator between data analysis and understanding? It’s more than an actual process; it’s a bridge.
It takes you from the shores of raw, complex data to the lands of comprehension and insights. With visualization techniques, such as the use of simple symbols or detailed illustrations, you can navigate through this bridge effortlessly.
5. Enriching Learning Environments
Imagine a teaching setting where concepts are not just told but shown. Where students don’t just listen to word problems but see them represented in charts and graphs. This is what visual representations bring to learning environments.
They transform traditional methods into interactive learning experiences, enabling students to grasp complex ideas and understand relationships more clearly. The result? An enriched learning experience that fosters conceptual understanding.
6. Making Abstract Concepts Understandable
In a world brimming with abstract concepts, visual representations are our saving grace. They serve as translators, decoding these concepts into a language we can understand.
Let’s say you’re trying to grasp a theoretical framework. Reading about it might leave you puzzled. But see it laid out in a spider diagram or a concept map, and the fog lifts. With its different variables clearly represented, the concept becomes tangible.
Visual representations simplify the complex, convert the abstract into concrete, making the inscrutable suddenly crystal clear. It’s the power of transforming word problems into visual displays, a method that doesn’t just provide the correct answer. It also offers a deeper understanding.
How to Make a Cluster Diagram?
Ready to get creative? Let’s make a cluster diagram.
First, choose your central idea or problem. This goes in the center area of your diagram. Next, think about related topics or subtopics. Draw lines from the central idea to these topics. Each line represents a relationship.

While you can create a picture like this by drawing, there’s a better way.
Mindomo is a mind mapping tool that will enable you to create visuals that represent data quickly and easily. It provides a wide range of templates to kick-start your diagramming process. And since it’s an online site, you can access it from anywhere.
With a mind map template, creating a cluster diagram becomes an effortless process. This is especially the case since you can edit its style, colors, and more to your heart’s content. And when you’re done, sharing is as simple as clicking a button.
A Few Final Words About Information Visualization
To wrap it up, visual representations are not just about presenting data or information. They are about creating a shared understanding, facilitating learning, and promoting effective communication. Whether it’s about defining a complex process or representing an abstract concept, visual representations have it all covered. And with tools like Mindomo , creating these visuals is as easy as pie.
In the end, visual representation isn’t just about viewing data, it’s about seeing, understanding, and interacting with it. It’s about immersing yourself in the world of abstract concepts, transforming them into tangible visual elements. It’s about seeing relationships between ideas in full color. It’s a whole new language that opens doors to a world of possibilities.
The correct answer to ‘what is data visualization?’ is simple. It’s the future of learning, teaching, and decision-making.
Keep it smart, simple, and creative! The Mindomo Team
Related Posts

Top 5 Fishbone Diagram Templates You Need To Know About!

Mastering Your Mind: Exploring Effective Visualization Techniques

The Power of an Idea Map: Your Guide to Creative Thinking & Organizing Ideas

Innovation Unleashed: Mind Mapping vs Brainstorming in the Generation of Game-Changing Ideas

The Key to Success with Ingredients for a Fulfilling Life

Cracking the Code to Creative Thinking: Ignite Your Brain and Unleash Your Ideas
Write a comment cancel reply.
Save my name, email, and website in this browser for the next time I comment.
- Our Mission
The Power of Visualization in Math
Creating visual representations for math students can open up understanding. We have resources you can use in class tomorrow.

When do you know it’s time to try something different in your math lesson?
For me, I knew the moment I read this word problem to my fifth-grade summer school students: “On average, the sun’s energy density reaching Earth’s upper atmosphere is 1,350 watts per square meter. Assume the incident, monochromatic light has a wavelength of 800 nanometers (each photon has an energy of 2.48 × 10 -19 joules at this wavelength). How many photons are incident on the Earth’s upper atmosphere in one second?”

My students couldn’t get past the language, the sizes of the different numbers, or the science concepts addressed in the question. In short, I had effectively shut them down, and I needed a new approach to bring them back to their learning. So I started drawing on the whiteboard and created something with a little whimsy, a cartoon photon asking how much energy a photon has.
Immediately, students started yelling out, “2.48 × 10 -19 joules,” and they could even cite the text where they had learned the information. I knew I was on to something, so the next thing I drew was a series of boxes with our friend the photon.
If all of the photons in the image below were to hit in one second, how much energy is represented in the drawing?

Students realized that we were just adding up all the individual energy from each photon and then quickly realized that this was multiplication. And then they knew that the question we were trying to answer was just figuring out the number of photons, and since we knew the total energy in one second, we could compute the number of photons by division.
The point being, we reached a place where my students were able to process the learning. The power of the visual representation made all the difference for these students, and being able to sequence through the problem using the visual supports completely changed the interactions they were having with the problem.
If you’re like me, you’re thinking, “So the visual representations worked with this problem, but what about other types of problems? Surely there isn’t a visual model for every problem!”
The power of this moment, the change in the learning environment, and the excitement of my fifth graders as they could not only understand but explain to others what the problem was about convinced me it was worth the effort to pursue visualization and try to answer these questions: Is there a process to unlock visualizations in math? And are there resources already available to help make mathematics visual?

I realized that the first step in unlocking visualization as a scaffold for students was to change the kind of question I was asking myself. A powerful question to start with is: “How might I represent this learning target in a visual way?” This reframing opens a world of possible representations that we might not otherwise have considered. Thinking about many possible visual representations is the first step in creating a good one for students.
The Progressions published in tandem with the Common Core State Standards for mathematics are one resource for finding specific visual models based on grade level and standard. In my fifth-grade example, what I constructed was a sequenced process to develop a tape diagram—a type of visual model that uses rectangles to represent the parts of a ratio. I didn’t realize it, but to unlock my thinking I had to commit to finding a way to represent the problem in a visual way. Asking yourself a very simple series of questions leads you down a variety of learning paths, and primes you for the next step in the sequence—finding the right resources to complete your visualization journey.
Posing the question of visualization readies your brain to identify the right tool for the desired learning target and your students. That is, you’ll more readily know when you’ve identified the right tool for the job for your students. There are many, many resources available to help make this process even easier, and I’ve created a matrix of clickable tools, articles, and resources .
The process to visualize your math instruction is summarized at the top of my Visualizing Math graphic; below that is a mix of visualization strategies and resources you can use tomorrow in your classroom.
Our job as educators is to set a stage that maximizes the amount of learning done by our students, and teaching students mathematics in this visual way provides a powerful pathway for us to do our job well. The process of visualizing mathematics tests your abilities at first, and you’ll find that it makes both you and your students learn.
- Reviews / Why join our community?
- For companies
- Frequently asked questions
5. Visual Representation
How can you design computer displays that are as meaningful as possible to human viewers? Answering this question requires understanding of visual representation - the principles by which markings on a surface are made and interpreted. The analysis in this article addresses the most important principles of visual representation for screen design, introduced with examples from the early history of graphical user interfaces . In most cases, these principles have been developed and elaborated within whole fields of study and professional skill - typography , cartography, engineering and architectural draughting, art criticism and semiotics . Improving on the current conventions requires serious skill and understanding. Nevertheless, interaction designers should be able, when necessary, to invent new visual representations.
Introduction to Visual Representation by Alan Blackwell
Alan Blackwell on applying theories of Visual Representation
- 5.1 Typography and text
For many years, computer displays resembled paper documents. This does not mean that they were simplistic or unreasonably constrained. On the contrary, most aspects of modern industrial society have been successfully achieved using the representational conventions of paper, so those conventions seem to be powerful ones. Information on paper can be structured using tabulated columns, alignment, indentation and emphasis , borders and shading. All of those were incorporated into computer text displays. Interaction conventions, however, were restricted to operations of the typewriter rather than the pencil. Each character typed would appear at a specific location. Locations could be constrained, like filling boxes on a paper form. And shortcut command keys could be defined using onscreen labels or paper overlays. It is not text itself, but keyboard interaction with text that is limited and frustrating compared to what we can do with paper (Sellen and Harper 2001).
But despite the constraints on keyboard interaction, most information on computer screens is still represented as text. Conventions of typography and graphic design help us to interpret that text as if it were on a page, and human readers benefit from many centuries of refinement in text document design. Text itself, including many writing systems as well as specialised notations such as algebra, is a visual representation that has its own research and educational literature. Documents that contain a mix of bordered or coloured regions containing pictures, text and diagrammatic elements can be interpreted according to the conventions of magazine design, poster advertising, form design, textbooks and encyclopaedias. Designers of screen representations should take care to properly apply the specialist knowledge of those graphic and typographic professions. Position on the page, use of typographic grids, and genre-specific illustrative conventions should all be taken into account.

Author/Copyright holder: Unknown (pending investigation). Copyright terms and licence: Unknown (pending investigation). See section "Exceptions" in the copyright terms below.
Figure 5.1 : Contemporary example from the grid system website
Figure 5.2 : Example of a symbolic algebra expression (the single particle solution to Schrodinger's equation)

Figure 5.3 : Table layout of funerals from the plague in London in 1665

Figure 5.4 : Tabular layout of the first page of the Gutenberg Bible: Volume 1, Old Testament, Epistle of St. Jerome. The Gutenberg Bible was printed by Johannes Gutenberg, in Mainz, Germany in the 1450s
- 5.1.1 Summary
Most screen-based information is interpreted according to textual and typographic conventions, in which graphical elements are arranged within a visual grid, occasionally divided or contained with ruled and coloured borders. Where to learn more:
thegridsystem.org
Resnick , Elizabeth (2003): Design for Communication: Conceptual Graphic Design Basics. Wiley
- 5.2 Maps and graphs
The computer has, however, also acquired a specialised visual vocabulary and conventions. Before the text-based computer terminal (or 'glass teletype') became ubiquitous, cathode ray tube displays were already used to display oscilloscope waves and radar echoes. Both could be easily interpreted because of their correspondence to existing paper conventions. An oscilloscope uses a horizontal time axis to trace variation of a quantity over time, as pioneered by William Playfair in his 1786 charts of the British economy. A radar screen shows direction and distance of objects from a central reference point, just as the Hereford Mappa Mundi of 1300 organised places according to their approximate direction and distance from Jerusalem. Many visual displays on computers continue to use these ancient but powerful inventions - the map and the graph. In particular, the first truly large software project, the SAGE air defense system, set out to present data in the form of an augmented radar screen - an abstract map, on which symbols and text could be overlaid. The first graphics computer, the Lincoln Laboratory Whirlwind, was created to show maps, not text.

Figure 5.5 : The technique invented by William Playfair, for visual representation of time series data.

Author/Copyright holder: Courtesy of Premek. V. Copyright terms and licence: pd (Public Domain (information that is common property and contains no original authorship)).
Figure 5.6 : Time series data as shown on an oscilloscope screen

Author/Copyright holder: Courtesy of Remi Kaupp. Copyright terms and licence: CC-Att-SA (Creative Commons Attribution-ShareAlike 3.0 Unported)
Figure 5.7 : Early radar screen from HMS Belfast built in 1936

Author/Copyright holder: Courtesy of NOAA's National Weather Service. Copyright terms and licence: pd (Public Domain (information that is common property and contains no original authorship)).
Figure 5.8 : Early weather radar - Hurricane Abby approaching the coast of British Honduras in 1960

Figure 5.9 : The Hereford Mappa Mundi of 1300 organised places according to their approximate direction and distance from Jerusalem

Author/Copyright holder: Courtesy of Wikipedia. Copyright terms and licence: Unknown (pending investigation). See section "Exceptions" in the copyright terms below.
Figure 5.10 : The SAGE system in use. The SAGE system used light guns as interaction devices.

Author/Copyright holder: The MITRE Corporation. Copyright terms and licence: All Rights Reserved. Reproduced with permission. See section "Exceptions" in the copyright terms below.
Figure 5.11 : The Whirlwind computer at the MIT Lincoln Laboratory
- 5.2.1 Summary
Basic diagrammatic conventions rely on quantitative correspondence between a direction on the surface and a continuous quantity such as time or distance. These should follow established conventions of maps and graphs.
Where to learn more:
MacEachren , Alan M. (2004): How Maps Work: Representation, Visualization, and Design. The Guilford Press
- 5.3 Schematic drawings
Ivan Sutherland's groundbreaking PhD research with Whirlwind's successor TX-2 introduced several more sophisticated alternatives (Sutherland 1963). The use of a light pen allowed users to draw arbitrary lines, rather than relying on control keys to select predefined options. An obvious application, in the engineering context of Massachusetts Institute of Technology (MIT) where Sutherland worked, was to make engineering drawings such as the girder bridge in Figure 13. Lines on the screen are scaled versions of the actual girders, and text information can be overlaid to give details of force calculations. Plans of this kind, as a visual representation, are closely related to maps. However, where the plane of a map corresponds to a continuous surface, engineering drawings need not be continuous. Each set of connected components must share the same scale, but white space indicates an interpretive break, so that independent representations can potentially share the same divided surface - a convention introduced in Diderot's encyclopedia of 1772, which showed pictures of multiple objects on a page, but cut them loose from any shared pictorial context.

Author/Copyright holder: Courtesy of Ivan Sutherland. Copyright terms and licence: CC-Att-SA-3 (Creative Commons Attribution-ShareAlike 3.0).
Figure 5.12 : The TX-2 graphics computer, running Ivan Sutherland's Sketchpad software

Figure 5.13 : An example of a force diagram created using Sutherland's Sketchpad

Figure 5.14 : A page from the Encyclopédie of Diderot and d'Alembert, combining pictorial elements with diagrammatic lines and categorical use of white space.
- 5.3.1 Summary
Engineering drawing conventions allow schematic views of connected components to be shown in relative scale, and with text annotations labelling the parts. White space in the representation plane can be used to help the reader distinguish elements from each other rather than directly representing physical space. Where to learn more:
Engineering draughting textbooks
Ferguson , Eugene S. (1994): Engineering and the Mind's Eye. MIT Press
- 5.4 Pictures
The examples so far may seem rather abstract. Isn't the most 'natural' visual representation simply a picture of the thing you are trying to represent? In that case, what is so hard about design? Just point a camera, and take the picture. It seems like pictures are natural and intuitive, and anyone should be able to understand what they mean. Of course, you might want the picture to be more or less artistic, but that isn't a technical concern, is it? Well, Ivan Sutherland also suggested the potential value that computer screens might offer as artistic tools. His Sketchpad system was used to create a simple animated cartoon of a winking girl. We can use this example to ask whether pictures are necessarily 'natural', and what design factors are relevant to the selection or creation of pictures in an interaction design context.
We would not describe Sutherland's girl as 'realistic', but it is an effective representation of a girl. In fact, it is an unusually good representation of a winking girl, because all the other elements of the picture are completely abstract and generic. It uses a conventional graphic vocabulary of lines and shapes that are understood in our culture to represent eyes, mouths and so on - these elements do not draw attention to themselves, and therefore highlight the winking eye. If a realistic picture of an actual person was used instead, other aspects of the image (the particular person) might distract the viewer from this message.

Figure 5.15 : Sutherland's 'Winking Girl' drawing, created with the Sketchpad system
It is important, when considering the design options for pictures, to avoid the 'resemblance fallacy', i.e. that drawings are able to depict real object or scenes because the viewer's perception of the flat image simulates the visual perception of a real scene. In practice, all pictures rely on conventions of visual representation, and are relatively poor simulations of natural engagement with physical objects, scenes and people. We are in the habit of speaking approvingly of some pictures as more 'realistic' than others (photographs, photorealistic ray-traced renderings, 'old master' oil paintings), but this simply means that they follow more rigorously a particular set of conventions. The informed designer is aware of a wide range of pictorial conventions and options.
As an example of different pictorial conventions, consider the ways that scenes can be rendered using different forms of artistic perspective. The invention of linear perspective introduced a particular convention in which the viewer is encouraged to think of the scene as perceived through a lens or frame while holding his head still, so that nearby objects occupy a disproportionate amount of the visual field. Previously, pictorial representations more often varied the relative size of objects according to their importance - a kind of 'semantic' perspective. Modern viewers tend to think of the perspective of a camera lens as being most natural, due to the ubiquity of photography, but we still understand and respect alternative perspectives, such as the isometric perspective of the pixel art group eBoy, which has been highly influential on video game style.

Author/Copyright holder: Courtesy of Masaccio (1401-1428). Copyright terms and licence: pd (Public Domain (information that is common property and contains no original authorship))
Figure 5.16 : Example of an early work by Masaccio, demonstrating a 'perspective' in which relative size shows symbolic importance

Author/Copyright holder: eBoy.com. Copyright terms and licence: All Rights Reserved. Reproduced with permission. See section "Exceptions" in the copyright terms below.
Figure 5.17 : Example of the strict isometric perspective used by the eBoy group

Author/Copyright holder: Courtesy of Masaccio (1401-1428). Copyright terms and licence: pd (Public Domain (information that is common property and contains no original authorship)).
Figure 5.18 : Masaccio's mature work The Tribute Money, demonstrating linear perspective
As with most conventions of pictorial representation, new perspective rendering conventions are invented and esteemed for their accuracy by critical consensus, and only more slowly adopted by untrained readers. The consensus on preferred perspective shifts across cultures and historical periods. It would be naïve to assume that the conventions of today are the final and perfect product of technical evolution. As with text, we become so accustomed to interpreting these representations that we are blind to the artifice. But professional artists are fully aware of the conventions they use, even where they might have mechanical elements - the way that a photograph is framed changes its meaning, and a skilled pencil drawing is completely unlike visual edge-detection thresholds. A good pictorial representation need not simulate visual experience any more than a good painting of a unicorn need resemble an actual unicorn. When designing user interfaces, all of these techniques are available for use, and new styles of pictorial rendering are constantly being introduced.
- 5.4.1 Summary
Pictorial representations, including line drawings, paintings, perspective renderings and photographs rely on shared interpretive conventions for their meaning. It is naïve to treat screen representations as though they were simulations of experience in the physical world. Where to learn more:
Micklewright , Keith (2005): Drawing: Mastering the Language of Visual Expression. Harry N. Abrams
Stroebel , Leslie, Todd , Hollis and Zakia , Richard (1979): Visual Concepts for Photographers. Focal Press
- 5.5 Node-and-link diagrams
The first impulse of a computer scientist, when given a pencil, seems to be to draw boxes and connect them with lines. These node and link diagrams can be analysed in terms of the graph structures that are fundamental to the study of algorithms (but unrelated to the visual representations known as graphs or charts). A predecessor of these connectivity diagrams can be found in electrical circuit schematics, where the exact location of components, and the lengths of the wires, can be arranged anywhere, because they are irrelevant to the circuit function. Another early program created for the TX-2, this time by Ivan Sutherland's brother Bert, allowed users to create circuit diagrams of this kind. The distinctive feature of a node-and-link connectivity diagram is that, since the position of each node is irrelevant to the operation of the circuit, it can be used to carry other information. Marian Petre's research into the work of electronics engineers (Petre 1995) catalogued the ways in which they positioned components in ways that were meaningful to human readers, but not to the computer - like the blank space between Diderot's objects this is a form of 'secondary notation' - use of the plane to assist the reader in ways not related to the technical content.
Circuit connectivity diagrams have been most widely popularised through the London Underground diagram, an invention of electrical engineer Henry Beck. The diagram clarified earlier maps by exploiting the fact that most underground travellers are only interested in order and connectivity, not location, of the stations on the line. (Sadly, the widespread belief that a 'diagram' will be technical and hard to understand means that most people describe this as the London Undergound 'map', despite Beck's insistence on his original term).

Author/Copyright holder: Courtesy of Harry C. Beck and possibly F. H. Stingemore, born 1890, died 1954. Stingmore designed posters for the Underground Group and London Transport 1914-1942. Copyright terms and licence: Unknown (pending investigation). See section "Exceptions" in the copyright terms below.
Figure 5.19 : Henry Beck's London Underground Diagram (1933)

Author/Copyright holder: Computer History Museum, Mountain View, CA, USA. Copyright terms and licence: All Rights Reserved. Reproduced with permission. See section "Exceptions" in the copyright terms below.
Figure 5.20 : Node and link diagram of the kind often drawn by computing professionals

Figure 5.21 : Map of the London Underground network, as it was printed before the design of Beck's diagram (1932)
- 5.5.1 Summary
Node and link diagrams are still widely perceived as being too technical for broad acceptance. Nevertheless, they can present information about ordering and relationships clearly, especially if consideration is given to the value of allowing human users to specify positions. Where to learn more:
Diagrammatic representation books
Lowe , Ric (1992): Successful Instructional Diagram.
- 5.6 Icons and symbols
Maps frequently use symbols to indicate specific kinds of landmark. Sometimes these are recognisably pictorial (the standard symbols for tree and church), but others are fairly arbitrary conventions (the symbol for a railway station). As the resolution of computer displays increased in the 1970s, a greater variety of symbols could be differentiated, by making them more detailed, as in the MIT SDMS (Spatial Data Management System) that mapped a naval battle scenario with symbols for different kinds of ship. However, the dividing line between pictures and symbols is ambiguous. Children's drawings of houses often use conventional symbols (door, four windows, triangle roof and chimney) whether or not their own house has two storeys, or a fireplace. Letters of the Latin alphabet are shapes with completely arbitrary relationship to their phonetic meaning, but the Korean phonetic alphabet is easier to learn because the forms mimic the shape of the mouth when pronouncing those sounds. The field of semiotics offers sophisticated ways of analysing the basis on which marks correspond to meanings. In most cases, the best approach for an interaction designer is simply to adopt familiar conventions. When these do not exist, the design task is more challenging.
It is unclear which of the designers working on the Xerox Star coined the term 'icon' for the small pictures symbolising different kinds of system object. David Canfield Smith winningly described them as being like religious icons, which he said were pictures standing for (abstract) spiritual concepts. But 'icon' is also used as a technical term in semiotics. Unfortunately, few of the Xerox team had a sophisticated understanding of semiotics. It was fine art PhD Susan Kare's design work on the Apple Macintosh that established a visual vocabulary which has informed the genre ever since. Some general advice principles are offered by authors such as Horton (1994), but the successful design of icons is still sporadic. Many software publishers simply opt for a memorable brand logo, while others seriously misjudge the kinds of correspondence that are appropriate (my favourite blooper was a software engineering tool in which a pile of coins was used to access the 'change' command).
It has been suggested that icons, being pictorial, are easier to understand than text, and that pre-literate children, or speakers of different languages, might thereby be able to use computers without being able to read. In practice, most icons simply add decoration to text labels, and those that are intended to be self-explanatory must be supported with textual tooltips. The early Macintosh icons, despite their elegance, were surprisingly open to misinterpretation. One PhD graduate of my acquaintance believed that the Macintosh folder symbol was a briefcase (the folder tag looked like a handle), which allowed her to carry her files from place to place when placed inside it. Although mistaken, this belief never caused her any trouble - any correspondence can work, so long as it is applied consistently.
Copyright terms and licence: pd (Public Domain (information that is common property and contains no original authorship)).
Figure 5.22 : In art, the term Icon (from Greek, eikon, "image") commonly refers to religious paintings in Eastern Orthodox, Oriental Orthodox, and Eastern-rite Catholic jurisdictions. Here a 6th-century encaustic icon from Saint Catherine's Monastery, Mount Sinai
Author/Copyright holder: Apple Computer, Inc. Copyright terms and licence: All Rights Reserved. Reproduced with permission. See section "Exceptions" in the copyright terms below.
Figure 5.23 : In computing, David Canfield Smith described computer icons as being like religious icons, which he said were pictures standing for (abstract) spiritual concepts.
- 5.6.1 Summary
The design of simple and memorable visual symbols is a sophisticated graphic design skill. Following established conventions is the easiest option, but new symbols must be designed with an awareness of what sort of correspondence is intended - pictorial, symbolic, metonymic (e.g. a key to represent locking), bizarrely mnemonic, but probably not monolingual puns. Where to learn more:
Napoles , Veronica (1987): Corporate Identity Design.
- 5.7 Visual metaphor
The ambitious graphic designs of the Xerox Star/Alto and Apple Lisa/Macintosh were the first mass-market visual interfaces. They were marketed to office professionals, making the 'cover story' that they resembled an office desktop a convenient explanatory device. Of course, as was frequently noted at the time, these interfaces behaved nothing like a real desktop. The mnemonic symbol for file deletion (a wastebasket) was ridiculous if interpreted as an object placed on a desk. And nobody could explain why the desk had windows in it (the name was derived from the 'clipping window' of the graphics architecture used to implement them - it was at some later point that they began to be explained as resembling sheets of paper on a desk). There were immediate complaints from luminaries such as Alan Kay and Ted Nelson that strict analogical correspondence to physical objects would become obstructive rather than instructive. Nevertheless, for many years the marketing story behind the desktop metaphor was taken seriously, despite the fact that all attempts to improve the Macintosh design with more elaborate visual analogies , as in General Magic and Microsoft Bob, subsequently failed.
The 'desktop' can be far more profitably analysed (and extended) by understanding the representational conventions that it uses. The size and position of icons and windows on the desktop has no meaning, they are not connected, and there is no visual perspective, so it is neither a map, graph nor picture. The real value is the extent to which it allows secondary notation, with the user creating her own meaning by arranging items as she wishes. Window borders separate areas of the screen into different pictorial, text or symbolic contexts as in the typographic page design of a textbook or magazine. Icons use a large variety of conventions to indicate symbolic correspondence to software operations and/or company brands, but they are only occasionally or incidentally organised into more complex semiotic structures.
Author/Copyright holder:Apple Computer, Inc and Computer History Museum, Mountain View, CA. Copyright terms and licence: All Rights Reserved. Reproduced with permission. See section "Exceptions" in the copyright terms below.
Figure 5.24 : Apple marketed the visual metaphor in 1983 as a key benefit of the Lisa computer. This advertisement said 'You can work with Lisa the same familiar way you work at your desk'. However a controlled study by Carroll and Mazur (1986) found that the claim for immediately familiar operation may have been exaggerated.

Figure 5.25 : The Xerox Alto and Apple Lisa, early products in which bitmapped displays allowed pictorial icons to be used as mnemonic cues within the 'desktop metaphor'

Author/Copyright holder: Courtesy of Mschlindwein. Copyright terms and licence: CC-Att-SA (Creative Commons Attribution-ShareAlike 3.0 Unported).
Figure 5.26 : Apple Lisa
- 5.7.1 Summary
Theories of visual representation, rather than theories of visual metaphor, are the best approach to explaining the conventional Macintosh/Windows 'desktop'. There is huge room for improvement. Where to learn more:
Blackwell , Alan (2006): The reification of metaphor as a design tool . In ACM Transactions on Computer-Human Interaction , 13 (4) pp. 490-530
- 5.8 Unified theories of visual representation
The analysis in this article has addressed the most important principles of visual representation for screen design, introduced with examples from the early history of graphical user interfaces. In most cases, these principles have been developed and elaborated within whole fields of study and professional skill - typography, cartography, engineering and architectural draughting, art criticism and semiotics. Improving on the current conventions requires serious skill and understanding. Nevertheless, interaction designers should be able, when necessary, to invent new visual representations.
One approach is to take a holistic perspective on visual language, information design, notations, or diagrams. Specialist research communities in these fields address many relevant factors from low-level visual perception to critique of visual culture. Across all of them, it can be necessary to ignore (or not be distracted by) technical and marketing claims, and to remember that all visual representations simply comprise marks on a surface that are intended to correspond to things understood by the reader. The two dimensions of the surface can be made to correspond to physical space (in a map), to dimensions of an object, to a pictorial perspective, or to continuous abstract scales (time or quantity). The surface can also be partitioned into regions that should be interpreted differently. Within any region, elements can be aligned, grouped, connected or contained in order to express their relationships. In each case, the correspondence between that arrangement, and the intended interpretation, must be understood by convention, explained, or derived from the structural and perceptual properties of marks on the plane. Finally, any individual element might be assigned meaning according to many different semiotic principles of correspondence.
The following table summarises holistic views, as introduced above, drawing principally on the work of Bertin, Richards, MacEachren, Blackwell & Engelhardt and Engelhardt. Where to learn more:
Engelhardt , Yuri (2002). The Language of Graphics. A framework for the analysis of syntax and meaning in maps, charts and diagrams (PhD Thesis) . University of Amsterdam
Table 5.1 : Summary of the ways in which graphical representations can be applied in design, via different systems of correspondence
Table 5.2 : Screenshot from the site gapminder.org, illustrating a variety of correspondence conventions used in different parts of the page
As an example of how one might analyse (or working backwards, design) a complex visual representation, consider the case of musical scores. These consist of marks on a paper surface, bound into a multi-page book, that is placed on a stand at arms length in front of a performer. Each page is vertically divided into a number of regions, visually separated by white space and grid alignment cues. The regions are ordered, with that at the top of the page coming first. Each region contains two quantitative axes, with the horizontal axis representing time duration, and the vertical axis pitch. The vertical axis is segmented by lines to categorise pitch class. Symbols placed at a given x-y location indicate a specific pitched sound to be initiated at a specific time. A conventional symbol set indicates the duration of the sound. None of the elements use any variation in colour, saturation or texture. A wide variety of text labels and annotation symbols are used to elaborate these basic elements. Music can be, and is, also expressed using many other visual representations (see e.g. Duignan for a survey of representations used in digital music processing).
- 5.9 Where to learn more
The historical examples of early computer representations used in this article are mainly drawn from Sutherland (Ed. Blackwell and Rodden 2003), Garland (1994), and Blackwell (2006). Historical reviews of visual representation in other fields include Ferguson (1992), Pérez-Gómez and Pelletier (1997), McCloud (1993), Tufte (1983). Reviews of human perceptual principles can be found in Gregory (1970), Ittelson (1996), Ware (2004), Blackwell (2002). Advice on principles of interaction with visual representation is distributed throughout the HCI literature, but classics include Norman (1988), Horton (1994), Shneiderman ( Shneiderman and Plaisant 2009, Card et al 1999, Bederson and Shneiderman 2003) and Spence (2001). Green's Cognitive Dimensions of Notations framework has for many years provided a systematic classification of the design parameters in interactive visual representations. A brief introduction is provided in Blackwell and Green (2003).
Research on visual representation topics is regularly presented at the Diagrams conference series (which has a particular emphasis on cognitive science), the InfoDesign and Vision Plus conferences (which emphasise graphic and typographic information design), the Visual Languages and Human-Centric Computing symposia (emphasising software tools and development), and the InfoVis and Information Visualisation conferences (emphasising quantitative and scientific data visualisation ).
- 5.9.0.1 IV - International Conference on Information Visualization
2008 2007 2006 2005 2004 2003 2002 2001 2000 1999 1998
- 5.9.0.2 DIAGRAMS - International Conference on the Theory and Application of Diagrams
2008 2006 2004 2002 2000
- 5.9.0.3 VL-HCC - Symposium on Visual Languages and Human Centric Computing
2008 2007 2007 2006 2005 2004 2003 2002 2001 2000 1999 1998 1997 1996 1995 1994 1993 1992 1991 1990
- 5.9.0.4 InfoVis - IEEE Symposium on Information Visualization
2005 2004 2003 2002 2001 2000 1999 1998 1997 1995
- 5.10 References
Anderson , Michael, Meyer , Bernd and Olivier , Patrick (2002): Diagrammatic Representation and Reasoning. London, UK,
Bederson , Benjamin B. and Shneiderman , Ben (2003): The Craft of Information Visualization : Readings and Reflections. Morgan Kaufman Publishers
Bertin , Jacques (1967): Semiology of Graphics: Diagrams, Networks, Maps (Sémiologie graphique: Les diagrammes - Les réseaux - Les cartes). English translation by W. J. Berg. Madison, WI, USA, University of Wisconsin Press
Blackwell , Alan (2002): Psychological perspectives on diagrams and their users. In: Anderson , Michael, Meyer , Bernd and Olivier , Patrick (eds.). "Diagrammatic Representation and Reasoning". London, UK: pp. 109-123
Blackwell , Alan and Engelhardt , Yuri (2002): A Meta-Taxonomy for Diagram Research. In: Anderson , Michael, Meyer , Bernd and Olivier , Patrick (eds.). "Diagrammatic Representation and Reasoning". London, UK: pp. 47-64
Blackwell , Alan and Green , T. R. G. (2003): Notational Systems - The Cognitive Dimensions of Notations Framework. In: Carroll , John M. (ed.). "HCI Models, Theories, and Frameworks". San Francisco: Morgan Kaufman Publisherspp. 103-133
Carroll , John M. and Mazur , Sandra A. (1986): LisaLearning . In Computer , 19 (11) pp. 35-49
Garland , Ken (1994): Mr . Beck's Underground Map. Capital Transport Publishing
Goodman , Nelson (1976): Languages of Art. Hackett Publishing Company
Gregory , Richard L. (1970): The Intelligent Eye. London, Weidenfeld and Nicolson
Horton , William (1994): The Icon Book: Visual Symbols for Computer Systems and Documentation. John Wiley and Sons
Ittelson , W. H. (1996): Visual perception of markings . In Psychonomic Bulletin & Review , 3 (2) pp. 171-187
Mccloud , Scott (1994): Understanding Comics: The Invisible Art. Harper Paperbacks
Norman , Donald A. (1988): The Design of Everyday Things. New York, Doubleday
Petre , Marian (1995): Why Looking Isn't Always Seeing: Readership Skills and Graphical Programming . In Communications of the ACM , 38 (6) pp. 33-44
Pérez-Gómez , Alberto and Pelletier , Louise (1997): Architectural Representation and the Perspective Hinge. MIT Press
Richards , Clive (1984). Diagrammatics: an investigation aimed at providing a theoretical framework for studying diagrams and for establishing a taxonomy of their fundamental modes of graphic organization. Unpublished Phd Thesis . Royal College of Art, London, UK
Sellen , Abigail and Harper , Richard H. R. (2001): The Myth of the Paperless Office. MIT Press
Shneiderman , Ben and Plaisant , Catherine (2009): Designing the User Interface : Strategies for Effective Human-Computer Interaction (5th ed.). Addison-Wesley
Spence , Robert (2001): Information Visualization. Addison Wesley
Sutherland , Ivan E. (1963). Sketchpad, A Man-Machine Graphical Communication System. PhD Thesis at Massachusetts Institute of Technology, online version and editors' introduction by Alan Blackwell & K. Rodden. Technical Report 574 . Cambridge University Computer Laboratory
Tufte , Edward R. (1983): The Visual Display of Quantitative Information. Cheshire, CT , Graphics Press
Ware , Colin (2004): Information Visualization: Perception for Design, 2nd Ed. San Francisco, Morgan Kaufman
- 5 Visual Representation
Human-Computer Interaction: The Foundations of UX Design

Get Weekly Design Insights
5.10 commentary by ben shneiderman.
Since computer displays are such powerful visual appliances, careful designers devote extensive effort to getting the visual representation right. They have to balance the demands of many tasks, diverse users, and challenging requirements, such as short learning time, rapid performance, low error rates, and good retention over time. Designing esthetic interfaces that please and even delight users is a further expectation that designers must meet to be successful. For playful and discretionary tasks esthetic concerns may dominate, but for life critical tasks, rapid performance with low error rates are essential. Alan Blackwell's competent description of many visual representation issues is a great start for newcomers with helpful reminders even for experienced designers. The videos make for a pleasant personal accompaniment that bridges visual representation for interface design with thoughtful analyses of representational art. Blackwell's approach might be enriched by more discussion of visual representations in functional product design tied to meaningful tasks. Learning from paintings of Paris is fine, but aren't there other lessons to learn from visual representations in airport kiosks, automobile dashboards, or intensive care units? These devices as well as most graphical user interfaces and mobile devices raise additional questions of changing state visualization and interaction dynamics. Modern designers need to do more than show the right phone icon, they need to show ringing, busy, inactive, no network, conference mode, etc., which may include color changes (highlighted, grayed out), animations, and accompanying sounds. These designers also need to deal with interactive visual representations that happen with a click, double-click, right-click, drag, drag-and-drop, hover, multi-select, region-select, brushing-linking, and more. The world of mobile devices such as phones, cameras, music players, or medical sensors is the new frontier for design, where visual representations are dynamic and tightly integrated with sound, haptics, and novel actions such as shaking, twisting, or body movements. Even more challenging is the expectation that goes beyond the solitary viewer to the collaboration in which multiple users embedded in a changing physical environment produce new visual representations. These changing and interactive demands on designers invite creative expressions that are very different from designs for static signs, printed diagrams, or interpretive art. The adventure for visual representation designers is to create a new language of interaction that engages users, accelerates learning, provides comprehensible feedback, and offers appropriate warnings when dangers emerge. Blackwell touches on some of these issues in the closing Gapminder example, but I was thirsty for more.
5.11 Commentary by Clive Richards
If I may be permitted a graphically inspired metaphor Alan Blackwell provides us with a neat pen sketch of that extensive scene called 'visual representation' (Blackwell 2011).
"Visualisation has a lot more to offer than most people are aware of today" we are told by Robert Kosara at the end of his commentary (Kosara 2010) on Stephen Few's related article on ' Data visualisation for human perception ' (Few 2010). Korsara is right, and Blackwell maps out the broad territory in which many of these visualisation offerings may be located. In this commentary I offer a few observations on some prominent features in that landscape: dynamics, picturing, semiotics and metaphor.
Ben Shneiderman's critique of Blackwell's piece points to a lack of attention to "... additional questions of changing state visualisations and interaction dynamics" (Shneiderman 2010). Indeed the possibilities offered by these additional questions present some exciting challenges for interaction designers - opportunities to create novel and effective combinations of visual with other sensory and motor experiences in dynamic operational contexts. Shneiderman suggests that: "These changing and interactive demands on designers invite creative expressions that are very different from design for static signs, printed diagrams, or interpretive art". This may be so up to a point, but here Shneinderman and I part company a little. The focus of Blackwell's essay is properly on the visual representation side of facilities available to interaction designers, and in that context he is quite right to give prominence to highly successful but static visual representation precedents, and also to point out the various specialist fields of endeavour in which they have been developed. Some of these representational approaches have histories reaching back thousands of years and are deeply embedded within our culture. It would be foolhardy to disregard conventions established in, say, the print domain, and to try to re-invent everything afresh for the screen, even if this were a practical proposition. Others have made arguments to support looking to historical precedents. For example Michael Twyman has pointed out that when considering typographic cueing and "... the problems of the electronic age ... we have much to learn from the manuscript age" (Twyman 1987, p5). He proposes that studying the early scribes' use of colour, spacing and other graphical devices can usefully inform the design of today's screen-based texts. And as Blackwell points out in his opening section on 'Typography and text' "most information on computer screen is still presented as text".
It is also sometimes assumed that the pictorial representation of a dynamic process is best presented dynamically. However it can be argued that the comic book convention of using a sequence of static frames is sometimes superior for focusing the viewer's attention on the critical events in a process, rather than using an animated sequence in which key moments may be missed. This is of course not to deny the immense value of the moving and interactive visual image in the right context. The Gapminder charts are a case in point (http://www.gapminder.org). Blackwell usefully includes one of these, but as a static presentation. These diagrams come to life and really tell their story through the clustering of balloons that inflate or deflate as they move about the screen when driven through simulated periods of time.
While designing a tool for engineers to learn about the operation and maintenance of an oil system for an aircraft jet engine, Detlev Fischer devised a series of interactive animations, called 'Cinegrams' to display in diagrammatic form various operating procedures (Fischer and Richards 1995). He used the cinematic techniques of time compression and expansion in one animated sequence to show how the slow accumulation of debris in an oil filter, over an extended period of time, would eventually create a blockage to the oil flow and trigger the opening of a by-pass device in split seconds. Notwithstanding my earlier comment about the potential superiority of the comic strip genre for displaying some time dependant processes this particular Cinegram proved very instructive for the targeted users. There are many other examples one could cite where dynamic picturing of this sort has been deployed to similarly good effect in interactive environments.
Shneinderman also comments that: "Blackwell's approach might be enriched by more discussion of visual representation in functional product design tied to meaningful tasks". An area I have worked in is the pictorial representation of engineering assemblies to show that which is normally hidden from view. Techniques to do this on the printed page include 'ghosting' (making occluding parts appear as if transparent), 'exploding' (showing components separately, set out in dis-assembly order along an axis) and cutting away (taking a slice out of an outer shell to reveal mechanisms beneath). All these three-dimensional picturing techniques were used by, if not actually invented by, Leonardo Da Vinci (Richards 2006). All could be enhanced by interactive viewer control - an area of further fruitful exploration for picturing purposes in technical documentation contexts.
Blackwell's section on 'Pictures' warns us that when considering picturing options to avoid the "resemblance fallacy" pointing out the role that convention plays, even in so called photo-realistic images. He also points out that viewers can be distracted from the message by incidental information in 'realistic' pictures. From my own work in the field I know that technical illustrators' synoptic black and white outline depictions are regarded as best for drawing the viewer's attention to the key features of a pictorial representation. Research in this area has shown that when using linear perspective type drawings the appropriate deployment of lines of varying 'weight', rather than of a single thickness, can have a significant effect on viewers' levels of understanding about what is depicted (Richards, Bussard and Newman 2007). This work was done specifically to determine an 'easy to read' visual representational style when manipulating on the screen images of CAD objects. The most effective convention was shown to be: thin lines for edges where both planes forming the edge are visible and thicker lines for edges where only one plane is visible - that is where an outline edge forms a kind of horizon to the object.
These line thickness conventions appear on the face of it to have little to do with how we normally perceive the world, and Blackwell tells us that: "A good pictorial representation need not simulate visual experience any more than a good painting of a unicorn need resemble an actual unicorn". And some particular representations of unicorns can aid our understanding of how to use semiotic theory to figure out how pictures may be interpreted and, importantly, sometimes misunderstood - as I shall describe in the following.
Blackwell mentions semiotics, almost in passing, however it can help unravel some of the complexities of visual representation. Evelyn Goldsmith uses a Charles Addams cartoon to explain the relevance of the 'syntactic', 'semantic' and 'pragmatic' levels of semiotic analysis when applied to pictures (Goldsmith 1978). The cartoon in question, like many of those by Charles Addams, has no caption. It shows two unicorns standing on a small island in the pouring rain forlornly watching the Ark sailing away into the distance. Goldsmith suggests that most viewers will have little trouble in interpreting the overlapping elements in the scene, for example that one unicorn is standing behind the other, nor any difficulty understanding that the texture gradient of the sea stands for a receding horizontal plane. These represent the syntactic level of interpretation. Most adults will correctly identify the various components of the picture at the semantic level, however Goldsmith proposes that a young child might mistake the unicorns for horses and be happy with 'boat' for the Ark. But at the pragmatic level of interpretation, unless a viewer of the picture is aware of the story of Noah's Ark, the joke will be lost - the connection will not be made between the scene depicted in the drawing and the scarcity of unicorns. This reinforces the point that one should not assume that the understanding of pictures is straightforward. There is much more to it than a simple matter or recognition. This is especially the case when metaphor is involved in visual representation.
Blackwell's section on 'Visual metaphor' is essentially a critique of the use of "theories of visual metaphor" as an "approach to explaining the conventional Mackintosh/Windows 'desktop' ". His is a convincing argument but there is much more which may be said about the use of visual metaphor - especially to show that which otherwise cannot be pictured. In fact most diagrams employ a kind of spatial metaphor when not depicting physical arrangements, for example when using the branches of a tree to represent relations within a family (Richards 2002). The capability to represent the invisible is the great strength of the visual metaphor, but there are dangers, and here I refer back to semiotics and particularly the pragmatic level of analysis. One needs to know the story to get the picture.
In our parental home, one of the many books much loved by my two brothers and me, was The Practical Encyclopaedia for Children (Odhams circa 1948). In it a double page spread illustration shows the possible evolutionary phases of the elephant. These are depicted as a procession of animals in a primordial swamp cum jungle setting. Starting with a tiny fish and passing to a small aquatic creature climbing out of the water onto the bank the procession progresses on through eight phases of transformation, including the Moeritherium and the Paleomatodon, finishing up with the land-based giant of today's African Elephant. Recently one of my brothers confessed to me that through studying this graphical diorama he had believed as a child that the elephant had a life cycle akin to that of a frog. He had understood that the procession was a metaphor for time. He had just got the duration wrong - by several orders of magnitude. He also hadn't understood that each separate depiction was of a different animal. He had used the arguably more sophisticated concept that it was the same animal at different times and stages in its individual development.
Please forgive the cliché if I say that this anecdote clearly illustrates that there can be more to looking at a picture than meets the eye? Blackwell's essay provides some useful pointers for exploring the possibilities of this fascinating territory of picturing and visual representation in general.
- Blackwell A 2011 'Visual representation' Interaction-Design.org
- Few S 2010 ' Data visualisation for human perception ' Interaction-Design.org
- Fischer D and Richards CJ 1995 'The presentation of time in interactive animated systems diagrams' In: Earnshaw RA and Vince JA (eds) Multimedia Systems and Applications London: Academic Press Ltd (pp141 - 159). ISBN 0-12-227740-6
- Goldsmith E 1978 An analysis of the elements affecting comprehensibility of illustrations intended as supportive of text PhD thesis (CNAA) Brighton Polytechnic
- Korsa R 2010 ' Commentary on Stephen Few's article : Data visualisation for human perception' Interaction-Design.org Odhams c. 1949 The practical encyclopaedia for children (pp 194 - 195)
- Richards CJ 2002 'The fundamental design variables of diagramming' In: Oliver P, Anderson M and Meyer B (eds) Diagrammatic representation and reasoning London: Springer Verlag (pp 85 - 102) ISBN 1-85233-242-5
- Richards CJ 2006 'Drawing out information - lines of communication in technical illustration' Information Design Journal 14 (2) 93 - 107
- Richards CJ, Bussard N, Newman R 2007 'Weighing up line weights: the value of differing line thicknesses in technical illustrations' Information Design Journal 15 (2) 171 - 181
- Shneiderman B 2011 'Commentary on Alan Blackwell's article: Visual representation' Interaction-Design.org
- Twyman M 1982 'The graphic representation of language' Information Design Journal 3 (1) 2 - 22
5.12 Commentary by Peter C-H. Cheng
Alan Blackwell has provided us with a fine introduction to the design of visual representations. The article does a great job in motivating the novice designer of visual representations to explore some of the fundamental issues that lurk just beneath the surface of creating effective representations. Furthermore, he gives us all quite a challenge:
Alan, quite rightly, claims that we must consider the fundamental principles of symbolic correspondence, if we are to design new genres of visual representations beyond the common forms of displays and interfaces. The report begins to equip the novice visual representation designer with an understanding of the nature of symbolic correspondence between the components of visual representations and the things they represent, whether objects, actions or ideas. In particular, it gives a useful survey of how correspondence works in a range of representations and provides a systematic framework of how systems of correspondence can be applied to design. The interactive screen shot is an exemplary visual representation that vividly reveals the correspondence techniques used in each part of the example diagram.
However, suppose you really wished to rise to the challenge of creating novel visual representations, how far will a knowledge of the fundamentals of symbolic correspondence take you? Drawing on my studies of the role of diagrams in the history of science, experience of inventing novel visual representations and research on problem solving and learning with diagrams, from the perspective of Cognitive Science, my view is that such knowledge will be necessary but not sufficient for your endeavours. So, what else should the budding visual representation designer consider? From the perspective of cognitive science there are at least three aspects that we may profitably target.
First, there is the knowledge of how human process information; specifically the nature of the human cognitive architecture. By this, I mean more than visual perception, but an understanding of how we mentally receive, store, retrieve, transform and transmit information. The way the mind deals with each of these basic types of information processing provides relevant constrains for the design of visual representations. For instance, humans often, perhaps even typically, encode concepts in the form of hierarchies of schemas, which are information structures that coordinate attributes that describe and differentiate classes of concepts. These hierarchies of schemas underpin our ability to efficiently generalize or specialize concepts. Hence, we can use this knowledge to consider whether particular forms of symbolic correspondence will assist or hinder the forms of inference that we hope the user of the representation may make. For example, are the main symbolic correspondences in a visual representation consistent with the key attributes of the schemas for the concepts being considered?
Second, it may be useful for the designer to consider the broader nature of the tasks that the user may wish to do with the designed representation. Resource allocation, optimization, calculating quantities, inferences about of possible outcomes, classification, reasoning about extreme or special cases, and debugging: these are just a few of the many possibilities. These tasks are more generic than the information-oriented options considered in the 'design uses' column of Figure 27 in the article. They are worth addressing, because they provide constraints for the initial stages of representation design, by narrowing the search for what are likely to be effective correspondences to adopt. For example, if taxonomic classification is important, then separation and layering will be important correspondences; whereas magnitude calculations may demand scale mapping, Euclidian and metrical correspondences.
The third aspect concerns situations in which the visual representation must support not just a single task, but many diverse tasks. For example, a visual representation to help students learn about electricity will be used to explain the topology of circuits, make computations with electrical quantities, provide explanations of circuit behaviour (in terms of formal algebraic models and as qualitative causal models), facilitate fault finding or trouble shooting, among other activities. The creation of novel representations in such circumstances is perhaps one of the most challenging for designers. So, what knowledge can help? In this case, I advocate attempting to design representations on the basis of an analysis of the underlying conceptual structure of the knowledge of the target domain. Why? Because the nature of the knowledge is invariant across different classes of task. For example, for problem solving and learning of electricity, all the tasks depend upon the common fundamental conceptual structures of the domain that knit together the laws governing the physical properties of electricity and circuit topology. Hence, a representation that makes these concepts readily available through effective representation designed will probably be effective for a wide range of tasks.
In summary, it is desirable for the aspiring visual representation designer to consider symbolic correspondence, but I recommend they cast their net more widely for inspiration by learning about the human cognitive architecture, focusing on the nature of the task for which they are designing, and most critically thinking about the underlying conceptual structure of the knowledge of the target domain.
5.13 Commentary by Brad A. Myers
I have been teaching human-computer interaction to students with a wide range of backgrounds for many years. One of the most difficult areas for them to learn seems to be visual design. Students seem to quickly pick up rules like Nielsen's Heuristics for interaction (Nielsen & Molich, 1990), whereas the guidelines for visual design are much more subtle. Alan Blackwell's article presents many useful points, but a designer needs to know so much more! Whereas students can achieve competence at achieving Nielsen's "consistency and standards," for example, they struggle with selecting an appropriate representation for their information. And only a trained graphic designer is likely to be able to create an attractive and effective icon. Some people have a much better aesthetic sense, and can create much more beautiful and appropriate representations. A key goal of my introductory course, therefore, is to try to impart to the students how difficult it is to do visual design, and how wide the set of choices is. Studying the examples that Blackwell provides will give the reader a small start towards effective visual representations, but the path requires talent, study, and then iterative design and testing to evaluate and improve a design's success.
- Nielsen, J., & Molich, R. (1990). Heuristic evaluation of user interfaces. Paper presented at the Proc. ACM CHI'90 Conf, Seattle, WA, 249-256.
- See also: http://www.useit.com/papers/heuristic/heuristic_list.html
Topics in This Book Chapter
Open access—link to us.
We believe in Open Access and the democratization of knowledge . Unfortunately, world-class educational materials such as this page are normally hidden behind paywalls or in expensive textbooks.
If you want this to change , cite this book chapter , link to us, or join us to help us democratize design knowledge !
Privacy Settings
Our digital services use necessary tracking technologies, including third-party cookies, for security, functionality, and to uphold user rights. Optional cookies offer enhanced features, and analytics.
Experience the full potential of our site that remembers your preferences and supports secure sign-in.
Governs the storage of data necessary for maintaining website security, user authentication, and fraud prevention mechanisms.
Enhanced Functionality
Saves your settings and preferences, like your location, for a more personalized experience.
Referral Program
We use cookies to enable our referral program, giving you and your friends discounts.
Error Reporting
We share user ID with Bugsnag and NewRelic to help us track errors and fix issues.
Optimize your experience by allowing us to monitor site usage. You’ll enjoy a smoother, more personalized journey without compromising your privacy.
Analytics Storage
Collects anonymous data on how you navigate and interact, helping us make informed improvements.
Differentiates real visitors from automated bots, ensuring accurate usage data and improving your website experience.
Lets us tailor your digital ads to match your interests, making them more relevant and useful to you.
Advertising Storage
Stores information for better-targeted advertising, enhancing your online ad experience.
Personalization Storage
Permits storing data to personalize content and ads across Google services based on user behavior, enhancing overall user experience.
Advertising Personalization
Allows for content and ad personalization across Google services based on user behavior. This consent enhances user experiences.
Enables personalizing ads based on user data and interactions, allowing for more relevant advertising experiences across Google services.
Receive more relevant advertisements by sharing your interests and behavior with our trusted advertising partners.
Enables better ad targeting and measurement on Meta platforms, making ads you see more relevant.
Allows for improved ad effectiveness and measurement through Meta’s Conversions API, ensuring privacy-compliant data sharing.
LinkedIn Insights
Tracks conversions, retargeting, and web analytics for LinkedIn ad campaigns, enhancing ad relevance and performance.
LinkedIn CAPI
Enhances LinkedIn advertising through server-side event tracking, offering more accurate measurement and personalization.
Google Ads Tag
Tracks ad performance and user engagement, helping deliver ads that are most useful to you.
Share Knowledge, Get Respect!
or copy link
Cite according to academic standards
Simply copy and paste the text below into your bibliographic reference list, onto your blog, or anywhere else. You can also just hyperlink to this book chapter.
New to UX Design? We’re giving you a free ebook!

Download our free ebook The Basics of User Experience Design to learn about core concepts of UX design.
In 9 chapters, we’ll cover: conducting user interviews, design thinking, interaction design, mobile UX design, usability, UX research, and many more!
Download Premium UX Design Literature
Enjoy unlimited downloads of our literature. Our online textbooks are written by 100+ leading designers, bestselling authors and Ivy League professors.

New to UX Design? We’re Giving You a Free ebook!
We use essential cookies to make Venngage work. By clicking “Accept All Cookies”, you agree to the storing of cookies on your device to enhance site navigation, analyze site usage, and assist in our marketing efforts.
Manage Cookies
Cookies and similar technologies collect certain information about how you’re using our website. Some of them are essential, and without them you wouldn’t be able to use Venngage. But others are optional, and you get to choose whether we use them or not.
Strictly Necessary Cookies
These cookies are always on, as they’re essential for making Venngage work, and making it safe. Without these cookies, services you’ve asked for can’t be provided.
Show cookie providers
- Google Login
Functionality Cookies
These cookies help us provide enhanced functionality and personalisation, and remember your settings. They may be set by us or by third party providers.
Performance Cookies
These cookies help us analyze how many people are using Venngage, where they come from and how they're using it. If you opt out of these cookies, we can’t get feedback to make Venngage better for you and all our users.
- Google Analytics
Targeting Cookies
These cookies are set by our advertising partners to track your activity and show you relevant Venngage ads on other sites as you browse the internet.
- Google Tag Manager
- Infographics
- Daily Infographics
- Popular Templates
- Accessibility
- Graphic Design
- Graphs and Charts
- Data Visualization
- Human Resources
- Beginner Guides
Blog Graphic Design 15 Effective Visual Presentation Tips To Wow Your Audience
15 Effective Visual Presentation Tips To Wow Your Audience
Written by: Krystle Wong Sep 28, 2023

So, you’re gearing up for that big presentation and you want it to be more than just another snooze-fest with slides. You want it to be engaging, memorable and downright impressive.
Well, you’ve come to the right place — I’ve got some slick tips on how to create a visual presentation that’ll take your presentation game up a notch.
Packed with presentation templates that are easily customizable, keep reading this blog post to learn the secret sauce behind crafting presentations that captivate, inform and remain etched in the memory of your audience.
Click to jump ahead:
What is a visual presentation & why is it important?
15 effective tips to make your visual presentations more engaging, 6 major types of visual presentation you should know , what are some common mistakes to avoid in visual presentations, visual presentation faqs, 5 steps to create a visual presentation with venngage.
A visual presentation is a communication method that utilizes visual elements such as images, graphics, charts, slides and other visual aids to convey information, ideas or messages to an audience.
Visual presentations aim to enhance comprehension engagement and the overall impact of the message through the strategic use of visuals. People remember what they see, making your point last longer in their heads.
Without further ado, let’s jump right into some great visual presentation examples that would do a great job in keeping your audience interested and getting your point across.
In today’s fast-paced world, where information is constantly bombarding our senses, creating engaging visual presentations has never been more crucial. To help you design a presentation that’ll leave a lasting impression, I’ve compiled these examples of visual presentations that will elevate your game.
1. Use the rule of thirds for layout
Ever heard of the rule of thirds? It’s a presentation layout trick that can instantly up your slide game. Imagine dividing your slide into a 3×3 grid and then placing your text and visuals at the intersection points or along the lines. This simple tweak creates a balanced and seriously pleasing layout that’ll draw everyone’s eyes.
2. Get creative with visual metaphors
Got a complex idea to explain? Skip the jargon and use visual metaphors. Throw in images that symbolize your point – for example, using a road map to show your journey towards a goal or using metaphors to represent answer choices or progress indicators in an interactive quiz or poll.
3. Visualize your data with charts and graphs
The right data visualization tools not only make content more appealing but also aid comprehension and retention. Choosing the right visual presentation for your data is all about finding a good match.
For ordinal data, where things have a clear order, consider using ordered bar charts or dot plots. When it comes to nominal data, where categories are on an equal footing, stick with the classics like bar charts, pie charts or simple frequency tables. And for interval-ratio data, where there’s a meaningful order, go for histograms, line graphs, scatterplots or box plots to help your data shine.
In an increasingly visual world, effective visual communication is a valuable skill for conveying messages. Here’s a guide on how to use visual communication to engage your audience while avoiding information overload.

4. Employ the power of contrast
Want your important stuff to pop? That’s where contrast comes in. Mix things up with contrasting colors, fonts or shapes. It’s like highlighting your key points with a neon marker – an instant attention grabber.
5. Tell a visual story
Structure your slides like a storybook and create a visual narrative by arranging your slides in a way that tells a story. Each slide should flow into the next, creating a visual narrative that keeps your audience hooked till the very end.
Icons and images are essential for adding visual appeal and clarity to your presentation. Venngage provides a vast library of icons and images, allowing you to choose visuals that resonate with your audience and complement your message.

6. Show the “before and after” magic
Want to drive home the impact of your message or solution? Whip out the “before and after” technique. Show the current state (before) and the desired state (after) in a visual way. It’s like showing a makeover transformation, but for your ideas.
7. Add fun with visual quizzes and polls
To break the monotony and see if your audience is still with you, throw in some quick quizzes or polls. It’s like a mini-game break in your presentation — your audience gets involved and it makes your presentation way more dynamic and memorable.
8. End with a powerful visual punch
Your presentation closing should be a showstopper. Think a stunning clip art that wraps up your message with a visual bow, a killer quote that lingers in minds or a call to action that gets hearts racing.

9. Engage with storytelling through data
Use storytelling magic to bring your data to life. Don’t just throw numbers at your audience—explain what they mean, why they matter and add a bit of human touch. Turn those stats into relatable tales and watch your audience’s eyes light up with understanding.

10. Use visuals wisely
Your visuals are the secret sauce of a great presentation. Cherry-pick high-quality images, graphics, charts and videos that not only look good but also align with your message’s vibe. Each visual should have a purpose – they’re not just there for decoration.
11. Utilize visual hierarchy
Employ design principles like contrast, alignment and proximity to make your key info stand out. Play around with fonts, colors and placement to make sure your audience can’t miss the important stuff.
12. Engage with multimedia
Static slides are so last year. Give your presentation some sizzle by tossing in multimedia elements. Think short video clips, animations, or a touch of sound when it makes sense, including an animated logo . But remember, these are sidekicks, not the main act, so use them smartly.
13. Interact with your audience
Turn your presentation into a two-way street. Start your presentation by encouraging your audience to join in with thought-provoking questions, quick polls or using interactive tools. Get them chatting and watch your presentation come alive.

When it comes to delivering a group presentation, it’s important to have everyone on the team on the same page. Venngage’s real-time collaboration tools enable you and your team to work together seamlessly, regardless of geographical locations. Collaborators can provide input, make edits and offer suggestions in real time.
14. Incorporate stories and examples
Weave in relatable stories, personal anecdotes or real-life examples to illustrate your points. It’s like adding a dash of spice to your content – it becomes more memorable and relatable.
15. Nail that delivery
Don’t just stand there and recite facts like a robot — be a confident and engaging presenter. Lock eyes with your audience, mix up your tone and pace and use some gestures to drive your points home. Practice and brush up your presentation skills until you’ve got it down pat for a persuasive presentation that flows like a pro.
Venngage offers a wide selection of professionally designed presentation templates, each tailored for different purposes and styles. By choosing a template that aligns with your content and goals, you can create a visually cohesive and polished presentation that captivates your audience.
Looking for more presentation ideas ? Why not try using a presentation software that will take your presentations to the next level with a combination of user-friendly interfaces, stunning visuals, collaboration features and innovative functionalities that will take your presentations to the next level.
Visual presentations come in various formats, each uniquely suited to convey information and engage audiences effectively. Here are six major types of visual presentations that you should be familiar with:
1. Slideshows or PowerPoint presentations
Slideshows are one of the most common forms of visual presentations. They typically consist of a series of slides containing text, images, charts, graphs and other visual elements. Slideshows are used for various purposes, including business presentations, educational lectures and conference talks.

2. Infographics
Infographics are visual representations of information, data or knowledge. They combine text, images and graphics to convey complex concepts or data in a concise and visually appealing manner. Infographics are often used in marketing, reporting and educational materials.
Don’t worry, they are also super easy to create thanks to Venngage’s fully customizable infographics templates that are professionally designed to bring your information to life. Be sure to try it out for your next visual presentation!

3. Video presentation
Videos are your dynamic storytellers. Whether it’s pre-recorded or happening in real-time, videos are the showstoppers. You can have interviews, demos, animations or even your own mini-documentary. Video presentations are highly engaging and can be shared in both in-person and virtual presentations .
4. Charts and graphs
Charts and graphs are visual representations of data that make it easier to understand and analyze numerical information. Common types include bar charts, line graphs, pie charts and scatterplots. They are commonly used in scientific research, business reports and academic presentations.
Effective data visualizations are crucial for simplifying complex information and Venngage has got you covered. Venngage’s tools enable you to create engaging charts, graphs,and infographics that enhance audience understanding and retention, leaving a lasting impression in your presentation.

5. Interactive presentations
Interactive presentations involve audience participation and engagement. These can include interactive polls, quizzes, games and multimedia elements that allow the audience to actively participate in the presentation. Interactive presentations are often used in workshops, training sessions and webinars.
Venngage’s interactive presentation tools enable you to create immersive experiences that leave a lasting impact and enhance audience retention. By incorporating features like clickable elements, quizzes and embedded multimedia, you can captivate your audience’s attention and encourage active participation.
6. Poster presentations
Poster presentations are the stars of the academic and research scene. They consist of a large poster that includes text, images and graphics to communicate research findings or project details and are usually used at conferences and exhibitions. For more poster ideas, browse through Venngage’s gallery of poster templates to inspire your next presentation.

Different visual presentations aside, different presentation methods also serve a unique purpose, tailored to specific objectives and audiences. Find out which type of presentation works best for the message you are sending across to better capture attention, maintain interest and leave a lasting impression.
To make a good presentation , it’s crucial to be aware of common mistakes and how to avoid them. Without further ado, let’s explore some of these pitfalls along with valuable insights on how to sidestep them.
Overloading slides with text
Text heavy slides can be like trying to swallow a whole sandwich in one bite – overwhelming and unappetizing. Instead, opt for concise sentences and bullet points to keep your slides simple. Visuals can help convey your message in a more engaging way.
Using low-quality visuals
Grainy images and pixelated charts are the equivalent of a scratchy vinyl record at a DJ party. High-resolution visuals are your ticket to professionalism. Ensure that the images, charts and graphics you use are clear, relevant and sharp.
Choosing the right visuals for presentations is important. To find great visuals for your visual presentation, Browse Venngage’s extensive library of high-quality stock photos. These images can help you convey your message effectively, evoke emotions and create a visually pleasing narrative.
Ignoring design consistency
Imagine a book with every chapter in a different font and color – it’s a visual mess. Consistency in fonts, colors and formatting throughout your presentation is key to a polished and professional look.
Reading directly from slides
Reading your slides word-for-word is like inviting your audience to a one-person audiobook session. Slides should complement your speech, not replace it. Use them as visual aids, offering key points and visuals to support your narrative.
Lack of visual hierarchy
Neglecting visual hierarchy is like trying to find Waldo in a crowd of clones. Use size, color and positioning to emphasize what’s most important. Guide your audience’s attention to key points so they don’t miss the forest for the trees.
Ignoring accessibility
Accessibility isn’t an option these days; it’s a must. Forgetting alt text for images, color contrast and closed captions for videos can exclude individuals with disabilities from understanding your presentation.
Relying too heavily on animation
While animations can add pizzazz and draw attention, overdoing it can overshadow your message. Use animations sparingly and with purpose to enhance, not detract from your content.
Using jargon and complex language
Keep it simple. Use plain language and explain terms when needed. You want your message to resonate, not leave people scratching their heads.
Not testing interactive elements
Interactive elements can be the life of your whole presentation, but not testing them beforehand is like jumping into a pool without checking if there’s water. Ensure that all interactive features, from live polls to multimedia content, work seamlessly. A smooth experience keeps your audience engaged and avoids those awkward technical hiccups.
Presenting complex data and information in a clear and visually appealing way has never been easier with Venngage. Build professional-looking designs with our free visual chart slide templates for your next presentation.
What software or tools can I use to create visual presentations?
You can use various software and tools to create visual presentations, including Microsoft PowerPoint, Google Slides, Adobe Illustrator, Canva, Prezi and Venngage, among others.
What is the difference between a visual presentation and a written report?
The main difference between a visual presentation and a written report is the medium of communication. Visual presentations rely on visuals, such as slides, charts and images to convey information quickly, while written reports use text to provide detailed information in a linear format.
How do I effectively communicate data through visual presentations?
To effectively communicate data through visual presentations, simplify complex data into easily digestible charts and graphs, use clear labels and titles and ensure that your visuals support the key messages you want to convey.
Are there any accessibility considerations for visual presentations?
Accessibility considerations for visual presentations include providing alt text for images, ensuring good color contrast, using readable fonts and providing transcripts or captions for multimedia content to make the presentation inclusive.
Most design tools today make accessibility hard but Venngage’s Accessibility Design Tool comes with accessibility features baked in, including accessible-friendly and inclusive icons.
How do I choose the right visuals for my presentation?
Choose visuals that align with your content and message. Use charts for data, images for illustrating concepts, icons for emphasis and color to evoke emotions or convey themes.
What is the role of storytelling in visual presentations?
Storytelling plays a crucial role in visual presentations by providing a narrative structure that engages the audience, helps them relate to the content and makes the information more memorable.
How can I adapt my visual presentations for online or virtual audiences?
To adapt visual presentations for online or virtual audiences, focus on concise content, use engaging visuals, ensure clear audio, encourage audience interaction through chat or polls and rehearse for a smooth online delivery.
What is the role of data visualization in visual presentations?
Data visualization in visual presentations simplifies complex data by using charts, graphs and diagrams, making it easier for the audience to understand and interpret information.
How do I choose the right color scheme and fonts for my visual presentation?
Choose a color scheme that aligns with your content and brand and select fonts that are readable and appropriate for the message you want to convey.
How can I measure the effectiveness of my visual presentation?
Measure the effectiveness of your visual presentation by collecting feedback from the audience, tracking engagement metrics (e.g., click-through rates for online presentations) and evaluating whether the presentation achieved its intended objectives.
Ultimately, creating a memorable visual presentation isn’t just about throwing together pretty slides. It’s about mastering the art of making your message stick, captivating your audience and leaving a mark.
Lucky for you, Venngage simplifies the process of creating great presentations, empowering you to concentrate on delivering a compelling message. Follow the 5 simple steps below to make your entire presentation visually appealing and impactful:
1. Sign up and log In: Log in to your Venngage account or sign up for free and gain access to Venngage’s templates and design tools.
2. Choose a template: Browse through Venngage’s presentation template library and select one that best suits your presentation’s purpose and style. Venngage offers a variety of pre-designed templates for different types of visual presentations, including infographics, reports, posters and more.
3. Edit and customize your template: Replace the placeholder text, image and graphics with your own content and customize the colors, fonts and visual elements to align with your presentation’s theme or your organization’s branding.
4. Add visual elements: Venngage offers a wide range of visual elements, such as icons, illustrations, charts, graphs and images, that you can easily add to your presentation with the user-friendly drag-and-drop editor.
5. Save and export your presentation: Export your presentation in a format that suits your needs and then share it with your audience via email, social media or by embedding it on your website or blog .
So, as you gear up for your next presentation, whether it’s for business, education or pure creative expression, don’t forget to keep these visual presentation ideas in your back pocket.
Feel free to experiment and fine-tune your approach and let your passion and expertise shine through in your presentation. With practice, you’ll not only build presentations but also leave a lasting impact on your audience – one slide at a time.
Discover popular designs

Infographic maker

Brochure maker

White paper online

Newsletter creator

Flyer maker

Timeline maker

Letterhead maker

Mind map maker

Ebook maker
Initial Thoughts
Perspectives & resources, what is high-quality mathematics instruction and why is it important.
- Page 1: The Importance of High-Quality Mathematics Instruction
- Page 2: A Standards-Based Mathematics Curriculum
- Page 3: Evidence-Based Mathematics Practices
What evidence-based mathematics practices can teachers employ?
- Page 4: Explicit, Systematic Instruction
Page 5: Visual Representations
- Page 6: Schema Instruction
- Page 7: Metacognitive Strategies
- Page 8: Effective Classroom Practices
- Page 9: References & Additional Resources
- Page 10: Credits

Research Shows
- Students who use accurate visual representations are six times more likely to correctly solve mathematics problems than are students who do not use them. However, students who use inaccurate visual representations are less likely to correctly solve mathematics problems than those who do not use visual representations at all. (Boonen, van Wesel, Jolles, & van der Schoot, 2014)
- Students with a learning disability (LD) often do not create accurate visual representations or use them strategically to solve problems. Teaching students to systematically use a visual representation to solve word problems has led to substantial improvements in math achievement for students with learning disabilities. (van Garderen, Scheuermann, & Jackson, 2012; van Garderen, Scheuermann, & Poch, 2014)
- Students who use visual representations to solve word problems are more likely to solve the problems accurately. This was equally true for students who had LD, were low-achieving, or were average-achieving. (Krawec, 2014)
Visual representations are flexible; they can be used across grade levels and types of math problems. They can be used by teachers to teach mathematics facts and by students to learn mathematics content. Visual representations can take a number of forms. Click on the links below to view some of the visual representations most commonly used by teachers and students.
How does this practice align?
High-leverage practice (hlp).
- HLP15 : Provide scaffolded supports
CCSSM: Standards for Mathematical Practice
- MP1 : Make sense of problems and persevere in solving them.
Number Lines
Definition : A straight line that shows the order of and the relation between numbers.
Common Uses : addition, subtraction, counting

Strip Diagrams
Definition : A bar divided into rectangles that accurately represent quantities noted in the problem.
Common Uses : addition, fractions, proportions, ratios

Definition : Simple drawings of concrete or real items (e.g., marbles, trucks).
Common Uses : counting, addition, subtraction, multiplication, division

Graphs/Charts
Definition : Drawings that depict information using lines, shapes, and colors.
Common Uses : comparing numbers, statistics, ratios, algebra

Graphic Organizers
Definition : Visual that assists students in remembering and organizing information, as well as depicting the relationships between ideas (e.g., word webs, tables, Venn diagrams).
Common Uses : algebra, geometry
Before they can solve problems, however, students must first know what type of visual representation to create and use for a given mathematics problem. Some students—specifically, high-achieving students, gifted students—do this automatically, whereas others need to be explicitly taught how. This is especially the case for students who struggle with mathematics and those with mathematics learning disabilities. Without explicit, systematic instruction on how to create and use visual representations, these students often create visual representations that are disorganized or contain incorrect or partial information. Consider the examples below.
Elementary Example
Mrs. Aldridge ask her first-grade students to add 2 + 4 by drawing dots.
Notice that Talia gets the correct answer. However, because Colby draws his dots in haphazard fashion, he fails to count all of them and consequently arrives at the wrong solution.
High School Example
Mr. Huang asks his students to solve the following word problem:
The flagpole needs to be replaced. The school would like to replace it with the same size pole. When Juan stands 11 feet from the base of the pole, the angle of elevation from Juan’s feet to the top of the pole is 70 degrees. How tall is the pole?
Compare the drawings below created by Brody and Zoe to represent this problem. Notice that Brody drew an accurate representation and applied the correct strategy. In contrast, Zoe drew a picture with partially correct information. The 11 is in the correct place, but the 70° is not. As a result of her inaccurate representation, Zoe is unable to move forward and solve the problem. However, given an accurate representation developed by someone else, Zoe is more likely to solve the problem correctly.

Manipulatives
Some students will not be able to grasp mathematics skills and concepts using only the types of visual representations noted in the table above. Very young children and students who struggle with mathematics often require different types of visual representations known as manipulatives. These concrete, hands-on materials and objects—for example, an abacus or coins—help students to represent the mathematical idea they are trying to learn or the problem they are attempting to solve. Manipulatives can help students develop a conceptual understanding of mathematical topics. (For the purpose of this module, the term concrete objects refers to manipulatives and the term visual representations refers to schematic diagrams.)
It is important that the teacher make explicit the connection between the concrete object and the abstract concept being taught. The goal is for the student to eventually understand the concepts and procedures without the use of manipulatives. For secondary students who struggle with mathematics, teachers should show the abstract along with the concrete or visual representation and explicitly make the connection between them.
A move from concrete objects or visual representations to using abstract equations can be difficult for some students. One strategy teachers can use to help students systematically transition among concrete objects, visual representations, and abstract equations is the Concrete-Representational-Abstract (CRA) framework.
If you would like to learn more about this framework, click here.
Concrete-Representational-Abstract Framework

- Concrete —Students interact and manipulate three-dimensional objects, for example algebra tiles or other algebra manipulatives with representations of variables and units.
- Representational — Students use two-dimensional drawings to represent problems. These pictures may be presented to them by the teacher, or through the curriculum used in the class, or students may draw their own representation of the problem.
- Abstract — Students solve problems with numbers, symbols, and words without any concrete or representational assistance.
CRA is effective across all age levels and can assist students in learning concepts, procedures, and applications. When implementing each component, teachers should use explicit, systematic instruction and continually monitor student work to assess their understanding, asking them questions about their thinking and providing clarification as needed. Concrete and representational activities must reflect the actual process of solving the problem so that students are able to generalize the process to solve an abstract equation. The illustration below highlights each of these components.

For Your Information
One promising practice for moving secondary students with mathematics difficulties or disabilities from the use of manipulatives and visual representations to the abstract equation quickly is the CRA-I strategy . In this modified version of CRA, the teacher simultaneously presents the content using concrete objects, visual representations of the concrete objects, and the abstract equation. Studies have shown that this framework is effective for teaching algebra to this population of students (Strickland & Maccini, 2012; Strickland & Maccini, 2013; Strickland, 2017).
Kim Paulsen discusses the benefits of manipulatives and a number of things to keep in mind when using them (time: 2:35).
Kim Paulsen, EdD Associate Professor, Special Education Vanderbilt University
View Transcript

Transcript: Kim Paulsen, EdD
Manipulatives are a great way of helping kids understand conceptually. The use of manipulatives really helps students see that conceptually, and it clicks a little more with them. Some of the things, though, that we need to remember when we’re using manipulatives is that it is important to give students a little bit of free time when you’re using a new manipulative so that they can just explore with them. We need to have specific rules for how to use manipulatives, that they aren’t toys, that they really are learning materials, and how students pick them up, how they put them away, the right time to use them, and making sure that they’re not distracters while we’re actually doing the presentation part of the lesson. One of the important things is that we don’t want students to memorize the algorithm or the procedures while they’re using the manipulatives. It really is just to help them understand conceptually. That doesn’t mean that kids are automatically going to understand conceptually or be able to make that bridge between using the concrete manipulatives into them being able to solve the problems. For some kids, it is difficult to use the manipulatives. That’s not how they learn, and so we don’t want to force kids to have to use manipulatives if it’s not something that is helpful for them. So we have to remember that manipulatives are one way to think about teaching math.
I think part of the reason that some teachers don’t use them is because it takes a lot of time, it takes a lot of organization, and they also feel that students get too reliant on using manipulatives. One way to think about using manipulatives is that you do it a couple of lessons when you’re teaching a new concept, and then take those away so that students are able to do just the computation part of it. It is true we can’t walk around life with manipulatives in our hands. And I think one of the other reasons that a lot of schools or teachers don’t use manipulatives is because they’re very expensive. And so it’s very helpful if all of the teachers in the school can pool resources and have a manipulative room where teachers can go check out manipulatives so that it’s not so expensive. Teachers have to know how to use them, and that takes a lot of practice.
Table of Contents
Ai, ethics & human agency, collaboration, information literacy, writing process, chapter: visual representation.
December 15, 2022
Visual Representation
Visual Representation refers to Writers engage in visual representation in order to Related Concepts: Elements of Art; Principles of Design; Visual Literacy
November 19, 2020
Illustration
Illustrations are Key Concepts: Text & Intertextuality; Design Caution: This is an article stub. Please check back in a bit. We hope to write this page soon. Still, if you have something to say, let us know.
November 16, 2020
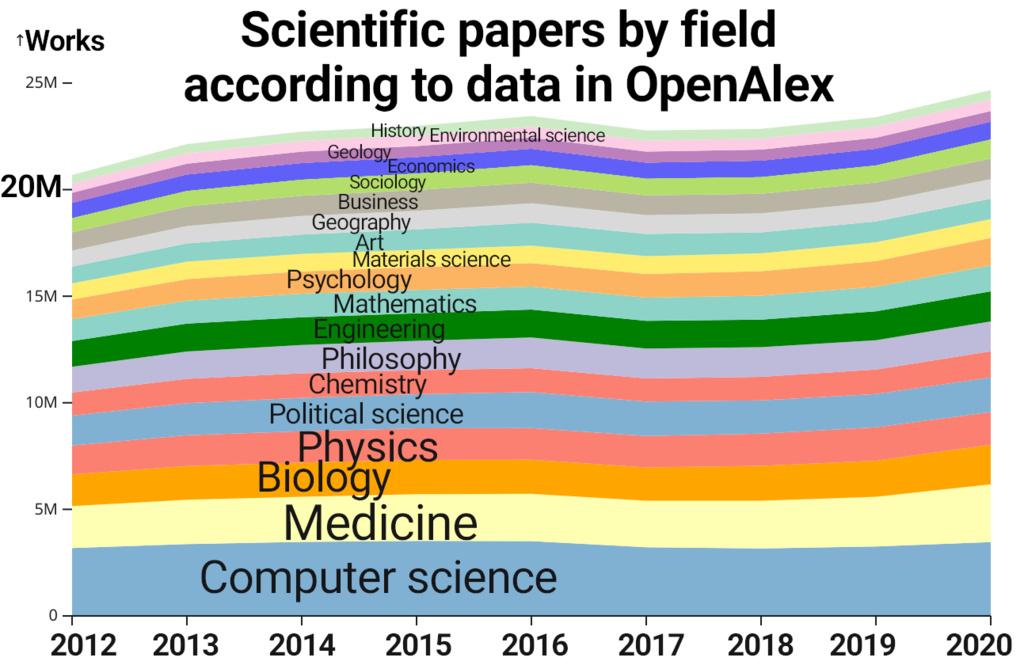
Data Visualization – Information Visualization – The Art of Visualizing Meaning For Better Decision-Making
What is Data Visualization? Data visualization refers to the practice of transforming information/data into visual representations to simplify and communicate complex information clearly and effectively. Designers strategically use colors, shapes, and symbols to bridge the gap between raw data and human understanding, empowering viewers to better interpret and analyze the information presented. Key Words: Design; ...
October 31, 2009
Hierarchical Maps
Use visual brainstorming to develop and organize your ideas. Like cluster/spider maps, hierarchical maps involve drawing a graphical representation of ideas. Unlike clustering, cluster/spider maps are chiefly concerned with analyzing relationships among ideas. When Are Hierarchical Maps Useful? Mapping is a useful organizing and revising tool when you want to see if you’ve made connections ...

Timelines & Flow Charts
Use visual brainstorming to develop and organize your ideas..
In 1765, Joseph Priestly created the now commonplace timeline. Priestly's timeline depicted the lifespan of 2000 inventors whom he considered the "most distinguished in the annals of fame."
Featured Articles

Academic Writing – How to Write for the Academic Community

Professional Writing – How to Write for the Professional World
Credibility & Authority – How to Be Credible & Authoritative in Speech & Writing
Help | Advanced Search
Computer Science > Robotics
Title: hearing touch: audio-visual pretraining for contact-rich manipulation.
Abstract: Although pre-training on a large amount of data is beneficial for robot learning, current paradigms only perform large-scale pretraining for visual representations, whereas representations for other modalities are trained from scratch. In contrast to the abundance of visual data, it is unclear what relevant internet-scale data may be used for pretraining other modalities such as tactile sensing. Such pretraining becomes increasingly crucial in the low-data regimes common in robotics applications. In this paper, we address this gap by using contact microphones as an alternative tactile sensor. Our key insight is that contact microphones capture inherently audio-based information, allowing us to leverage large-scale audio-visual pretraining to obtain representations that boost the performance of robotic manipulation. To the best of our knowledge, our method is the first approach leveraging large-scale multisensory pre-training for robotic manipulation. For supplementary information including videos of real robot experiments, please see this https URL .
Submission history
Access paper:.
- HTML (experimental)
- Other Formats
References & Citations
- Google Scholar
- Semantic Scholar
BibTeX formatted citation
Bibliographic and Citation Tools
Code, data and media associated with this article, recommenders and search tools.
- Institution
arXivLabs: experimental projects with community collaborators
arXivLabs is a framework that allows collaborators to develop and share new arXiv features directly on our website.
Both individuals and organizations that work with arXivLabs have embraced and accepted our values of openness, community, excellence, and user data privacy. arXiv is committed to these values and only works with partners that adhere to them.
Have an idea for a project that will add value for arXiv's community? Learn more about arXivLabs .
IMAGES
VIDEO
COMMENTS
Learn what visual representation is and how designers use it to communicate information, emotions and concepts. Explore the types of visual representation, such as text, illustrations, data visualization and symbolic correspondence, with examples and videos.
As a subject in computer science, scientific visualization is the use of interactive, sensory representations, typically visual, of abstract data to reinforce cognition, hypothesis building, and reasoning. Scientific visualization is the transformation, selection, or representation of data from simulations or experiments, with an implicit or explicit geometric structure, to allow the ...
Visual representation is the act of conveying information, ideas, or concepts through visual elements such as images, charts, graphs, maps, and other graphical forms. Learn how visual representation enhances understanding, facilitates data visualization, and expresses cultural and artistic narratives.
This paper explores how visual representations (i.e., photographs, diagrams, models) are used as epistemic objects in science and how they contribute to knowledge formation. It presents three case studies from the history of science and discusses the implications for science education.
The Power of Good Data Visualization. Data visualization involves the use of graphical representations of data, such as graphs, charts, and maps. Compared to descriptive statistics or tables, visuals provide a more effective way to analyze data, including identifying patterns, distributions, and correlations and spotting outliers in complex ...
Visual representations can also be simple illustrations that young children add to stories to enhance a story they are telling together (Gelmini-Hornsby et al., 2011). By externalizing one's understanding in a visual representation, not only is a peer's understanding improved, ...
Learn the concept, history, and formalism of visual representation, a special case of representation using visual signs. Explore the properties, types, and applications of visual metaphors, the mappings between data and visual elements.
Learn what information visualization is, how it helps users understand and manipulate data, and what are the common types and uses of information visualization. Explore the literature on information visualization by the Interaction Design Foundation, a leading source of UX design knowledge.
Data and information visualization ( data viz/vis or info viz/vis) [2] is the practice of designing and creating easy-to-communicate and easy-to-understand graphic or visual representations of a large amount [3] of complex quantitative and qualitative data and information with the help of static, dynamic or interactive visual items.
Learn what data visualization is, why it is important, and how to create different types of visualizations using various tools. Explore data visualization examples from various fields and discover online courses to boost your skills.
Learn what data visualization is, why it is important, and how to create and use different types of visualizations. Explore examples of data visualization in various fields and industries, and discover tools and software to help you visualize data.
Learn 17 essential data visualization techniques to communicate data effectively and make data-driven decisions. Explore different types of charts, maps, diagrams and matrices with examples and tips.
This chapter discusses universal characteristics of visual representations in HCI, such as pictograms, and proposes a taxonomy of visual representations. It also examines existing definitions and taxonomies of pictograms and related terms, such as icons and graphical symbols.
People do indeed make this error, even when the numeric data are printed saliently near the visual representation (Pandey et al., 2015). Fig. 4. A set of common visual confusions, illusions, and distortions. At upper left, the two human icons represent vastly different ratios depending on whether the data are represented by their one ...
Learn how to use web-based and desktop tools to create simple or complex visualizations of data, concepts, and stories. Find examples, tips, and resources for planning and designing your own infographics.
Learn how to create visual representations of data and ideas using different types of diagrams, such as spider diagrams, cluster diagrams, pie charts, and bar charts. Discover the benefits of visual representation for improving conceptual understanding, decision making, communication, and learning.
Despite the notable number of publications on the benefits of using visual representations in a variety of fields (Meyer, Höllerer, Jancsary, & Van Leeuwen, 2013), few studies have systematically investigated the possible pitfalls that exist when creating or interpreting visual representations.Some information visualization researchers, however, have raised the issue and called to action ...
Thinking about many possible visual representations is the first step in creating a good one for students. The Progressions published in tandem with the Common Core State Standards for mathematics are one resource for finding specific visual models based on grade level and standard. In my fifth-grade example, what I constructed was a sequenced ...
Learn how to design computer displays that are meaningful to human viewers, using principles of typography, maps, graphs and other visual elements. Explore the history and examples of visual representation in screen design, from ancient to modern times.
7. Add fun with visual quizzes and polls. To break the monotony and see if your audience is still with you, throw in some quick quizzes or polls. It's like a mini-game break in your presentation — your audience gets involved and it makes your presentation way more dynamic and memorable. 8.
Learn how to use visual representations to help students with mathematics learning disabilities and difficulties. Find out what visual representations are, how they can be used across grade levels and types of math problems, and how to teach them systematically.
What is Data Visualization? Data visualization refers to the practice of transforming information/data into visual representations to simplify and communicate complex information clearly and effectively. Designers strategically use colors, shapes, and symbols to bridge the gap between raw data and human understanding, empowering viewers to ...
A table is a visual representation of data organized in rows and columns. It is a helpful tool for comparing facts and figures and making data-driven decisions. Venn diagram. A venn diagram shows the similarities and differences between two sets of data. The overlapping area shows where the two sets have something in common.
DOI: 10.1145/3613904.3642808 Corpus ID: 269750713; Input Visualization: Collecting and Modifying Data with Visual Representations @inproceedings{Bressa2024InputVC, title={Input Visualization: Collecting and Modifying Data with Visual Representations}, author={Nathalie Bressa and Jordan Louis and Wesley Willett and Samuel Huron}, booktitle={International Conference on Human Factors in Computing ...
View PDF Abstract: Although pre-training on a large amount of data is beneficial for robot learning, current paradigms only perform large-scale pretraining for visual representations, whereas representations for other modalities are trained from scratch. In contrast to the abundance of visual data, it is unclear what relevant internet-scale data may be used for pretraining other modalities ...
2 LGBTQIA2S + stands for lesbian, gay, bisexual, trans, queer or questioning, intersex, asexual, and two-spirit. It is important to note that each of these terms can have a complex and nuanced definition, and people may use or identify with these labels in different ways.
The visual cortex plays a significant role in constructing internal models that predict incoming sensory experiences. Unexpected stimuli that violate those predictions play an important role in how neural circuits learn these internal models. The cortical inhibitory network, particularly VIP cells, is hypothesized to act as a key player in representing unexpected stimuli due to its unique ...