A Guide to Implementing the Agile Working Model

Agile is much more than just a buzzword, it’s an incredibly powerful working methodology that has been adopted by some of the most successful companies around the world. This guide provides all you need for a smooth transition into enhanced productivity through the agile working model.
A fast-paced cycle of planning, execution and evaluation enables stakeholders from all levels of the process to stay involved with every step toward success — ensuring that teams are always in sync.

What is the agile working model?
Agile project management is a collaborative, iterative project management approach that incorporates continuous testing and responsiveness to change.
It is essentially an incremental framework that allows teams to compile tasks into shorter sprints. Think of Scrum as the configuration and Sprint intervals as periods of work with set goals. The overall approach is known as “agile” – keeping everyone focused on speed without compromising quality.
Companies have found success with the Agile approach, which allows them to quickly adapt and create products that are in demand on the market. It’s no surprise then it has become so popular in the software tech industry/development.
Ultimately, agile teams enjoy increased productivity and flexible working along with goodwill rewards, giving your organization exceptional results on their bottom line.

The basics of the agile working model
The 4 core values of agile working
Agile working empowers teams with maximum flexibility. Not only does it give employees more control, but can also provide distinct benefits such as increased productivity and a happier workforce.
There’s no universal solution when introducing agile techniques into your organization, but setting clear boundaries and defining job roles ensures that everyone is clear on their responsibilities.
There are distinct parts of the agile working model. These include deciding when tasks should get done; finding new ways of completing goals; control over the work environment (office or home); and tailoring approaches for each task along the way:
- Time : when you work
- Role : what you do
- Location : where you work
- Source : the teams and tasks you work with. To get the best from employees, ensure that goals are based on context, intrinsic rewards, shared objectives and adaptability.
What does the agile working model involve?
With this method of project management, your team can pick from a range of frameworks that will best suit the team.
Unified communication
Open dialogue between employees, management and departments foster an agile response in times of rapid change. Employee attendance is important in the agile work methodology because agile workplace teams rely on communication and collaboration to quickly and effectively complete tasks. TimeTrack Attendance Tracking is flexible and intuitive in allowing managers to create a working time model of communication at any time.
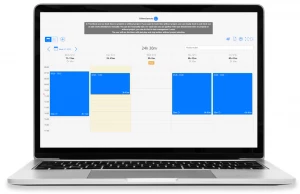
TimeTrack Attendance Tracking
Collaboration
Effective communication between employees can greatly enhance delivery results through collaboration. By managing tasks independently and together, teams are able to achieve more successful outcomes. Regular check-ins can also help managers keep an eye on lazy employees.
Introspection
Introspective opportunities are the perfect way to invigorate teams and encourage collaboration. A project team’s retrospectives provide a platform for members to explore successes, identify areas of improvement and inspire further growth.
Self-sufficiency
Self-organization and self-sufficiency have become the norm for many teams, giving them more control over assignments, sprint goals and estimations. It’s an efficient way to get high-quality working done within a shorter timeline.
Flexible working
Working smarter, not harder by adapting to unexpected changes in a timely manner is key to a successful workplace. With the right approach, you can stay agile and be equipped for any challenge that comes your way.
Customer satisfaction
Going the extra mile should be goal. Businesses should continually strive to deliver valuable products and services and unparalleled customer gratification.
Better work-life balance
The agile work methodology is a winning formula for businesses in more ways than one. By investing in this system, companies can enjoy increased transparency and productivity while empowering their teams with autonomy over their projects. Employees are proven to be happier, too – what’s not to love?
Value-based frameworks of agile work method
Modern enterprise is facing rapid and ongoing change. Four key elements are quickly evolving: markets, enterprises, behaviors and value-based agility which applies to all parts of an organization. The ultimate goal? Increasing overall value throughout any work process.
Kanban Method
With its origins in Japan, Kanban is an agile working framework based on a visual board that has been used for decades to make processes more efficient. Since emerging from Lean Manufacturing Systems, this dynamic method of agile workplace and software development has revolutionized how projects are monitored by utilizing visuals like charts or cards to track progress.

Kanban works on three principles:
- The ability to envision the work that has to be done at any particular time.
- Setting limits on the quantity of work that has to be done or finished to prevent the team from taking on too much.
- Accelerating work when a certain job is about to be finished so that the following item may be added to the queue.
Scrum is regularly hailed as the most popular agile working framework in the workplace today. Its focus on progress breakdowns, known as “sprints”, and assigning specific roles to employees, creates an efficient and dynamic workflow system.
At its core, Scrum uses a board similar to Kanban that moves tasks based on their development status, providing visibility across every step.
- Product Backlog is a prioritized list of features for the product, owned by the Product Owner.
- Sprint Backlog is a prioritized list of tasks for the Scrum Team to complete during a sprint, focused on delivering a product increment.
- Daily Scrum is a daily meeting to synchronize work settings and progress amongst employees.
- Scrum Masters facilitate and keep the team focused on the process.
- Sprint review and retrospectives assess the completed increments and gather feedback for improvement.
People often confuse Lean and Agile methodology. While both systems share certain benefits when it comes to productivity or output value, their origins differ significantly. Lean is an abbreviation for the renowned set of workplace rules developed by Japanese organizations during the 20th century. An agile workspace was a concept established two decades later.
Lean manufacturing fundamentals:
- Value stream mapping
- Identifying value
- Creating a pull system
- Creating a continuous workflow
- Continuous improvement
Implement agile working in your business
Successful agile working starts with collaboration between HR teams and business leaders. Together, they can design work practices that provide a win-win for employees and the organization – from customers to profitability. The Agility Mindset offers savvy businesses invaluable tools to drive positive change through flexible working arrangements.
Be business-led
To stay competitive, the company culture must be a catalyst for agile work culture. With close coordination between management and HR teams, the team can create practical solutions to benefit clients, staff, and the company as a whole.
Focus on motivating your team
Gaining a clear vision of your business objectives is the best way to create an ideal workforce. By understanding what employees want and need, you can develop agile practices that are beneficial for both employer and employee – leading to optimal performance.
Develop the agile model bottom-up
When crafting an agile workspace business model, it’s best to take things one step at a time. Start with just one operation or unit and then gradually expand your approach as needed. Every enterprise has its own unique requirements. Identify the right fit for yours.
Consider big, strategic changes
Small tweaks to agile working can hone efficiency and performance, but for bigger rewards, you need to think even bigger, reimagine the planning process or consider a radical new idea. Go bold: push yourselves out of the comfort zone and seize those big benefits that come with daring moves.
Revise and adjust
Establishing a successful agile working framework entails following established project management processes from the get-go. As teams learn and grow, it’s important to focus on the mastery of fundamentals before expanding into hybrid models or altering standards during sprint cycles.
Benefits of agile working techniques
More adaptability (and less risk).
Agile working methods provide a unique advantage for employees to stay on top of shifting priorities and changing conditions. With short sprints, team visibility is improved — giving them the data they need during development so decisions are informed by real-time insights, not predictions alone. Regular reporting helps keep stakeholders in sync while reducing project risks throughout the process.
Better customer experience
Want to make sure your project is a success? Focus on customer collaboration. Agile project management emphasizes the importance of working closely with customers and other stakeholders throughout the process. This way, you can ensure that what you’re delivering really meets their needs — leading to maximum satisfaction in the end.
Happier teams
Agile workspace teams are given room to breathe, with the autonomy and trust required to turn their big ideas into real-world accomplishments. It’s an empowering approach that rewards innovation, collaboration and success while keeping everyone motivated along the way.
Constraints of an agile working method
Errors due to inadequate documentation.
Without adequate documentation, team members are more prone to costly slips in quality. This can lead to problems like long onboarding times for new employees and time-wasting activities, that result in loss of time, energy and resources. Investing a bit of effort upfront will save valuable resources down the line.
Unclear scope
Without an established target, projects can become runaway trains that never reach their destination. Setting a clear goal is necessary for meaningful success.
Time Tracking
- Absence Management Software
- Clock In System
- Time Attendance System
- Auto Scheduling
- Duty Roster
- Shift Planning
- Appointment Planning
- Task Planning
- Info Center
- Timesheet Templates
- Rota Templates
- Promotional Program
- Affiliate Program
- Success Stories

- SUGGESTED TOPICS
- The Magazine
- Newsletters
- Managing Yourself
- Managing Teams
- Work-life Balance
- The Big Idea
- Data & Visuals
- Reading Lists
- Case Selections
- HBR Learning
- Topic Feeds
- Account Settings
- Email Preferences
How to Nail a Hybrid Presentation
- Sarah Gershman

Seven tips.
What can leaders do to make hybrid presentations more inclusive and more successful? What can we do to ensure that all participants — those remote and in person — not only feel included and addressed — but can participate fully and add maximum value to the discussion? The authors offer seven strategies for presenters and meeting leaders to more effectively engage everyone in their hybrid audience.
We recently spoke to a CEO who was feeling anxious about public speaking in the hybrid office. “When I give presentations now, it’s simple. Everyone’s on Zoom,” he told us. “What happens when some people go back while others still work from home?”
- Sarah Gershman is an executive speech coach and CEO of Green Room Speakers. She is a professor at the McDonough School of Business at Georgetown University, where she teaches public speaking to leaders from around the globe.
- Rae Ringel is the president of The Ringel Group , a leadership development consultancy specializing in facilitation, coaching, and training. She is a faculty member at the Georgetown University Institute for Transformational Leadership and founder of the Executive Certificate in Facilitation program.
Partner Center
Jump to main nav »
For students, educators, and engineers, physics students.
Students at all levels love Interactive Physics. Whether you are studying physical sciences in middle school or taking advanced physics courses in high school or college, Interactive Physics is a fun, exciting way to explore physics.
Sometimes the most difficult part of physics is understanding the maze of equations in the textbook. Interactive Physics makes sense of the math and lets you visualize and interact with otherwise difficult concepts.
Move beyond a topic.
Interactive Physics allows you to explore physics on a more meaningful level than can be taught on paper or at the chalkboard. You can study what-if scenarios and create nearly any simulation imaginable. Have fun experimenting and inventing new machines, environments, and models.
School-to-work skills
Design Simulation Technologies also develops Working Model for professional scientists and engineers. Check out www.workingmodel.com and see the same, professional motion simulation technology you learn with Interactive Physics!
Engineering Students
Sometimes the most difficult part of engineering is understanding the maze of equations in the textbook. Working Model makes sense ofh4 the math and lets you visualize and interact with otherwise difficult concepts.
Move beyond a topic
Working Model allows you to explore physics on a more meaningful level than can be taught on paper or at the chalkboard. You can study what-if scenarios and create nearly any simulation imaginable. Have fun experimenting and inventing new machines, environments, and models.
Working Model is a powerful tool used by thousands of professional engineers worldwide. The skills learned by using Working Model in school are directly applicable to on-the-job analysis of 2D motion simulations.
- Request a Quote
Company News
Toll Free: (800)-766-6615
Phone: +1-(734)-446-6935
Fax: +1-(734)-259-4207
Sales Inquiries - Direct Line
Phone: +1-(415)-775-1020
- Simscape Multibody
- Mechanical FEA
- Multibody Dynamics
- Controls Engineers
- Alibre Design
- Working Model 2D
- Interactive Physics
- Support Forums
- Login ▼ The login failed The username has expired Forgot your password?
- Return to content
- Home »
- Solutions »
- for Students »
Copyright © 2005–2024 Design Simulation Technologies, Inc. Site design by DesignHub.
We use essential cookies to make Venngage work. By clicking “Accept All Cookies”, you agree to the storing of cookies on your device to enhance site navigation, analyze site usage, and assist in our marketing efforts.
Manage Cookies
Cookies and similar technologies collect certain information about how you’re using our website. Some of them are essential, and without them you wouldn’t be able to use Venngage. But others are optional, and you get to choose whether we use them or not.
Strictly Necessary Cookies
These cookies are always on, as they’re essential for making Venngage work, and making it safe. Without these cookies, services you’ve asked for can’t be provided.
Show cookie providers
- Google Login
Functionality Cookies
These cookies help us provide enhanced functionality and personalisation, and remember your settings. They may be set by us or by third party providers.
Performance Cookies
These cookies help us analyze how many people are using Venngage, where they come from and how they're using it. If you opt out of these cookies, we can’t get feedback to make Venngage better for you and all our users.
- Google Analytics
Targeting Cookies
These cookies are set by our advertising partners to track your activity and show you relevant Venngage ads on other sites as you browse the internet.
- Google Tag Manager
- Infographics
- Daily Infographics
- Popular Templates
- Accessibility
- Graphic Design
- Graphs and Charts
- Data Visualization
- Human Resources
- Beginner Guides
Blog Beginner Guides How To Make a Good Presentation [A Complete Guide]
How To Make a Good Presentation [A Complete Guide]
Written by: Krystle Wong Jul 20, 2023

A top-notch presentation possesses the power to drive action. From winning stakeholders over and conveying a powerful message to securing funding — your secret weapon lies within the realm of creating an effective presentation .
Being an excellent presenter isn’t confined to the boardroom. Whether you’re delivering a presentation at work, pursuing an academic career, involved in a non-profit organization or even a student, nailing the presentation game is a game-changer.
In this article, I’ll cover the top qualities of compelling presentations and walk you through a step-by-step guide on how to give a good presentation. Here’s a little tip to kick things off: for a headstart, check out Venngage’s collection of free presentation templates . They are fully customizable, and the best part is you don’t need professional design skills to make them shine!
These valuable presentation tips cater to individuals from diverse professional backgrounds, encompassing business professionals, sales and marketing teams, educators, trainers, students, researchers, non-profit organizations, public speakers and presenters.
No matter your field or role, these tips for presenting will equip you with the skills to deliver effective presentations that leave a lasting impression on any audience.
Click to jump ahead:
What are the 10 qualities of a good presentation?
Step-by-step guide on how to prepare an effective presentation, 9 effective techniques to deliver a memorable presentation, faqs on making a good presentation, how to create a presentation with venngage in 5 steps.
When it comes to giving an engaging presentation that leaves a lasting impression, it’s not just about the content — it’s also about how you deliver it. Wondering what makes a good presentation? Well, the best presentations I’ve seen consistently exhibit these 10 qualities:
1. Clear structure
No one likes to get lost in a maze of information. Organize your thoughts into a logical flow, complete with an introduction, main points and a solid conclusion. A structured presentation helps your audience follow along effortlessly, leaving them with a sense of satisfaction at the end.
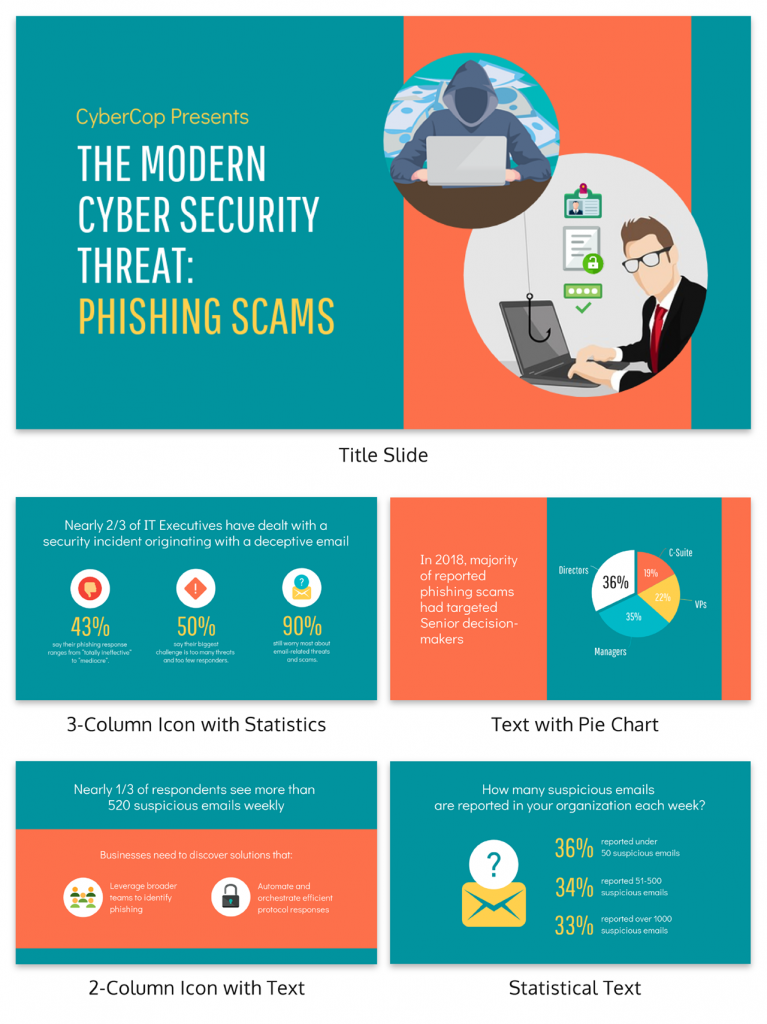
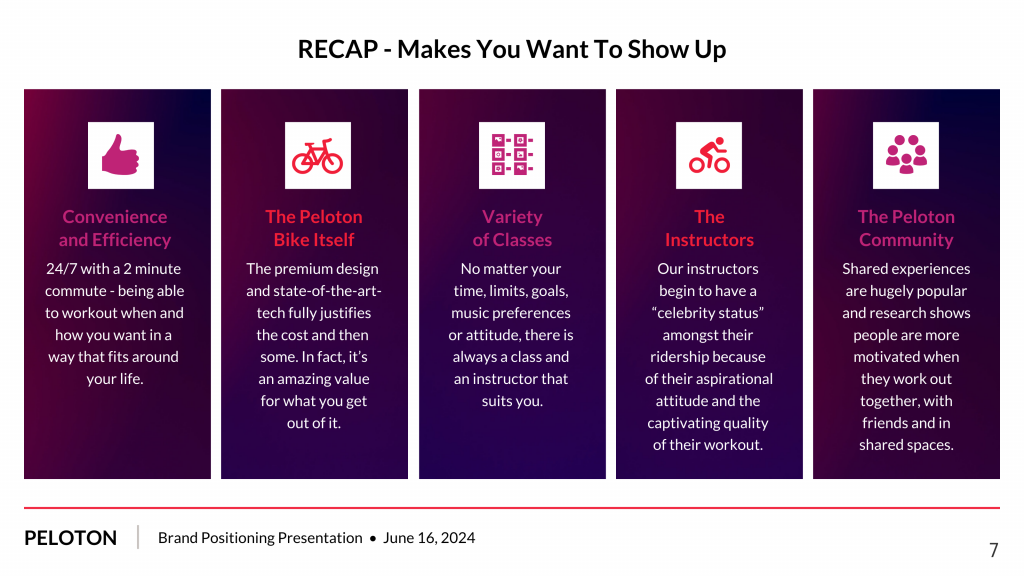
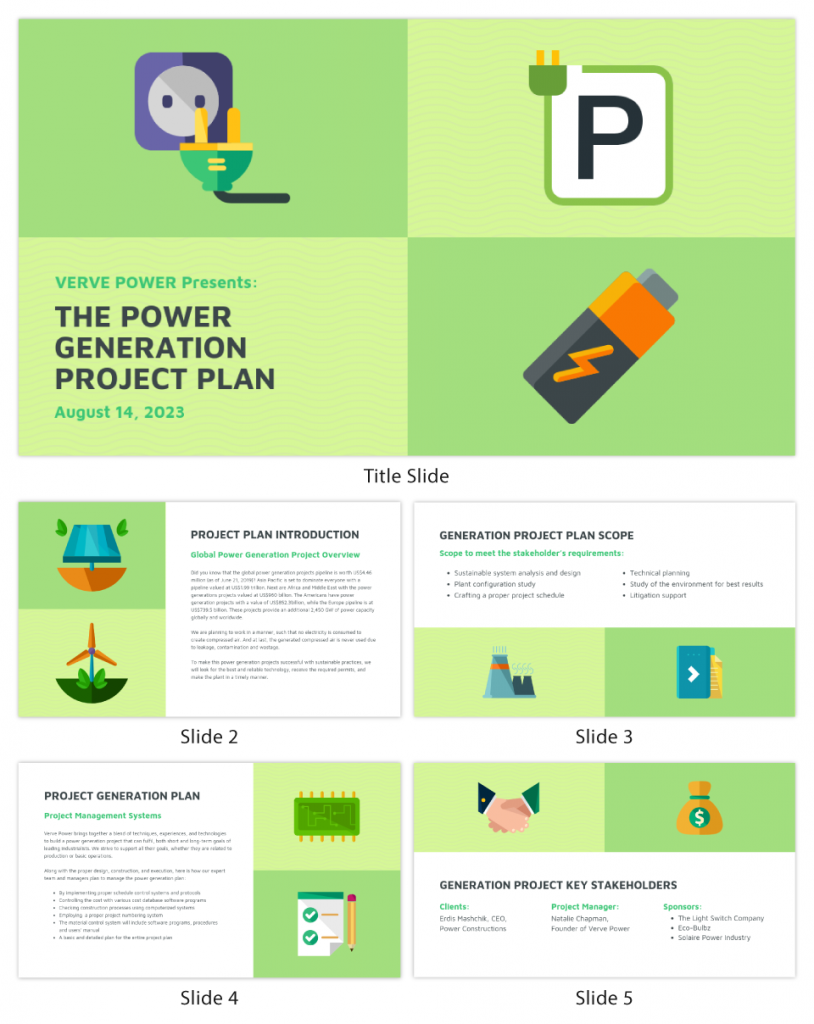
Regardless of your presentation style , a quality presentation starts with a clear roadmap. Browse through Venngage’s template library and select a presentation template that aligns with your content and presentation goals. Here’s a good presentation example template with a logical layout that includes sections for the introduction, main points, supporting information and a conclusion:
2. Engaging opening
Hook your audience right from the start with an attention-grabbing statement, a fascinating question or maybe even a captivating anecdote. Set the stage for a killer presentation!
The opening moments of your presentation hold immense power – check out these 15 ways to start a presentation to set the stage and captivate your audience.
3. Relevant content
Make sure your content aligns with their interests and needs. Your audience is there for a reason, and that’s to get valuable insights. Avoid fluff and get straight to the point, your audience will be genuinely excited.
4. Effective visual aids
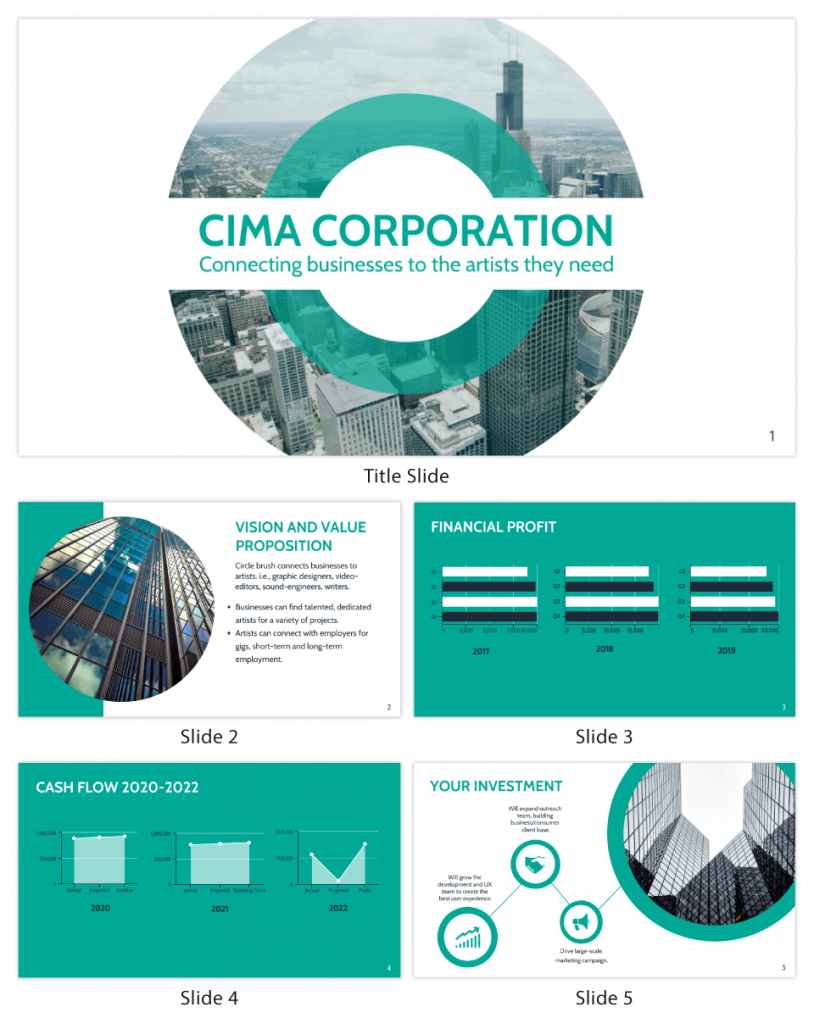
Picture this: a slide with walls of text and tiny charts, yawn! Visual aids should be just that—aiding your presentation. Opt for clear and visually appealing slides, engaging images and informative charts that add value and help reinforce your message.
With Venngage, visualizing data takes no effort at all. You can import data from CSV or Google Sheets seamlessly and create stunning charts, graphs and icon stories effortlessly to showcase your data in a captivating and impactful way.
5. Clear and concise communication
Keep your language simple, and avoid jargon or complicated terms. Communicate your ideas clearly, so your audience can easily grasp and retain the information being conveyed. This can prevent confusion and enhance the overall effectiveness of the message.
6. Engaging delivery
Spice up your presentation with a sprinkle of enthusiasm! Maintain eye contact, use expressive gestures and vary your tone of voice to keep your audience glued to the edge of their seats. A touch of charisma goes a long way!
7. Interaction and audience engagement
Turn your presentation into an interactive experience — encourage questions, foster discussions and maybe even throw in a fun activity. Engaged audiences are more likely to remember and embrace your message.
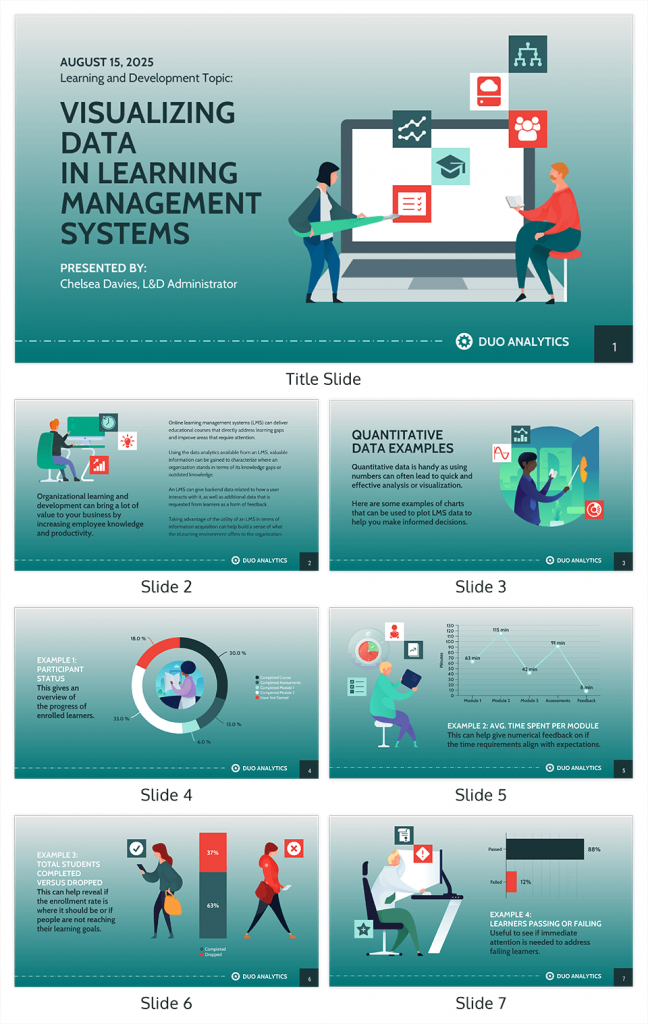
Transform your slides into an interactive presentation with Venngage’s dynamic features like pop-ups, clickable icons and animated elements. Engage your audience with interactive content that lets them explore and interact with your presentation for a truly immersive experience.
8. Effective storytelling
Who doesn’t love a good story? Weaving relevant anecdotes, case studies or even a personal story into your presentation can captivate your audience and create a lasting impact. Stories build connections and make your message memorable.
A great presentation background is also essential as it sets the tone, creates visual interest and reinforces your message. Enhance the overall aesthetics of your presentation with these 15 presentation background examples and captivate your audience’s attention.
9. Well-timed pacing
Pace your presentation thoughtfully with well-designed presentation slides, neither rushing through nor dragging it out. Respect your audience’s time and ensure you cover all the essential points without losing their interest.
10. Strong conclusion
Last impressions linger! Summarize your main points and leave your audience with a clear takeaway. End your presentation with a bang , a call to action or an inspiring thought that resonates long after the conclusion.
In-person presentations aside, acing a virtual presentation is of paramount importance in today’s digital world. Check out this guide to learn how you can adapt your in-person presentations into virtual presentations .
Preparing an effective presentation starts with laying a strong foundation that goes beyond just creating slides and notes. One of the quickest and best ways to make a presentation would be with the help of a good presentation software .
Otherwise, let me walk you to how to prepare for a presentation step by step and unlock the secrets of crafting a professional presentation that sets you apart.
1. Understand the audience and their needs
Before you dive into preparing your masterpiece, take a moment to get to know your target audience. Tailor your presentation to meet their needs and expectations , and you’ll have them hooked from the start!
2. Conduct thorough research on the topic
Time to hit the books (or the internet)! Don’t skimp on the research with your presentation materials — dive deep into the subject matter and gather valuable insights . The more you know, the more confident you’ll feel in delivering your presentation.
3. Organize the content with a clear structure
No one wants to stumble through a chaotic mess of information. Outline your presentation with a clear and logical flow. Start with a captivating introduction, follow up with main points that build on each other and wrap it up with a powerful conclusion that leaves a lasting impression.
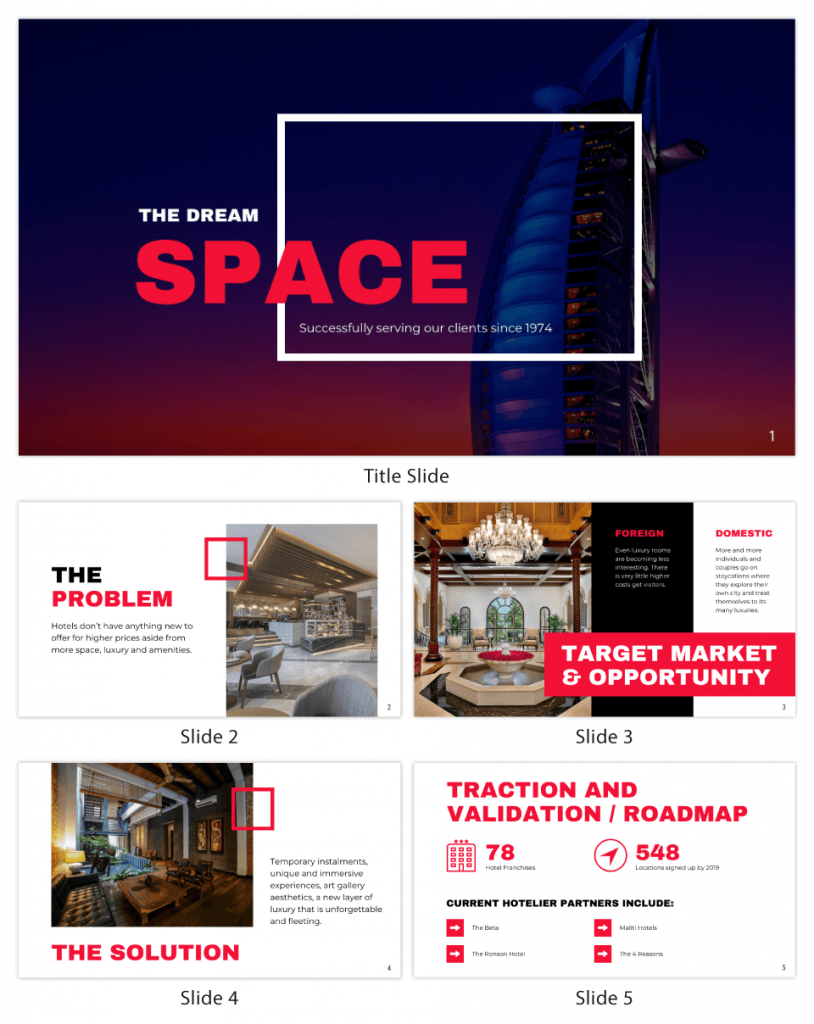
Delivering an effective business presentation hinges on captivating your audience, and Venngage’s professionally designed business presentation templates are tailor-made for this purpose. With thoughtfully structured layouts, these templates enhance your message’s clarity and coherence, ensuring a memorable and engaging experience for your audience members.
Don’t want to build your presentation layout from scratch? pick from these 5 foolproof presentation layout ideas that won’t go wrong.
4. Develop visually appealing and supportive visual aids
Spice up your presentation with eye-catching visuals! Create slides that complement your message, not overshadow it. Remember, a picture is worth a thousand words, but that doesn’t mean you need to overload your slides with text.
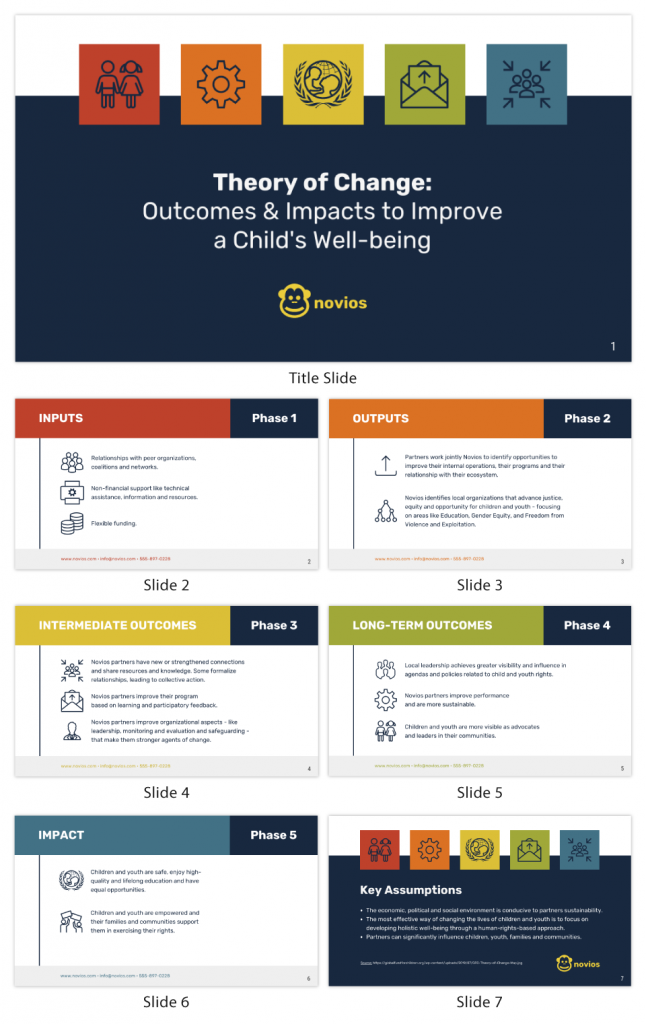
Well-chosen designs create a cohesive and professional look, capturing your audience’s attention and enhancing the overall effectiveness of your message. Here’s a list of carefully curated PowerPoint presentation templates and great background graphics that will significantly influence the visual appeal and engagement of your presentation.
5. Practice, practice and practice
Practice makes perfect — rehearse your presentation and arrive early to your presentation to help overcome stage fright. Familiarity with your material will boost your presentation skills and help you handle curveballs with ease.
6. Seek feedback and make necessary adjustments
Don’t be afraid to ask for help and seek feedback from friends and colleagues. Constructive criticism can help you identify blind spots and fine-tune your presentation to perfection.
With Venngage’s real-time collaboration feature , receiving feedback and editing your presentation is a seamless process. Group members can access and work on the presentation simultaneously and edit content side by side in real-time. Changes will be reflected immediately to the entire team, promoting seamless teamwork.

7. Prepare for potential technical or logistical issues
Prepare for the unexpected by checking your equipment, internet connection and any other potential hiccups. If you’re worried that you’ll miss out on any important points, you could always have note cards prepared. Remember to remain focused and rehearse potential answers to anticipated questions.
8. Fine-tune and polish your presentation
As the big day approaches, give your presentation one last shine. Review your talking points, practice how to present a presentation and make any final tweaks. Deep breaths — you’re on the brink of delivering a successful presentation!
In competitive environments, persuasive presentations set individuals and organizations apart. To brush up on your presentation skills, read these guides on how to make a persuasive presentation and tips to presenting effectively .
Whether you’re an experienced presenter or a novice, the right techniques will let your presentation skills soar to new heights!
From public speaking hacks to interactive elements and storytelling prowess, these 9 effective presentation techniques will empower you to leave a lasting impression on your audience and make your presentations unforgettable.
1. Confidence and positive body language
Positive body language instantly captivates your audience, making them believe in your message as much as you do. Strengthen your stage presence and own that stage like it’s your second home! Stand tall, shoulders back and exude confidence.
2. Eye contact with the audience
Break down that invisible barrier and connect with your audience through their eyes. Maintaining eye contact when giving a presentation builds trust and shows that you’re present and engaged with them.
3. Effective use of hand gestures and movement
A little movement goes a long way! Emphasize key points with purposeful gestures and don’t be afraid to walk around the stage. Your energy will be contagious!
4. Utilize storytelling techniques
Weave the magic of storytelling into your presentation. Share relatable anecdotes, inspiring success stories or even personal experiences that tug at the heartstrings of your audience. Adjust your pitch, pace and volume to match the emotions and intensity of the story. Varying your speaking voice adds depth and enhances your stage presence.
5. Incorporate multimedia elements
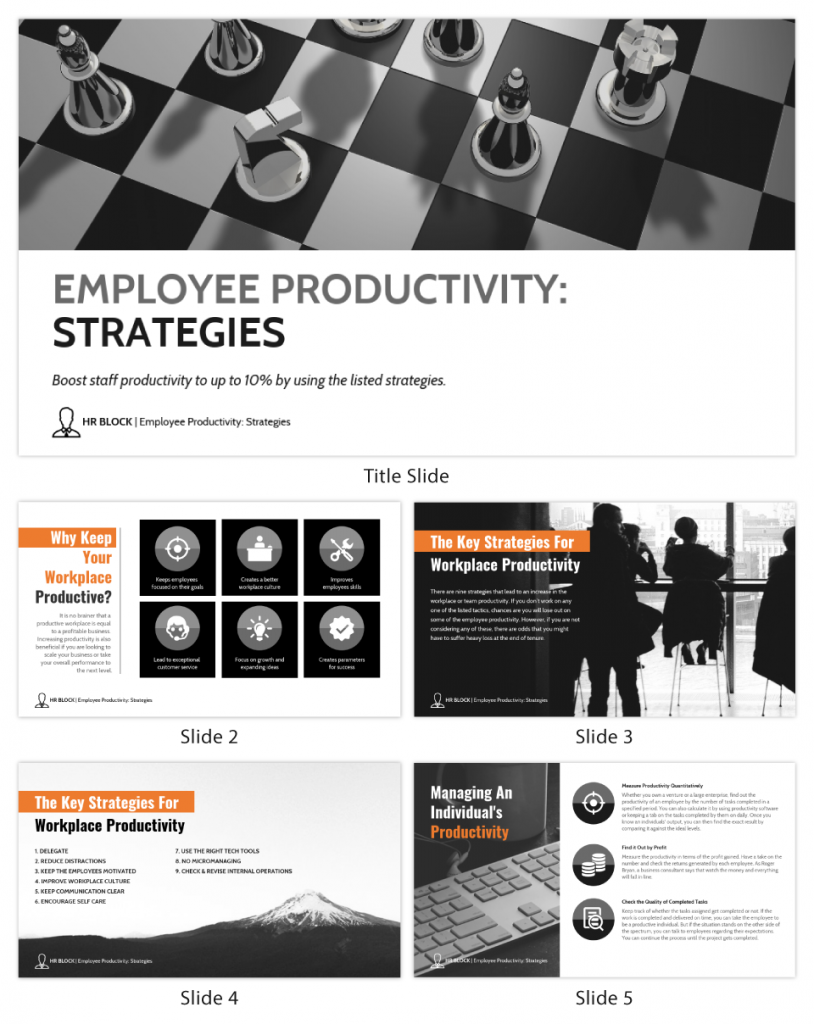
Spice up your presentation with a dash of visual pizzazz! Use slides, images and video clips to add depth and clarity to your message. Just remember, less is more—don’t overwhelm them with information overload.
Turn your presentations into an interactive party! Involve your audience with questions, polls or group activities. When they actively participate, they become invested in your presentation’s success. Bring your design to life with animated elements. Venngage allows you to apply animations to icons, images and text to create dynamic and engaging visual content.
6. Utilize humor strategically
Laughter is the best medicine—and a fantastic presentation enhancer! A well-placed joke or lighthearted moment can break the ice and create a warm atmosphere , making your audience more receptive to your message.
7. Practice active listening and respond to feedback
Be attentive to your audience’s reactions and feedback. If they have questions or concerns, address them with genuine interest and respect. Your responsiveness builds rapport and shows that you genuinely care about their experience.
8. Apply the 10-20-30 rule
Apply the 10-20-30 presentation rule and keep it short, sweet and impactful! Stick to ten slides, deliver your presentation within 20 minutes and use a 30-point font to ensure clarity and focus. Less is more, and your audience will thank you for it!
9. Implement the 5-5-5 rule
Simplicity is key. Limit each slide to five bullet points, with only five words per bullet point and allow each slide to remain visible for about five seconds. This rule keeps your presentation concise and prevents information overload.
Simple presentations are more engaging because they are easier to follow. Summarize your presentations and keep them simple with Venngage’s gallery of simple presentation templates and ensure that your message is delivered effectively across your audience.
1. How to start a presentation?
To kick off your presentation effectively, begin with an attention-grabbing statement or a powerful quote. Introduce yourself, establish credibility and clearly state the purpose and relevance of your presentation.
2. How to end a presentation?
For a strong conclusion, summarize your talking points and key takeaways. End with a compelling call to action or a thought-provoking question and remember to thank your audience and invite any final questions or interactions.
3. How to make a presentation interactive?
To make your presentation interactive, encourage questions and discussion throughout your talk. Utilize multimedia elements like videos or images and consider including polls, quizzes or group activities to actively involve your audience.
In need of inspiration for your next presentation? I’ve got your back! Pick from these 120+ presentation ideas, topics and examples to get started.
Creating a stunning presentation with Venngage is a breeze with our user-friendly drag-and-drop editor and professionally designed templates for all your communication needs.
Here’s how to make a presentation in just 5 simple steps with the help of Venngage:
Step 1: Sign up for Venngage for free using your email, Gmail or Facebook account or simply log in to access your account.
Step 2: Pick a design from our selection of free presentation templates (they’re all created by our expert in-house designers).
Step 3: Make the template your own by customizing it to fit your content and branding. With Venngage’s intuitive drag-and-drop editor, you can easily modify text, change colors and adjust the layout to create a unique and eye-catching design.
Step 4: Elevate your presentation by incorporating captivating visuals. You can upload your images or choose from Venngage’s vast library of high-quality photos, icons and illustrations.
Step 5: Upgrade to a premium or business account to export your presentation in PDF and print it for in-person presentations or share it digitally for free!
By following these five simple steps, you’ll have a professionally designed and visually engaging presentation ready in no time. With Venngage’s user-friendly platform, your presentation is sure to make a lasting impression. So, let your creativity flow and get ready to shine in your next presentation!
Discover popular designs

Infographic maker

Brochure maker

White paper online

Newsletter creator

Flyer maker

Timeline maker

Letterhead maker

Mind map maker

Ebook maker
Home Blog Business The Manager’s Guide to Effective Teamwork
The Manager’s Guide to Effective Teamwork
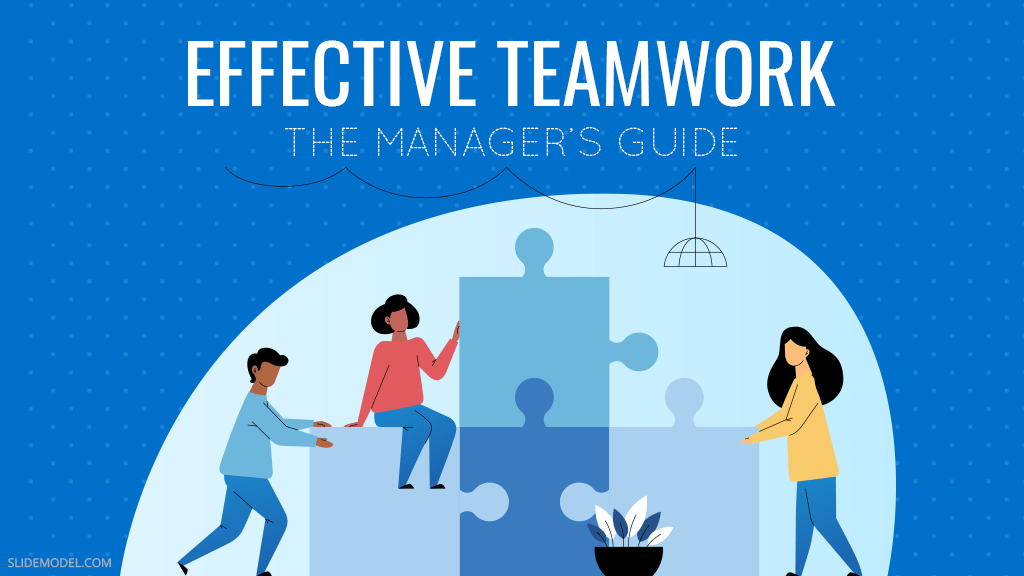
Let’s cut the chase: teamwork is challenging. Encouraging people to communicate better. Getting a team to consistent performance levels. Resolving conflicts.
Everyone who tells you otherwise would be wrong. But the above challenges shouldn’t discourage you from striving to build a high-performing team. While this quick guide won’t provide you with a “silver bullet solution”, it will leave you with a strong base of research-based knowledge you can use to improve your team management skills.
So What is Teamwork?
The International Encyclopedia of the Social & Behavioral Sciences gives the following teamwork definition:
Teamwork is the ability of team members to work together, communicate effectively, anticipate and meet each other’s demands, and inspire confidence, resulting in a coordinated collective action.
The ability to “join forces” to accomplish shared goals has proved crucial since the dawn of humankind. Hunting, gathering, and farming required ancient people to learn to cooperate in order to succeed. Without teamwork skills, we would have never realized such ambitious projects as building railroads, developing the Internet, or soon — sending the first tourists to space.
But let’s reevaluate from aspirations to reality: what are the actual mechanics of effective teamwork?
The Four Defining Characteristics of Teamwork
Social scientists determined that the following four characteristics of teamwork drive most team successes:
Performance monitoring: When working in groups, we tend to analyze how others are handling their chores. This type of natural observation promotes better group accountability. No one wants to appear as a “lagger” among team members. Thus we try to adjust or pace and quality of work to the stands set by others. Because of such “cohesion”, the team as a unit functions smoother.
Feedback: When working in teams, we don’t just watch others — we also provide feedback on how well they are coping with the job. Such a rapport on the effectiveness or ineffectiveness of performance helps homogenize the team’s performance. And respectively — drive efficiency. However, for this to happen, team members must feel comfortable providing and accepting feedback to everyone else, despite the rank of tenure. Free-flowing feedback is the defining characteristic of high-performing teams.
Closed-loop communication: Good communication is vital for effective teamwork. That’s a known fact. What’s more curious is that there’s a specific type of rapport that most teams assume. It’s called “closed-loop communication”.
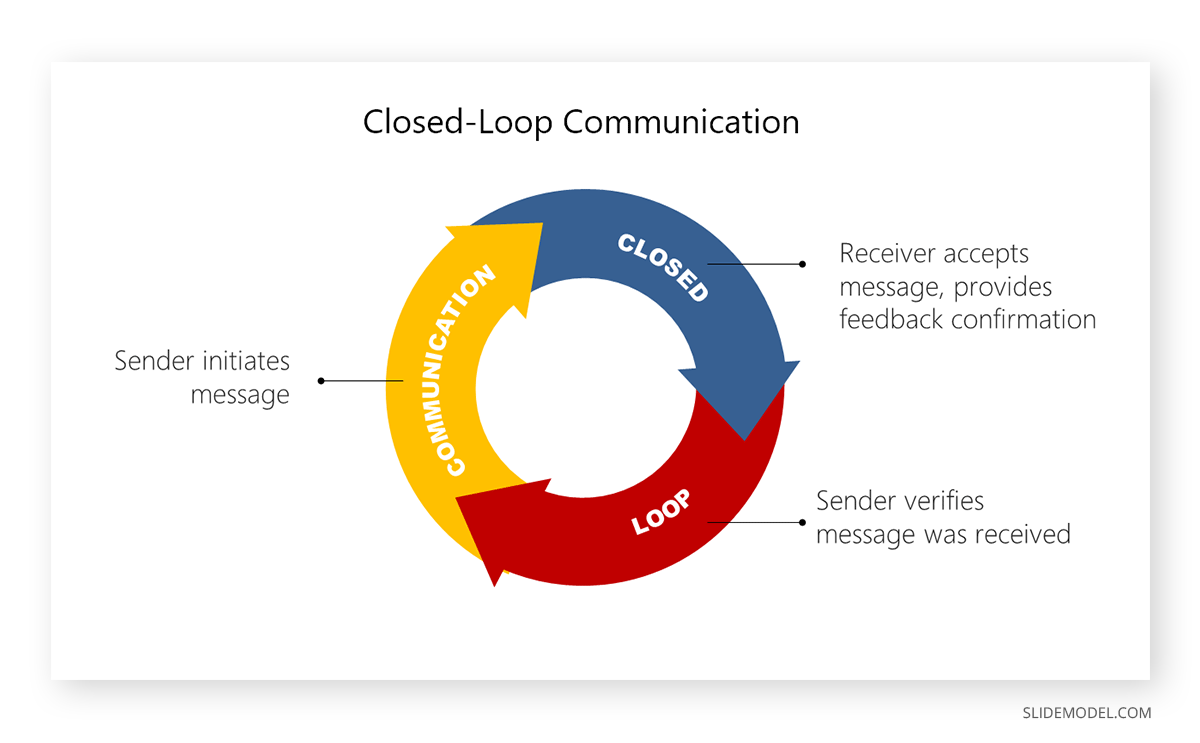
That’s a simple communication style most of us engage in without knowing. A closed-loop conversation goes like this:
- Sara, I need you to create a new go-to-market presentation with 15 slides by Monday.
- Got it, Tim. I will send you over a 15-slide deck by Monday.
- Yes, thanks.
Such a repetition serves several purposes. First, it provides the “sender” with an acknowledgment that their message landed. The “receiver”, in turn, better remembers the message contents, plus verify its correctness with the sender yet again.
Closed-loop communication helps prevent misunderstanding and ensures more smooth information flows between all team participants.
Back-up behaviors: “I’ve got your back!” is the sentiment you experience working in a well-managed team. It arises from the fact that other members are willing to step in when needed and support you. This happens when all team members know how and when to ask for help (without the fear of being judged).
Why is Teamwork Important?
As popular lore says: “teamwork makes the dream work”. That idea holds true at the workplace too! Over 54% of employees admit that a strong sense of community ( common vision and mission , great coworkers, and corporate culture) prompt them to stay longer with the employer.
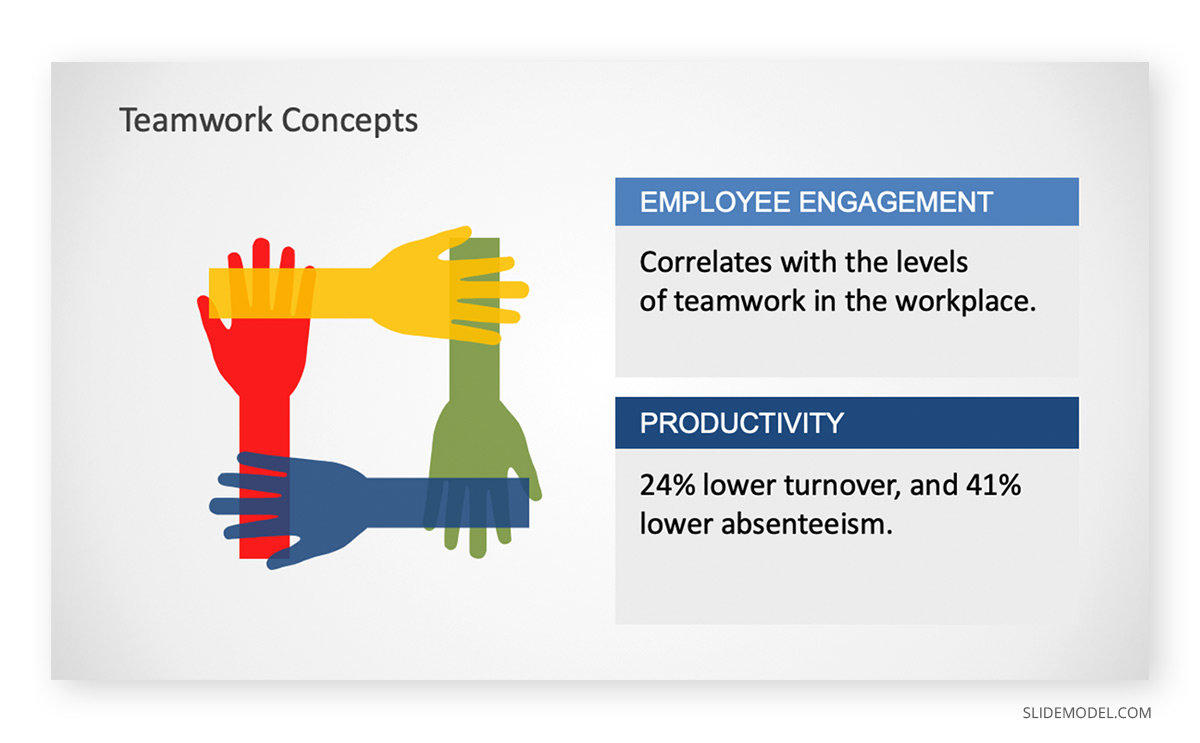
Gallup also found that employee engagement strongly correlates with the overall levels of teamwork in the workplace. Well-oiled teams tend to be 17% more productive, experience 24% lower turnover, and 41% lower absenteeism.
On a broader level, without effective teamwork, organizations struggle to move forward with new initiatives and frequently — fail to complete them. Team performance directly affects project timelines and success rates, plus the overall business bottom line.
On the other hand, well-managed and diverse teams drive better financial outcomes for organizations. McKinsey found teams made up of members from diverse backgrounds (regarding gender, age, ethnicity, etc.) are more creative and perform better by up to 35% better, than homogeneous teams.
To sum up the benefits of teamwork boil down to:
- Improved productivity and operational effectiveness
- Higher employee engagement
- Better financial outcomes for the businesses
- More creative ideas and solutions to trivial issues
Characteristics of a Successful Team
OK, so the importance of teamwork is pretty clear. But how can leaders nurture high-performing teams?
Researchers from the University of Perth found that to succeed with team building , it’s necessary to foster the following characteristics among team members:
- Commitment to team success and shared goals — securing a “buy-in” from a team is key to ensuring their ongoing dedication to the task at hand.
- Interdependence — team members support and encourage their peers to achieve, contribute, and learn while doing the same themselves.
- Interpersonal skills — people on the team can candidly communicate with one another, remain mindful of other people’s needs, and exhibit high emotional intelligence levels.
- Open communication and positive feedback — everyone on the team should be ready to receive and give constructive criticism and feedback.
- Appropriate team composition — every person should understand their role and scope of responsibilities and expectations for them. They should also know how their contributions affect other team members and the entire project.
- Commitment to team processes, leadership & accountability — team members must know the standard operating process and “best practices” that everyone else is using. At the same time, team leaders must also step in whenever their input is needed for shared decision-making and problem-solving.

How to Improve Teamwork: 4 Research-Based Strategies
Many managers believe that team members’ individual attributes such as age, seniority level, or reputation are the most determinant to successful team management.
It’s the opposite. APA found that “deep level factors” such as the person’s values, personality traits, or soft skills can have more far-rearing consequences on teamwork effectiveness.
How do you leverage those deep-level factors to build better teams? Here are four strategies.
Create an Atmosphere of Safety and Openness
Atlassian , a provider of project and team management applications for software teams, recently found that in teams where most team members can be honest and candid, good things happen. Such teams are:
- 60% more likely to achieve the set goals faster
- 80% more likely to report high emotional well-being and job satisfaction
This survey further mirrors APA research and states that most team leaders (and members) say that mutual respect and transparent decision-making are the two driving factors for
increasing team achievement.
Thus, focus on building a similar environment at your company too. This includes:
- Recognize ongoing workplace issues and commit to resolving them
- Address the problem of micromanagement . Consider implementing time tracking .
- Increase transparency via an open door policy
- Encourage honest feedbacking without the fear of repercussions
- Earn the team’s trust by backing your words with actions.
Focus on Developing Team Cognition
Team cognition is a shared understanding team members develop when working together for long periods. Research from the military found that the team’s ability to be synchronized — share the same beliefs, values, perceptions — is the key to consistently high performance.
In high team cognition levels, team members can determine how their peers will think and act in different situations and formulate their responses based on this knowledge. If you ever have been to the ER (or watches series), you know how blazingly fast the team’s response is. Everyone knows which tool to grab, what vitals to record, and how they should act in response to others.
Teams outside of high-pressure environments can also benefit from developing such “shared mental models”. The key to that is teaching your teams to effectively exchange information and pass on the knowledge they have to others. Experienced teams know exactly when to provide or request information from others, who to refer to, and when.
Setting up a team-wide RACI matrix can be a good starting point for building up this type of skill.

Consider Downsizing Your Teams
Research published in Nature journal suggests that small teams are often responsible for the most disruptive ideas. To some extent, this fact can be explained by better collaboration and a higher degree of consensus (which is easier to reach when fewer people are involved).
But that’s not it. Small teams also end up being more creative and capable of delivering amazingly “big” results within a short timeframe.
Researchers from the Wharton School of Business run an interesting experiment. They asked two teams to assemble some Lego.
- A two-person team completed the task in 36 minutes.
- A 4 person team needed 52 minutes to finish the same task.
If you feel that your bigger teams are bogged down with approvals, miscommunication, and some inner-team power dynamics, consider “trimming” them to a more compact size.
Jeff Bezos of Amazon famously popularized the two-pizza team concept. He believed that the best work can be accomplished by a software engineer team that you can feed with two pizzas. Considering how successful Amazon is these days, this idea definitely has its merit!
Final Tip: Help Your People Build Up Their Soft Skills
Strong interpersonal and collaboration skills are the “mortar” of a well-performing team. Sadly, a lot of us tend to overestimate our ability “to get along with others” .
A survey of recent college graduates found that ? believe they can work well in a team environment. However, only a third of managers agreed with this statement.
At the workplace, similar dynamics might be at play. Some managers may think they are “great”, while their team will silently disagree. Make sure that you can identify such trends and address them by suggesting team-building activities, holding training sessions for managers, or providing individual team members with aids and prompts that could help them improve their interpersonal skills.
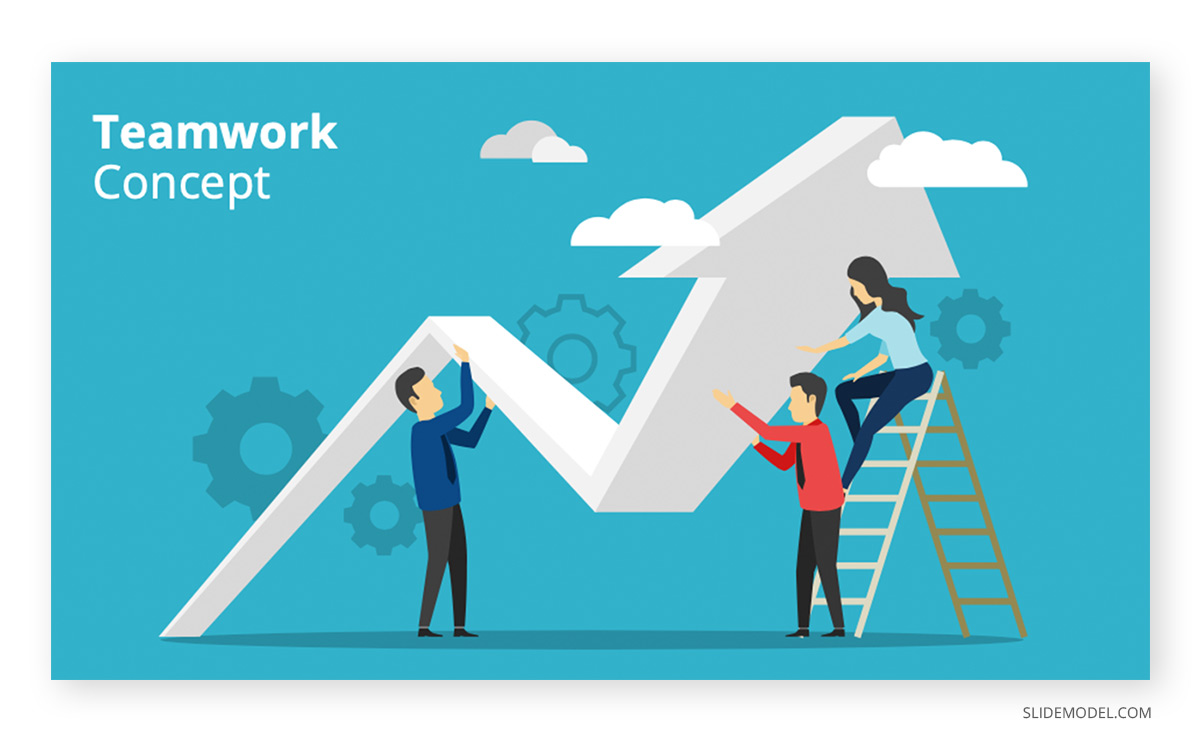
1. Teamwork Concept PowerPoint Template

This template illustrates business growth with the help of teamwork. It presents a cohesive work environment to achieve common goals through the efforts of entire team.
Use This Template
Like this article? Please share
Leadership, Teamwork, Time Management Filed under Business

Related Articles
Filed under Business • April 23rd, 2024
7 Leadership SMART Goals Examples for New Managers
As a leader setting growth goals is one of the priorities at work. In this article we present Leadership SMART Goals Examples to guide your team to success.
Filed under Presentation Ideas • August 5th, 2023
How Parkinson’s Law Can Make Your Presentations Better
Sometimes even the best presenters procrastinate their work until the very last moment. And then, suddenly, they get a flow of ideas to complete their slide deck and present like they have been preparing for it for ages. However, doing so has drawbacks, as even professional presenters cannot always elude the side effects of […]
Filed under Business • May 23rd, 2023
The Ultimate Guide to Start, Stop, Continue Retrospective
Starting with what it is, we dive into the purpose of using the start, stop, continue analysis, discuss its three elements, elaborate how companies can create their own start, stop, continue framework, what it can be used for.
One Response to “The Manager’s Guide to Effective Teamwork”
Do you have a equivalent for agile teams? Bonus points for a SAFe model.
Leave a Reply
Ready to get started?
- Inspiration
23 presentation examples that really work (plus templates!)

- 30 Mar 2023
To help you in your quest for presentation greatness, we’ve gathered 23 of the best business presentation examples out there. These hand-picked ideas range from business PowerPoint presentations, to recruitment presentations, and everything in between.
As a bonus, several of our examples include editable video presentation templates from Biteable .
Biteable allows anyone to create great video presentations — no previous video-making skills required. The easy-to-use platform has hundreds of brandable templates and video scenes designed with a business audience in mind. A video made with Biteable is just what you need to add that wow factor and make an impact on your audience.
Create videos that drive action
Activate your audience with impactful, on-brand videos. Create them simply and collaboratively with Biteable.
Video presentation examples
Video presentations are our specialty at Biteable. We love them because they’re the most visually appealing and memorable way to communicate.
1. Animated characters
Our first presentation example is a business explainer from Biteable that uses animated characters. The friendly and modern style makes this the perfect presentation for engaging your audience.
Bonus template: Need a business video presentation that reflects the beautiful diversity of your customers or team? Use Biteable’s workplace scenes . You can change the skin tone and hair color for any of the animated characters.
2. Conference video
Videos are also ideal solutions for events (e.g. trade shows) where they can be looped to play constantly while you attend to more important things like talking to people and handing out free cheese samples.
For this event presentation sample below, we used bright colours, stock footage, and messaging that reflects the brand and values of the company. All these elements work together to draw the attention of passers-by.
For a huge selection of video presentation templates, take a look at our template gallery .
Business PowerPoint presentation examples
Striking fear into the hearts of the workplace since 1987, PowerPoint is synonymous with bland, boring presentations that feel more like an endurance test than a learning opportunity. But it doesn’t have to be that way. Check out these anything-but-boring business PowerPoint presentation examples.
3. Design pointers
This PowerPoint presentation takes a tongue-in-cheek look at how the speakers and users of PowerPoint are the problem, not the software itself.
Even at a hefty 61 slides, the vintage theme, appealing colors, and engaging content keep the viewer interested. It delivers useful and actionable tips on creating a better experience for your audience.
Pixar, as you’d expect, redefines the meaning of PowerPoint in their “22 Rules for Phenomenal Storytelling”. The character silhouettes are instantly recognizable and tie firmly to the Pixar brand. The bright colour palettes are carefully chosen to highlight the content of each slide.
This presentation is a good length, delivering one message per slide, making it easy for an audience to take notes and retain the information.
Google slides examples
If you’re in business, chances are you’ll have come across slide decks . Much like a deck of cards, each slide plays a key part in the overall ‘deck’, creating a well-rounded presentation.
If you need to inform your team, present findings, or outline a new strategy, slides are one of the most effective ways to do this.
Google Slides is one of the best ways to create a slide deck right now. It’s easy to use and has built-in design tools that integrate with Adobe, Lucidchart, and more. The best part — it’s free!
5. Teacher education
Here’s a slide deck that was created to educate teachers on how to use Google Slides effectively in a classroom. At first glance it seems stuffy and businessy, but if you look closer it’s apparent the creator knows his audience well, throwing in some teacher-friendly content that’s bound to get a smile.
The slides give walkthrough screenshots and practical advice on the different ways teachers can use the software to make their lives that little bit easier and educate their students at the same time.
6. Charity awareness raiser
This next Google slide deck is designed to raise awareness for an animal shelter. It has simple, clear messaging, and makes use of the furry friends it rescues to tug on heartstrings and encourage donations and adoptions from its audience.
Pro tip: Creating a presentation is exciting but also a little daunting. It’s easy to feel overwhelmed — especially if the success of your business or nonprofit depends on it.
Prezi presentation examples
If you haven’t come across Prezi , it’s a great alternative to using static slides. Sitting somewhere between slides and a video presentation, it allows you to import other content and add motion to create a more engaging viewer experience.
7. Red Bull event recap
This Prezi was created to document the Red Bull stratosphere freefall stunt a few years ago. It neatly captures all the things that Prezi is capable of, including video inserts and the zoom effect, which gives an animated, almost 3D effect to what would otherwise be still images.
Prezi has annual awards for the best examples of presentations over the year. This next example is one of the 2018 winners. It was made to highlight a new Logitech tool.
8. Logitech Spotlight launch
What stands out here are the juicy colors, bold imagery, and the way the designer has used Prezi to its full extent, including rotations, panning, fades, and a full zoom out to finish the presentation.

Sales presentation examples
If you’re stuck for ideas for your sales presentation, step right this way and check out this video template we made for you.
9. Sales enablement video presentation
In today’s fast-paced sales environment, you need a way to make your sales enablement presentations memorable and engaging for busy reps. Sales enablement videos are just the ticket. Use this video presentation template the next time you need to present on your metrics.
10. Zuroa sales deck
If you’re after a sales deck, you can’t go past this example from Zuora. What makes it great? It begins by introducing the worldwide shift in the way consumers are shopping. It’s a global phenomenon, and something we can all relate to.
It then weaves a compelling story about how the subscription model is changing the face of daily life for everyone. Metrics and testimonials from well-known CEOs and executives are included for some slamming social proof to boost the sales message.
Pitch presentation examples
Pitch decks are used to give an overview of business plans, and are usually presented during meetings with customers, investors, or potential partners.
11. Uber pitch deck
This is Uber’s original pitch deck, which (apart from looking a teensy bit dated) gives an excellent overview of their business model and clearly shows how they intended to disrupt a traditional industry and provide a better service to people. Right now, you’re probably very grateful that this pitch presentation was a winner.
You can make your own pitch deck with Biteable, or start with one of our video templates to make something a little more memorable.
12. Video pitch template
This video pitch presentation clearly speaks to the pains of everyone who needs to commute and find parking. It then provides the solution with its app that makes parking a breeze.
The video also introduces the key team members, their business strategy, and what they’re hoping to raise in funding. It’s a simple, clear pitch that positions the company as a key solution to a growing, worldwide problem. It’s compelling and convincing, as a good presentation should be.
13. Fyre Festival pitch deck
The most epic example of a recent pitch deck is this one for Fyre Festival – the greatest event that never happened. Marvel at its persuasion, gasp at the opportunity of being part of the cultural experience of the decade, cringe as everything goes from bad to worse.
Despite the very public outcome, this is a masterclass in how to create hype and get funding with your pitch deck using beautiful imagery, beautiful people, and beautiful promises of riches and fame.
Business presentation examples
Need to get the right message out to the right people? Business presentations can do a lot of the heavy lifting for you.
Simply press play and let your video do the talking. No fumbling your words and sweating buckets in front of those potential clients, just you being cool as a cucumber while your presentation does the talking.
Check out two of our popular templates that you can use as a starting point for your own presentations. While they’re business-minded, they’re definitely not boring.
14. Business intro template
Modern graphics, animations, and upbeat soundtracks keep your prospects engaged as they learn about your business, your team, your values, and how you can help them.
15. Business explainer template
Research presentation examples.
When you’re giving a more technical presentation such as research findings, you need to strike the perfect balance between informing your audience and making sure they stay awake.
As a rule, slides are more effective for research presentations, as they are used to support the speaker’s knowledge rather can capture every small detail on screen.
With often dry, complex, and technical subject matter, there can be a temptation for presentations to follow suit. Use images instead of walls of text, and keep things as easy to follow as possible.
16. TrackMaven research deck
TrackMaven uses their endearing mascot to lighten up this data-heavy slide deck. The graphs help to bring life to their findings, and they ensure to only have one bite-size takeaway per slide so that viewers can easily take notes.
17. Wearable tech research report
Obviously, research can get very researchy and there’s not a lot to be done about it. This slide deck below lays out a ton of in-depth information but breaks it up well with quotes, diagrams, and interesting facts to keep viewers engaged while it delivers its findings on wearable technology.
Team presentation examples
Motivating your team can be a challenge at the best of times, especially when you need to gather them together for….another presentation!
18. Team update template
We created this presentation template as an example of how to engage your team. In this case, it’s for an internal product launch. Using colorful animation and engaging pacing, this video presentation is much better than a static PowerPoint, right?
19. Officevibe collaboration explainer
This short slide deck is a presentation designed to increase awareness of the problems of a disengaged team. Bright colors and relevant images combine with facts and figures that compel viewers to click through to a download to learn more about helping their teams succeed.
Recruitment presentation examples
Recruiting the right people can be a challenge. Presentations can help display your team and your business by painting a dynamic picture of what it’s like to work with you.
Videos and animated slides let you capture the essence of your brand and workplace so the right employees can find you.
20. Company culture explainer
If you’re a recruitment agency, your challenge is to stand out from the hundreds of other agencies in the marketplace.
21. Kaizen culture
Showcasing your agency using a slide deck can give employers and employees a feel for doing business with you. Kaizen clearly displays its credentials and highlights its brand values and personality here (and also its appreciation of the coffee bean).
Explainer presentation examples
Got some explaining to do? Using an explainer video is the ideal way to showcase products that are technical, digital, or otherwise too difficult to explain with still images and text.
Explainer videos help you present the features and values of your product in an engaging way that speaks to your ideal audience and promotes your brand at the same time.
22. Product explainer template
23. lucidchart explainer.
Lucidchart does a stellar job of using explainer videos for their software. Their series of explainers-within-explainers entertains the viewer with cute imagery and an endearing brand voice. At the same time, the video is educating its audience on how to use the actual product. We (almost) guarantee you’ll have more love for spiders after watching this one.
Make a winning video presentation with Biteable
Creating a winning presentation doesn’t need to be difficult or expensive. Modern slide decks and video software make it easy for you to give compelling presentations that sell, explain, and educate without sending your audience to snooze town.
For the best online video presentation software around, check out Biteable. The intuitive platform does all the heavy lifting for you, so making a video presentation is as easy as making a PowerPoint.
Use Biteable’s brand builder to automatically fetch your company colors and logo from your website and apply them to your entire video with the click of a button. Even add a clickable call-to-action button to your video.
Share your business presentation anywhere with a single, trackable URL and watch your message turn into gold.
Make stunning videos with ease.
Take the struggle out of team communication.
Try Biteable now.
- No credit card required
- No complicated design decisions
- No experience necessary
How-To Geek
How to insert and animate 3d models in microsoft powerpoint.
Make your presentation stand out and your slides pop off the screen.
Quick Links
Insert a 3d model in powerpoint, customize a 3d model, animate a 3d model.
If you're looking for a unique way to spruce up your slideshow, check out the 3D model feature in Microsoft PowerPoint. You can insert a 3D image then resize it, rotate it, and even animate it with a nifty effect.
If you have your own 3D model , this is a great way to present it to your client or show it off. But you can also pick one from the online library with plenty of categories to match your slideshow's theme or mission.
Related: How to Use Microsoft Paint 3D
Open your presentation in PowerPoint and head to the slide where you want to add the model. Go to the Insert tab and click the drop-down arrow for 3D Models in the Illustrations section of the ribbon.
Related: How to Draw and Edit a Freeform Shape in Microsoft PowerPoint
Choose either "This Device" to upload your own model or "Stock 3D Models" to pick one from the library.
If you want to browse the Online 3D Models available, you'll see many categories. With everything from animals and avatars to vintage cartoons and vehicles, you're sure to find one to enhance your show. You can also use the Search 3D Models field to find a particular one.
Once you choose the model(s) you want to use from your device or the library, click "Insert" to pop it onto the slide.
After you insert the 3D model, you can move it anywhere on the slide by dragging it or resize it by dragging a corner inward or outward, just like an image. You can rotate it by dragging the icon in the center in any direction.
To customize it further, select the model and go to the 3D Model tab. You can choose a view for the model from a nice collection of options. Use the 3D Model Views section of the ribbon to pick the style you want.
Another useful customization option is the Pan & Zoom feature on the right side of the ribbon. With it, you can focus on a specific part of the 3D model.
To use Pan & Zoom, select the model and click the button in the ribbon. You'll see a magnifying glass appear on the right side of the image. Drag it up or down to zoom in or out. You can also move the image inside of its border, helping you get to the exact spot you want. Click the Pan & Zoom button when you finish to deselect the tool and turn it off.
You can then use the additional tools in the ribbon on the 3D Model tab to add alt text , bring the model forward, send it backward, or align it with other objects on the slide.
Maybe you'd like to add some motion to your model. PowerPoint offers a handful of animations specifically for 3D models that make them shine.
Related: How to Control When a Picture Appears in PowerPoint
Select the model and go to the Animations tab. Choose an effect in the Animations section of the ribbon. You can pick from an Entrance (green), a few Emphasis (orange), and an Exit (red) effect for the 3D model.
After you add the effect, you can customize it like other animations in PowerPoint. Select the effect number, go to the Animations tab, and choose the Timing or Advanced Animation options.
Once you finish inserting, customizing, and even animating your 3D model in PowerPoint, you'll have an entertaining addition to your slideshow.
For more on enhancing your PowerPoint slideshows, take a look at how to add rolling credits or how to insert a video .
- help_outline help
iRubric: Science Project : Model and Presentation rubric
- science model
- Presentation
Can we help find anything?
No suggestions.
Suggested Searches
Popular Keyword
Search history, recommended search.
Select your province
*Based on your intended shipping destination/store pick-up location
Please confirm your selection. The page will be reloaded to display the corresponding prices.
We're here for you
Welcome to Samsung Support
Popular searches.
- Galaxy S9 - Insert a microSD Card or Remove it (SM-G960W)
- Which Canadian banks are supported on Samsung Pay?
- Can you wash tennis shoes or sneakers in your Samsung washer?
related search
- Live Translation
- Circle to Search
- How to find model number
- Samsung account
- Washer and Dryer
- Oven cleaning
- Refrigerator cleaning
Product Support
Select a model, how to find model code.
Need some help locating your model number? Select your product from the menus below and we'll show you where your number is.
It may be quicker to check for a solution here
Still can't find the answer you're looking for? Click next to e-mail us
How to enter the unlock code
Unlocking your Galaxy phone lets you use your device with a different provider and network. Disclaimer: When you purchase a Samsung phone from a carrier, your phone is locked to their network for a specified period of time according to the contract. You must contact your carrier to find out the conditions of your contract and obtain an unlock code.
Back up and restore your data
When you back up and restore your content using the storage options on your Galaxy device, you will be able to download the file again.
Update the phone number associated with your Samsung account
Please follow this process before updating to One UI 6.1 Your Samsung account holds a lot of important personal information, so it is protected with two-step verification. You'll receive a text message containing a code on your mobile device to confirm that it is you logging into the account. If your mobile number has changed, and you can't receive the text, you'll need to change the phone number on your account.
Find additional information
Setting up your galaxy device, warranty information, premium care service, screen replacement pricing, request repair service, buy authorized samsung parts, visual support, smartthings support, news & alerts, bespoke upgrade care, download manuals, sign language support, door to door repair service, samsung service: terms & conditions, windows information, samsung members community, maintenance mode, interactive tv simulator, protection & peace of mind, contact info, online support, call support.
1-800-SAMSUNG
Face to Face Support
Printers support.
The coding for Contact US > Call > View more function. And this text is only displayed on the editor page, please do not delet this component from Support Home. Thank you
- Open access
- Published: 23 May 2024
CineMol: a programmatically accessible direct-to-SVG 3D small molecule drawer
- David Meijer 1 ,
- Marnix H. Medema 1 &
- Justin J. J. van der Hooft 1
Journal of Cheminformatics volume 16 , Article number: 58 ( 2024 ) Cite this article
19 Accesses
8 Altmetric
Metrics details
Effective visualization of small molecules is paramount in conveying concepts and results in cheminformatics. Scalable vector graphics (SVG) are preferred for creating such visualizations, as SVGs can be easily altered in post-production and exported to other formats. A wide spectrum of software applications already exist that can visualize molecules, and customize these visualizations, in many ways. However, software packages that can output projected 3D models onto a 2D canvas directly as SVG, while being programmatically accessible from Python, are lacking. Here, we introduce CineMol, which can draw vectorized approximations of three-dimensional small molecule models in seconds, without triangulation or ray tracing, resulting in files of around 50–300 kilobytes per molecule model for compounds with up to 45 heavy atoms. The SVGs outputted by CineMol can be readily modified in popular vector graphics editing software applications. CineMol is written in Python and can be incorporated into any existing Python cheminformatics workflow, as it only depends on native Python libraries. CineMol also provides programmatic access to all its internal states, allowing for per-atom and per-bond-based customization. CineMol’s capacity to programmatically create molecular visualizations suitable for post-production offers researchers and scientists a powerful tool for enhancing the clarity and visual impact of their scientific presentations and publications in cheminformatics, metabolomics, and related scientific disciplines.
Scientific contribution
We introduce CineMol, a Python-based tool that provides a valuable solution for cheminformatics researchers by enabling the direct generation of high-quality approximations of two-dimensional SVG visualizations from three-dimensional small molecule models, all within a programmable Python framework. CineMol offers a unique combination of speed, efficiency, and accessibility, making it an indispensable tool for researchers in cheminformatics, especially when working with SVG visualizations.
Introduction
Cheminformatics knowledge transfer primarily occurs through presentations, published articles, tutorials, and textbooks. In these contexts, three-dimensional molecular visualizations of small molecules play a crucial role in facilitating the understanding of underlying concepts and research outcomes while also adding layers of informative value. To illustrate this point, consider the scenario where a methodology for generating molecular conformations is presented, and its fidelity is assessed by comparing the root-mean-squared deviation of the atom positions to a validated experimental target. In this case, the inclusion of visual representations displaying both the generated conformation and the target conformation serves as an immediate visual indicator of the quality of the generated structure and allows for a visual aid in the quality assessment. Another instance is the portrayal of potential orientations of ligands within a binding pocket of a protein and their spatial proximity to crucial active site residues. A third example is that a researcher might want to demonstrate how specific functional groups within a molecule exhibit closer spatial proximity under specific environmental conditions than would be inferred solely from their skeletal structural formula. In all these instances, graphical representations hold the potential to convey information far more effectively and intuitively than an extensive textual description. Fortunately, a multitude of software applications are readily available to aid scientists and researchers in crafting three-dimensional visualizations of molecules. Among the noteworthy tools in this domain are Jmol [ 1 ], 3Dmol.js [ 2 ], Blender [ 3 ], PyMOL [ 4 ], and RDKit [ 5 ] each offering distinct capabilities and features for the visualization and analysis of molecular structures.
The way these tools interface with users determines their usability. Standalone desktop applications provide a user-friendly graphical interface for visualizing molecules, but they lack programmatic accessibility, meaning you cannot control them via scripts, and they cannot be integrated directly into other software as libraries. Jmol falls into this category. Web applications are interactive as well but typically render models on the client side, limiting them to JavaScript, which modern browsers support. Examples include 3Dmol.js and JSmol, the JavaScript version of Jmol. Resources such as the Protein Data Bank ( https://www.rcsb.org/ ) and PubChem ( https://pubchem.ncbi.nlm.nih.gov/ ) rely on such tools to display three-dimensional structures. Notably, 3Dmol.js can also be programmatically utilized in Python through an IPython interface called py3Dmol within Jupyter notebooks. Command line interfaces (CLIs) enable users to interact with programs via the command line, although some of these programs may also feature a graphical user interface (GUI). Certain software applications offer multiple interaction methods, such as Blender and PyMOL. Blender and PyMOL are desktop applications that provide both a command line interface and a Python application programming interface (API). Regarding their underlying technology, Jmol relies on a specialized Java-based graphics engine, while 3Dmol.js is a JavaScript library that utilizes WebGL, a JavaScript implementation of the versatile graphics library known as OpenGL [ 6 ], for rendering graphics. Blender and PyMOL have their cores developed in C and also employ OpenGL for rendering.
Python is the language of choice for many researchers in cheminformatics as well as other domains of science that deal with molecular information, due to its versatility and extensive libraries. Therefore, it is important to note that the aforementioned tools are not inherently Python-centric. Compiled languages like C and Java often offer faster performance; however, when employed within a Python-first environment, they may introduce additional dependencies, which could be considered excessive when the primary goal is to generate three-dimensional visualizations of chemical compounds. Additionally, users will not have direct access to all the internal states of objects when they can solely interact with the library through an API, although this might be desired by the user when they would like to apply specific stylistic choices in a programmatic way that are not supported by the API directly. RDKit is a widely used cheminformatics toolkit for cheminformaticians working in Python. RDKit can draw three-dimensional conformations of molecular structures and facilitates customization of these visualizations. However, to our knowledge, it is not yet possible to directly output these images as SVGs.
Creating visuals for compounds is typically just the beginning of the process. More often than not, these rendered images find their way into ensemble figures. When creating visuals for this purpose, it is preferred to output them as scalable vector graphics (SVGs). SVGs describe geometries in a vectorized form using an extensible markup language (XML) format, which format is designed to be shareable. This makes SVG easily modifiable either through a text editor or via a GUI within illustration software such as Adobe Illustrator or Inkscape. However, it’s important to note that the graphics rendering engines of the aforementioned molecular visualization tools are not inherently designed for direct SVG output. While plugins such as the render freestyle SVG add-on for Blender [ 7 ] or stand-alone tools like gl2ps [ 8 ] might extend this capability, creating SVGs from complex three-dimensional models involves a more intricate process.
Complex three-dimensional shapes are often constructed from simpler flat surface geometric shapes, typically triangles. The description of a complex three-dimensional shape involves connecting these triangles through a process called triangulation. The level of detail in the three-dimensional model depends on the number of triangles used. These triangles are then projected into the two-dimensional SVG canvas. However, merely sorting and rendering these two-dimensional shapes is insufficient when two or more model meshes intersect. To address this, algorithms are employed to sort and subdivide the triangles into visible and invisible parts. This recursive computational process is resource intensive. If this process is not conducted with sufficient detail, intersection lines appear jagged, particularly for models with a lot of curved surfaces—like space-filling molecule models depicting overlapping atom spheres. Additionally, when executed at a high level of detail, SVG files may become exceedingly large, reaching sizes in the tens or hundreds of megabytes, even for relatively small models as every individual triangle needs to be defined in the SVG. Another avenue for outputting SVGs is to embed a PNG within an SVG format. This is less desirable because these SVGs do not provide true vector graphics and are no longer editable as SVG files in post-production, thus limiting their versatility.
To tackle these specific challenges, we introduce CineMol—a Python-centric, dependency-free solution for generating true SVG representations of three-dimensional models of small molecules. CineMol employs a straightforward algorithm to rapidly and accurately approximate two-dimensional projections of three-dimensional scenes. It excels in producing compact SVG files, often just hundreds of kilobytes in size, making them highly practical for sharing, drawing molecules, and enabling extensive customization during post-production. CineMol offers users a user-friendly Python library along with a command-line tool, simplifying the process of creating SVG approximations of three-dimensional molecular scenes. Furthermore, we have developed a demo web page where prospective users can effortlessly generate SVG models from SDF files ( https://moltools.bioinformatics.nl/cinemol ), providing a hands-on experience with our tool’s capabilities.
Implementation
CineMol approximates the two-dimensional projections of a three-dimensional scene of atoms and bonds on an SVG canvas without computationally expensive meshes or ray tracing. To ensure that CineMol effectively represents intersections while maintaining the high performance that allows it to generate SVGs in a matter of seconds, various methods were employed to limit the number of calculations.
First, a three-dimensional scene is created by assembling the in CineMol available sphere, cylinder, and wireframe geometries and their styling. This can be done by the user directly when they want full control over the scene and its styling, or by creating Atom and Bond objects and feeding it into the draw_molecule API, together with a global style. The CineMol algorithm will then start by mapping three-dimensional points on the surfaces of the scene items (Fig. 1 a). The number of points generated (N) for each geometry is based on the resolution parameter.
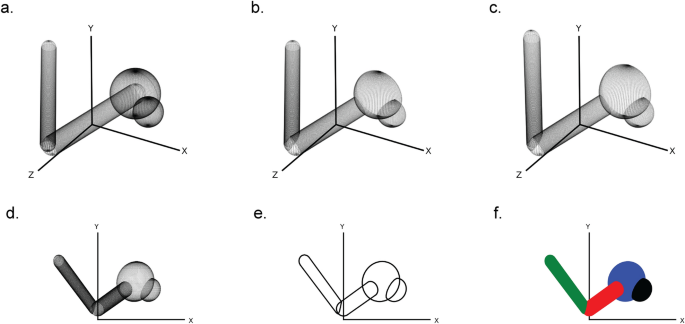
The six steps of CineMol’s algorithm for creating a two-dimensional polygonal projection of a three-dimensional scene. a Points are generated on the surfaces of the geometric items in the scene. The number of points generated is based on the resolution parameter. b The scene items are filtered on the z-coordinate of their centroid and points invisible from the point-of-view of CineMol are discarded. c The three-dimensional points are projected based on the focal length of the scene. d The z-coordinate is discarded to make the scene two-dimensional. e CineMol’s convex hull algorithm calculates the convex shape around each item’s two-dimensional point cloud to create polygonal outlines. f Polygons are drawn in their previously sorted order and a fill style is applied. Matplotlib (v3.8.2) was used to create this figure [ 12 ]
For a sphere, we generate N points on the surface based on ɸ azimuthal angles (= resolution + 1) times θ polar angles (= resolution + 1). For a cylinder, we first generate N points (= resolution + 1) uniformly distributed points between a start position vector and an end position vector. These points form the centers of circles that outline the body of the cylinder. For every circle, we generate N points (= resolution ) on the circumference. We cap the cylinder with either no cap or a round cap. The round cap is created by generating points for half a sphere on either end of the cylinder. The resolution parameter has no impact on a wireframe geometry.
After generating points on the surface of our three-dimensional scene items, the algorithm filters points based on their visibility from CineMol’s fixed viewpoint (Fig. 1 b). CineMol has a fixed view direction towards the origin along the positive z-axis. To speed up the algorithm, we sort scene items from farthest to nearest to the viewpoint based on the z-coordinate of their centroid. As SVG draws polygons in chronological fashion, we only assess intersections for each item between earlier drawn items. For quick intersection checks, we check if the centers of spheres and the central line of cylinders are within each other's vicinity, considering that covalent bonds mainly intersect at their ends with other atoms (i.e., spheres) and bonds (i.e., cylinders). Wireframes are only sorted based on their centroid before drawing. For the remaining points, the algorithm projects their x and y coordinates using a provided focal length (Fig. 1 c) and then disposes of the z-coordinate to create a two-dimensional projection (Fig. 1 d).
Now, each item comprises a two-dimensional point cloud, representing projected surface points visible from CineMol’s viewpoint, considering that items will be drawn based on their initial z-axis distance to CineMol’s point of view. To establish the smallest encapsulating polygon outlining each point cloud, the quickhull (a two-dimensional algorithm to find a convex hull [ 9 ]) is applied (Fig. 1 e). The polygons are then drawn from the furthest away to most nearby to CineMol’s point of view, and the supplied fill is applied as styling (Fig. 1 f). This fill can be either solid, for a cartoon style, or a gradient for a glossy look (i.e., radial-gradient for spheres and a linear gradient for cylinders). Wireframes can only be styled based on the provided stroke color.
The draw_molecule API is wrapped around the Scene object and applies a uniform style to all atoms and bonds given to it. The draw_molecule API uses the Corey–Pauly–Koltung (CPK) scheme for determining atom and bond colors [ 10 ]. The atom radii are sourced from the atomic radii values in the periodic table of elements from PubChem [ 11 ]. The draw_molecule API is wrapped around a Scene object. The Scene object is the engine behind the draw_molecule API and describes a lower-level abstraction of the scene to draw in terms of sphere, cylinder, and wire geometries. When users would like to fully customize their model instead of using a general style from the draw_molecule API they can opt for using the Scene object directly and give each geometry their personalized style, if desired.
Results & discussion
In the following section, we present a series of examples to illustrate the versatility and effectiveness of CineMol, our Python-based three-dimensional molecular visualization tool. These examples serve to showcase the type of depictions and the range of applications that CineMol can accommodate. We will also demonstrate CineMol’s ability to swiftly compute a scene within seconds, showcasing its linear computational scalability, with respect to the number of atoms to draw, when tested on a series of molecular conformers, all while generating compact file sizes. All images in this results section were generated on a MacBook Pro with an Apple M2 chip and 8 GB memory.
CineMol: a versatile three-dimensional small molecule drawer
CineMol has a versatile Scene object that empowers users to create a wide array of scenes composed of spheres, cylinders, and wireframes, catering to diverse visualization needs. In addition to this, CineMol’s draw_molecule API (wrapped around the Scene object) provides a user-friendly solution right out of the box, offering four distinct depiction types: space-filling (Fig. 2 a), ball-and-stick (Fig. 2 b), tube (Fig. 2 c), and wireframe (Fig. 2 d), along with two unique rendering styles: cartoon (Fig. 2 top row) and glossy (Fig. 2 bottom row). The cartoon rendering style assigns a solid color fill and stroke to each polygon, while the glossy rendering style replicates specular and shadow effects. If the polygons were composed of triangles instead (for example, from the result of triangulation), each surface could have been individually styled to realistically generate specular and shadow effects. Unfortunately, this is not achievable in SVG when the surface is a single polygon.
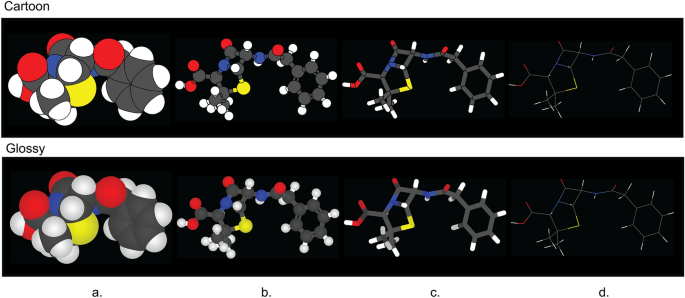
The four depiction types and two fill styles supported by CineMol’s draw_molecule API. a Space-filling. b Ball-and-stick. c Tube. d Wireframe. The wireframe depiction only supports stroke color and stroke opacity changes and has no separate glossy style. A resolution of 100 and a scale factor of 10.0 was used to generate these images. Algorithm runtimes (cartoon/glossy): space-filling = 1.5 s/1.5 s; ball-and-stick = 1.9 s/1.9 s; tube = 3.4 s/3.4 s; wireframe = 1 ms/1 ms. File sizes (cartoon/glossy): space-filling = 65 kb/74 kb; ball-and-stick: 176 kb/206 kb; tube = 75 kb/93 kb; wireframe = 14 kb/14 kb. The SDF containing the penicillin G conformer used to generate these images was retrieved from PubChem [ 13 ]. Adobe Illustrator 2024 was used to compile the SVGs and generate the figure in PNG format
The draw_molecule API has multiple parameters, which are outlined comprehensively in Table 1 , providing users with an intuitive and flexible tool for generating molecular visualizations tailored to their specific requirements. Each atom and bond given to the draw_molecule API can have its color, radius, and opacity set manually to override the defaults. The draw_molecule API can, after installing CineMol with pip, be used directly by importing it in a Python project.
We have developed two user-friendly interfaces that enable users to swiftly start utilizing CineMol. A GUI built on top of the draw_molecule API is available at https://moltools.bioinformatics.nl/cinemol . Additionally, the installation of CineMol ships with a CLI wrapped around the draw_molecule API as well, which contains much of the same functionality. Currently, molecules in the form of structure-data format (SDF) files can be supplied to the GUI and CLI. CineMol places its primary emphasis on visualization rather than parsing various file formats. As a deliberate design choice, we have refrained from incorporating third-party libraries for file parsing. This decision allows users the freedom to select their preferred cheminformatics toolkit for this specific purpose, providing flexibility and compatibility with a wide range of data sources.
Furthermore, CineMol does not contain any functionality for generating three-dimensional conformations of compound structures. Consistent with its approach of avoiding dependencies for file parsing, we provide users with the flexibility to select their preferred software for conformer generation, rather than bundling such functionalities. For example, the widely used cheminformatics toolkit RDKit can be used to generate conformers for compounds. This is further highlighted in the section titled “CineMol allows full customization of models for experienced users”.
CineMol allows full customization of models for experienced users
Experienced Python users may desire additional customization options for their molecular models, and CineMol offers the flexibility to achieve this. To do so, users can leverage the underlying Scene object and supply it with model nodes. These nodes come in three distinct shapes: spherical, cylindrical, or wire, allowing for tailored molecular representations. Each model node is accompanied by its styling. Three examples are shown in Fig. 3 , and the exact implementations of these examples can be found in the CineMol GitHub at https://github.com/moltools/CineMol/tree/main/examples .

Examples of custom figures created programmatically direct-to-SVG with CineMol. a A daptomycin conformer with its monomers highlighted. b Three superimposed conformations of o-benzylphenol. c The lysozyme 9LYZ with bound bacterial cell wall trisaccharide NAM-NAG-NAM. Algorithm runtimes: 3a = 1.8 s; 3b = 3 min; 3c = 2.3 s. File sizes: 3a = 123 kb; 3b: 211 kb; 3c = 135b. Adobe Illustrator 2024 was used to compile the SVGs and generate the figure in PNG format
Figure 3 a shows a generated three-dimensional conformation of the non-ribosomal peptide daptomycin that was generated with the wrapper draw_molecule API with a resolution of 50. Every different color highlights a distinct monomer in the molecule. The conformation generation and the substructure searches were performed with RDKit v2023.9.6 [ 5 ]. Figure 3 b shows three RDKit-generated conformations of o-benzylphenol superimposed on each other. To accurately visualize the intersecting spheres and bonds, the resolution was increased to 150 and we instructed the algorithm to not filter nodes for intersecting. By default, the algorithm filters nodes for intersection. This means that a quick check is performed to estimate if two nodes intersect before calculating the exact intersection. Turning off this quick check slows down the calculation but makes sure that every intersection is accurately visualized in this particular case. The Scene API allows users to set or include specific calculations to create their own trade-off between accuracy and speed. Figure 3 c shows a wireframe of the lysozyme 9LYZ with a space-filling model of the bound bacterial cell wall trisaccharide NAM-NAG-NAM [ 14 ]. The opacity of the protein wireframe was set to 0.75, and the model was manually rotated to show the bound ligand more clearly. The PDB file was parsed with the bioinformatics toolkit biopython v1.83 [ 15 ].
CineMol generates SVG drawings with small file sizes in a matter of seconds
Figure 4 illustrates the runtime performance and resulting file sizes when generating models for 4548 protein-bound ligand conformations from the Platinum dataset v2017_01 [ 16 ]. These results were obtained using the draw_molecule API with a resolution of 50 and excluding hydrogen atoms.

Runtime and file size performance metrics for generating SVG models for 4548 protein-bound ligands from the Platinum dataset. a Number of heavy atoms and bonds per ligand in the Platinum dataset. wireframe model SVG files magnitudes smaller than the SVG files for the other model styles. b Runtime performance. c File sizes. The fill lines indicate one standard deviation. Matplotlib (v3.8.2) was used to create this figure [ 12 ]
Several key observations can be made from the data. First, all atoms in the dataset contain between 10 and 45 heavy atoms and between 10 and 50 bonds, as depicted in Fig. 4 a. This demonstrates the applicability of CineMol for molecules of these sizes. It is important to note that a resolution of 50 was used and only heavy atoms were considered for this analysis.
The data reveals general trends among space-filling, tube, and ball-and-stick models. Runtime and file size show a linear relationship (as denoted by Fig. 4 b). Tube models exhibit double the runtime of space-filling and ball-and-stick models due to the computationally intensive nature of calculating cylinder-cylinder intersections, since cylinders tend to have more generated points than spheres after filtering. The algorithm does not calculate cylinder-cylinder intersections for ball-and-stick models, as they are typically not visible given the smaller radii of bonds compared to atoms in molecular models. If bond radii were larger than atom radii, a tube model would be more appropriate to generate anyway. Users can customize the behavior regarding which geometries require intersection calculations by directly accessing the Scene object.
Furthermore, file sizes for ball-and-stick models are approximately twice as large as those for space-filling and tube models (Fig. 4 c). This is expected because ball-and-stick models typically entail about twice as many polygons to describe in the SVG file. The runtime difference between glossy and cartoon styles remains minimal since only the fill step (as shown in Fig. 1 f) differs and is not computationally intensive. File sizes for SVG models with a glossy style are a factor bigger than SVG models with a cartoon style (Fig. 4 c). This can be explained by the fact that gradients, which are used to create the glossy look, take more characters to describe than a solid fill, which is used to create the cartoon look.
Wireframe models present distinct trends compared to other style types. In wireframe models, no intersections are calculated; instead, only the sorting of individual wires is performed. This process is not computationally demanding, resulting in consistently small runtimes (Fig. 4 b). Wireframe model SVG files are also magnitudes smaller than the SVG files generated for other model styles. Line segments in wireframe models are defined by start and end positions, while single polygons consist of numerous individual line segments (Fig. 4 c).
In summary, for this set of ligands, the runtime ranges from 1 to 1200 ms, indicating that CineMol can efficiently render similarly sized ligands in seconds with a reasonable resolution of 50. The runtime of CineMol typically scales quadratically with the resolution. For example, drawing a space-filling model of penicillin G, which has 23 heavy atoms, without hydrogen atoms, takes approximately 200 ms for a resolution of 50, approximately 800 ms for a resolution of 100, and approximately 3.2 s for a resolution of 200. A resolution of 100 is sufficient for most applications. Any resolution higher than 200 tends not to lead to visible improvements for most applications. File sizes remain in the range of tens to hundreds of kilobytes across all style combinations.
Conclusions
In conclusion, CineMol addresses a specific need in cheminformatics by providing a Python-first software package capable of producing precise SVG representations of small molecule models. This tool facilitates enhanced visualization options for three-dimensional molecular structures with a focus on customization and the ability for post-production editing. CineMol’s efficient performance and accessibility make it a valuable tool for researchers and scientists in the field of chemistry and beyond.
Availability of data and materials
CineMol v1.0.0 is available for Python versions 3.10 and up, has no third-party dependencies, and is released to PyPI ( https://pypi.org/project/cinemol/ ). The source code of CineMol is freely available on GitHub at https://github.com/moltools/cinemol under the MIT license, together with the code to generate any figure present in this article. We have followed the reproducibility and reusability guidelines as described by Hoyt et al. [ 17 ], using the cookiecutter-snekpack template ( https://github.com/cthoyt/cookiecutter-snekpack ). A web-based demo version of CineMol is available at https://moltools.bioinformatics.nl/cinemol . We have archived the version of CineMol’s repository used to generate results for this publication with Zenodo ( https://doi.org/10.5281/zenodo.11242217 ).
Jmol: an open-source Java viewer for chemical structures in 3D. http://www.jmol.org/ . Accessed 7 Jan 2024.
Rego N, Koes D (2015) 3Dmol.js molecular visualization with WebGL. Bioinformatics 31:1322–1324. https://doi.org/10.1093/bioinformatics/btu829
Article PubMed Google Scholar
Blender Foundation. https://www.blender.org/ . Accessed 7 Jan 2024.
PyMOL. https://pymol.org/2/ . Accessed 7 Jan 2024
RDKit: Open-source cheminformatics. https://www.rdkit.org/ . Accessed Jan 7 2024
OpenGL. https://www.opengl.org/ . Accessed 7 Jan 2024
Blender manual: Freestyle SVG exporter. https://docs.blender.org/manual/en/latest/addons/render/render_freestyle_svg.html . Accessed 7 Jan 2024
GL2PS: an OpenGL to PostScript printing library. https://www.geuz.org/gl2ps/ . Accessed 7 Jan 2024.
Greenfield JS (1990) A proof for a quickhull algorithm. Electrical Engineering and Computer Science-Technical Reports
Koltun WL (1965) Space filling atomic units and connectors for molecular models. US Patent. 3170246
National Center for Biotechnology and Information (2024) Atomic Radius in the Periodic Table of Elements. https://pubchem.ncbi.nlm.nih.gov/periodic-table/atomic-radius . Accessed Jan 7 2024
Hunter JD (2007) Matplotlib: A 2D graphics environment. Comput Sci Eng 9:90–95
Article Google Scholar
National Center for Biotechnology and Information (2024) PubChem compound summary for CID 5904, Penicillin G. https://pubchem.ncbi.nlm.nih.gov/compound/Penicillin-G . Accessed Jan 7 2024
Kelly JA, Sielecki AR, Sykes BD, James MNG, Phillips DC (1979) X-ray crystallography of the binding of the bacterial cell wall trisaccharide NAM-NAG-NAM to lysozyme. Nature 282:875–878
Article CAS PubMed Google Scholar
Hamelryck T, Manderick B (2003) PDB file parser and structure class implemented in Python. Bioinformatics 19(17):2308–2310
Friedrich N-O, Meyder A, de Bruyn KC, Sommer K, Flachsenberg F, Rarey M, Kirchmair J (2017) High-Quality dataset of protein-bound ligand conformations and its application to benchmarking conformer ensemble generators. J Chem Inf Model 57:529–539
Hoyt CT, Zdrazil RB, Guha R, Jeliazkova N, Martinez-Mayorga K, Nittinger E (2023) Improving reproducibility and reusability in the Journal of Cheminformatics. J Cheminf 15:62
Download references
Acknowledgements
Not applicable.
European Research Council (Project DECIPHER; grant agreement ID: 948770).
Author information
Authors and affiliations.
Bioinformatics Group, Wageningen University & Research, Wageningen, the Netherlands
David Meijer, Marnix H. Medema & Justin J. J. van der Hooft
You can also search for this author in PubMed Google Scholar
Contributions
DM conducted research and wrote the code for CineMol and drafted the original manuscript. MHM and JJJvdH provided extensive feedback on the research process and the written manuscript.
Corresponding authors
Correspondence to David Meijer , Marnix H. Medema or Justin J. J. van der Hooft .
Ethics declarations
Competing interests.
JJJvdH is currently member of the Scientific Advisory Board of NAICONS Srl., Milano, Italy, and consults for Corteva Agriscience, Indianapolis, IN, USA. MHM is a member of the scientific advisory board of Hexagon Bio. The other author declares to have no competing interests.
Additional information
Publisher's note.
Springer Nature remains neutral with regard to jurisdictional claims in published maps and institutional affiliations.
Rights and permissions
Open Access This article is licensed under a Creative Commons Attribution 4.0 International License, which permits use, sharing, adaptation, distribution and reproduction in any medium or format, as long as you give appropriate credit to the original author(s) and the source, provide a link to the Creative Commons licence, and indicate if changes were made. The images or other third party material in this article are included in the article's Creative Commons licence, unless indicated otherwise in a credit line to the material. If material is not included in the article's Creative Commons licence and your intended use is not permitted by statutory regulation or exceeds the permitted use, you will need to obtain permission directly from the copyright holder. To view a copy of this licence, visit http://creativecommons.org/licenses/by/4.0/ . The Creative Commons Public Domain Dedication waiver ( http://creativecommons.org/publicdomain/zero/1.0/ ) applies to the data made available in this article, unless otherwise stated in a credit line to the data.
Reprints and permissions
About this article
Cite this article.
Meijer, D., Medema, M.H. & van der Hooft, J.J.J. CineMol: a programmatically accessible direct-to-SVG 3D small molecule drawer. J Cheminform 16 , 58 (2024). https://doi.org/10.1186/s13321-024-00851-y
Download citation
Received : 01 February 2024
Accepted : 08 May 2024
Published : 23 May 2024
DOI : https://doi.org/10.1186/s13321-024-00851-y
Share this article
Anyone you share the following link with will be able to read this content:
Sorry, a shareable link is not currently available for this article.
Provided by the Springer Nature SharedIt content-sharing initiative
- Scalable vector graphics
- Three-dimensional structure
- Molecular drawing
- Visualization
Journal of Cheminformatics
ISSN: 1758-2946
- Submission enquiries: [email protected]

Powerpoint Templates
Icon Bundle
Kpi Dashboard
Professional
Business Plans
Swot Analysis
Gantt Chart
Business Proposal
Marketing Plan
Project Management
Business Case
Business Model
Cyber Security
Business PPT
Digital Marketing
Digital Transformation
Human Resources
Product Management
Artificial Intelligence
Company Profile
Acknowledgement PPT
PPT Presentation
Reports Brochures
One Page Pitch
Interview PPT
All Categories

Business Model Powerpoint Presentation Slides
A good plan is a head start for the successful operation of a business, recognizing sources of interest, the expected customer base, products, and details of the investment. We are proud to present, business model PowerPoint presentation slides, for projecting your module in a precise manner. We have kept a comprehensive approach and incorporated fundamental concerns like how to monetize and acquire customers, providing service and types of business models. Business development model can be discussed through key operations, knowledge management, strategies, structure and operational competitive priorities. Business model archetypes are included here and can be explained with pie charts and mentoring the idle ecosystem. Further elaboration of business model bifurcation and other aspects have been included here too. Here at SlideTeam, we are continuously working on excellent ideas for conceiving superior results and walking ahead with the technology. So, download this magnificent template for the business model related dilemma and make your exhibitions a sight to look at. Download and get started right now.
- Add a user to your subscription for free
You must be logged in to download this presentation.
Do you want to remove this product from your favourites?
PowerPoint presentation slides
This PowerPoint template is a modern way to represent a business model for revenue model framework. Allowing professionals to alter, texts boxes, color schemes and icons for their personalization, this PPT bundle is compatible with google slides and is fit to be projected to a widescreen for PowerPoint presentations and business meets.

People who downloaded this PowerPoint presentation also viewed the following :
- Business Slides , Flat Designs , Complete Decks , All Decks , General
- Revenue Model ,
- Business model ,
- Revenue Model Framework
Content of this Powerpoint Presentation
Business model powerpoint presentation slides with all 33 slides:.
Augment your thoughts with our Business Model Powerpoint Presentation Slides. Add to the impact on your audience.

Ratings and Reviews
by Cleveland Foster
July 19, 2021
by Daryl Silva


IMAGES
VIDEO
COMMENTS
The votes are in and inevitably a majority of organizations will be shifting to some version of a hybrid working model in the latter part of 2021 / early 2022. In the rush to dust off office desks and prepare for a more collaborative, yet safe, working space, many leaders might be overlooking some of the crucial factors to make the transition ...
There are distinct parts of the agile working model. These include deciding when tasks should get done; finding new ways of completing goals; control over the work environment (office or home); and tailoring approaches for each task along the way: Time: when you work. Role: what you do. Location: where you work.
Create compelling presentations in less time. Exclusive access to over 200,000 completely editable slides. Download our easy-to-use Hybrid Working Framework PPT template to represent the importance of a hybrid working model. The deck is 100% editable and feature-rich.
The authors offer seven strategies for presenters and meeting leaders to more effectively engage everyone in their hybrid audience. We recently spoke to a CEO who was feeling anxious about public ...
Working Model And Methodology Of Chatgpt Ppt Slides Visuals. Slide 1 of 6. Blue brain working model of operation. Slide 1 of 2. Plan of action for business work plan services ppt powerpoint presentation model. Slide 1 of 3. 3d men standing around yellow bulb team work business model ppt graphic icon. Slide 1 of 6.
The presentation covers topics such as the advantages of hybrid working, how to create a hybrid working culture, and how to manage remote and office-based employees. It is an essential resource for any organization considering a hybrid working model.
This is a example of high performance work system model ppt presentation. This is a three stage process. The stages in this process are divers, core work, results, strategic, planning, customer and, market focus, workforce, focus, leadership, operations, focus, results, measurement analysis and knowledge management.
Features of these PowerPoint presentation slides: This slide represents the four ways to implement flexible working model in the organization. It includes four strategies for implementation of flexible working model such as create flexible work days policy, communicate clearly, flexibility is the key and review the process.Presenting our set of slides with Four Strategies To Implement Flexible ...
Browse and edit among the wide collection of working model presentation templates and Google slides. Toggle Nav. Search. Search. Search . 5. Notifications 5. See what the world is downloading for a kickass presentation. Check out our most popular products and get inspired. 21 hours ago. SlideGeeks added 1127 new products (e.g. Completely ...
Demonstrate the examples of industries that benefit from hybrid working and highlight the benefits, drawbacks, and challenges of this work plan. You can also explain how the hybrid model benefits both employees and employers by reducing commuting time, improving work-life balance, and increasing productivity and job satisfaction.
Create visually appealing presentations by attaching pictures The world's most popular CAE tool, Working Model is a conceptual design tool that allows you to create simulations that replace vague, time consuming, inaccurate "back of the envelope" calculations. Working Model has been adopted by thousands of professional engineers to create ...
Working Model makes sense ofh4 the math and lets you visualize and interact with otherwise difficult concepts. Move beyond a topic. Working Model allows you to explore physics on a more meaningful level than can be taught on paper or at the chalkboard. You can study what-if scenarios and create nearly any simulation imaginable.
Apply the 10-20-30 rule. Apply the 10-20-30 presentation rule and keep it short, sweet and impactful! Stick to ten slides, deliver your presentation within 20 minutes and use a 30-point font to ensure clarity and focus. Less is more, and your audience will thank you for it! 9. Implement the 5-5-5 rule. Simplicity is key.
Filed under Presentation Ideas • August 5th, 2023. How Parkinson's Law Can Make Your Presentations Better. Sometimes even the best presenters procrastinate their work until the very last moment. And then, suddenly, they get a flow of ideas to complete their slide deck and present like they have been preparing for it for ages.
We love them because they're the most visually appealing and memorable way to communicate. 1. Animated characters. Our first presentation example is a business explainer from Biteable that uses animated characters. The friendly and modern style makes this the perfect presentation for engaging your audience.
They can be used by professionals, business executives, or anyone looking to create a professional and visually appealing presentation for their work-related projects, meetings, or conferences. Download your presentation as a PowerPoint template or use it online as a Google Slides theme. 100% free, no registration or download limits.
So, download this stunning PPT today! An overview of the hybrid workplace environment has been given comprehensively for easy understanding. A creative diagram incorporated with eye-pleasing icons shows how a hybrid work model affects businesses. The hybrid workplace framework has been depicted through a flower-shaped diagram precisely.
Insert a 3D Model in PowerPoint. Open your presentation in PowerPoint and head to the slide where you want to add the model. Go to the Insert tab and click the drop-down arrow for 3D Models in the Illustrations section of the ribbon. Related: How to Draw and Edit a Freeform Shape in Microsoft PowerPoint. Choose either "This Device" to upload ...
Collaboration Teamwork Forecasting Budgeting PPT PowerPoint Presentation model Brochure-5 Download this Collaboration Teamwork Forecasting Budgeting PowerPoint Slide Show Display the significance of working collectively in a team taking the assistance of this teamwork forecasting budgeting PowerPoint model.
Do more with rubrics than ever imagined possible. iRubric VC4AB9: Students create a science model, and present their model. The model should be based on a scientific concept that is based on a topic of the student's choosing.. Free rubric builder and assessment tools.
How to enter the unlock code. Unlocking your Galaxy phone lets you use your device with a different provider and network. Disclaimer: When you purchase a Samsung phone from a carrier, your phone is locked to their network for a specified period of time according to the contract.
Get your hands on predesigned Working Model presentation templates and Google slides. Toggle Nav. Search. Search. Search . 5. Notifications 5. SlideTeam has published a new blog titled "Las 10 presentaciones más influyentes de Elon Musk". You can view it here. 12 hours ago. SlideTeam has published a new blog titled "Elon Musks Top 10 der ...
Effective visualization of small molecules is paramount in conveying concepts and results in cheminformatics. Scalable vector graphics (SVG) are preferred for creating such visualizations, as SVGs can be easily altered in post-production and exported to other formats. A wide spectrum of software applications already exist that can visualize molecules, and customize these visualizations, in ...
Slide 1: This slide introduces a Business Model.State your company and get started. Slide 2: This slide showcases business model which explain you the steps about the business process. Slide 3: This slide shows Business model which includes four basic stages or steps. Slide 4: This slide showcases Business model canvas and also various functions working such as customer relationship, key ...