
What Does a Data Researcher Do?
Find out what a Data Researcher does, how to get this job, salary information, and what it takes to succeed as a Data Researcher.

The Data Researcher plays an integral role in gathering, analyzing, and interpreting information to help companies make informed decisions. This position involves sifting through vast amounts of data to identify trends, patterns, and insights that can influence strategic planning and operational efficiency. By employing a variety of tools and methodologies, the Data Researcher contributes to the development of a knowledge base that supports business objectives across different departments. Their work enables organizations to better understand their market, optimize processes, and anticipate future trends, ensuring that data-driven decisions pave the way for innovation and growth.
Data Researcher Job Duties
- Collect and compile data from various primary and secondary sources, ensuring accuracy and relevance to research objectives.
- Design and implement data collection tools, such as surveys and questionnaires, tailored to specific research needs.
- Perform statistical analysis of collected data using software tools like SPSS, R, or Python to identify trends, correlations, and patterns.
- Develop and maintain databases for storing research data, ensuring data integrity, security, and accessibility.
- Write comprehensive research reports that summarize findings, methodologies, and statistical analyses, making recommendations based on data insights.
- Collaborate with cross-functional teams, including data scientists, analysts, and subject matter experts, to refine research questions and methodologies.
- Present research findings to stakeholders through presentations, visualizations, and dashboards, translating complex data into understandable insights.
- Evaluate and integrate new data sources and research tools into existing workflows to enhance data quality and research outcomes.
Data Researcher Salary & Outlook
Salaries for Data Researchers vary based on factors such as industry (tech, finance, healthcare), company size, years of experience, and expertise in specific data analysis tools (e.g., Python, R, SQL). Specialization in high-demand areas like machine learning or big data analytics can also significantly impact earnings.
- Median Annual Salary: $69,825 ($33.57/hour)
- Top 10% Annual Salary: $155,700 ($74.86/hour)
The employment of data researchers is expected to grow much faster than average over the next decade.
This surge is driven by the exponential increase in data generation and the need for sophisticated analysis to derive actionable insights across industries, including healthcare, finance, and technology. Data Researchers are crucial for harnessing this data for predictive analytics, enhancing decision-making, and creating competitive advantages.
Data Researcher Job Requirements
Education: A Data Researcher typically holds a Bachelor’s, Master’s, or Doctoral Degree in fields such as Data Science, Statistics, Computer Science, or a related area. Coursework often includes statistics, programming, data analysis, and machine learning. Advanced degrees may focus on specialized research methods, big data analytics, and project management. Academic projects and internships complement formal education, providing practical experience in data collection, analysis, and interpretation.
Experience: Data Researchers typically come with a blend of on-the-job experience and participation in specialized training programs. Ideal candidates have a solid background in data analysis, research methodologies, and are adept at using various data research tools. Experience in specific industries can be beneficial, depending on the research focus. Continuous professional development through workshops and courses is common, ensuring they stay updated with the latest data research techniques and technologies. Hands-on experience, coupled with ongoing training, shapes their ability to deliver insightful data-driven outcomes.
Certifications & Licenses: Certifications and licenses are not typically required for the role of a Data Researcher.
Data Researcher Skills
Statistical Analysis: Advanced statistical methods are employed by data researchers to identify patterns, trends, and correlations within complex datasets. These techniques facilitate the translation of raw data into actionable insights, which are instrumental in guiding decision-making and predicting future outcomes across various industries.
Data Mining: Researchers extract patterns and knowledge from large datasets using techniques like clustering, classification, and association analysis. This skill, which combines statistical, computational, and analytical abilities, is pivotal in uncovering hidden insights that drive strategic business decisions.
Machine Learning: By leveraging algorithms and statistical models, data researchers can predict outcomes and inform strategic decisions. This area requires a combination of programming expertise, statistical knowledge, and an understanding of complex data patterns for effective interpretation and communication of findings.
Data Visualization: The creation of compelling visual representations of complex datasets allows stakeholders to quickly understand intricate patterns, trends, and insights, aiding in informed decision-making. A keen eye for design and proficiency in visualization tools and software are necessary to make data accessible and engaging for diverse audiences.
Survey Design: A meticulous blend of psychological insight and statistical acumen is required to craft questions that accurately capture respondent experiences and perceptions. This skill is crucial for transforming subjective feedback into quantifiable trends, providing meaningful insights from raw data.
Database Management: The organization, storage, and retrieval of large data sets are streamlined through sophisticated software tools, ensuring data integrity, security, and accessibility. This capability is essential for conducting thorough analyses and deriving actionable insights, supporting the seamless flow of information for research purposes.
Data Researcher Work Environment
A Data Researcher typically operates in a modern office setting, often with the option for remote work, reflecting the digital nature of their role. Their workspace is usually equipped with dual monitors, ergonomic seating, and quiet zones to facilitate concentration on complex data analysis tasks. The use of advanced statistical software and database tools is commonplace, necessitating a high level of proficiency in technology.
Work hours can be flexible, accommodating project deadlines rather than a strict nine-to-five schedule. This flexibility supports a healthy work-life balance, allowing for adjustments as needed. Dress codes tend to be business casual, leaning towards comfort and practicality.
The culture within data research teams emphasizes collaboration and continuous learning, with opportunities for professional development through workshops and conferences. Interaction with colleagues, both in person and virtually, is frequent for project discussions, though the job also requires significant independent work. The environment is generally low in noise, prioritizing a focused atmosphere conducive to detailed analysis.
Advancement Prospects
Data Researchers have a plethora of advancement options, ranging from specialized roles like Data Analysts to leadership positions such as Chief Data Officer (CDO). Progressing typically involves deepening expertise in data modeling, statistical analysis, and machine learning.
To climb the ladder, mastering industry-specific data tools and programming languages (e.g., Python, R) is crucial. Gaining experience in big data technologies like Hadoop or Spark can also set a foundation for roles in data architecture or engineering.
For those inclined towards leadership, developing project management skills and an understanding of business strategy are essential. This can lead to positions where one oversees data governance, strategy, and analytics teams.
Engagement in significant projects and contributions to data-driven decision-making processes can highlight a Data Researcher’s potential for higher responsibilities. Showcasing the ability to translate complex data insights into actionable business strategies is key to advancing in this field.
What Does a Phlebotomy Supervisor Do?
What does a referral specialist do, you may also be interested in..., 16 commercial manager skills for your career and resume, what does a resident manager do, what does an operational excellence manager do, what does an assistant event manager do.
- Certificate in Applied Data Science
- What is Cybersecurity?
- MICS Class Profile
- What Is Data Science?
- Careers in Data Science
- MIDS Class Profile
- Study Applied Statistics
- International Admissions
- Fellowships
- Student Profiles
- Alumni Profiles
- Video Library
- Apply Now External link: open_in_new
Home / Data Science / What Is Data Science?
What is Data Science?
Data science continues to evolve as one of the most promising and in-demand career paths for skilled professionals. Today, successful data professionals understand they must advance past the traditional skills of analyzing large amounts of data, data mining, and programming skills. To uncover useful intelligence for their organizations, data scientists must master the full spectrum of the data science life cycle and possess a level of flexibility and understanding to maximize returns at each phase of the process.
The Data Science Life Cycle
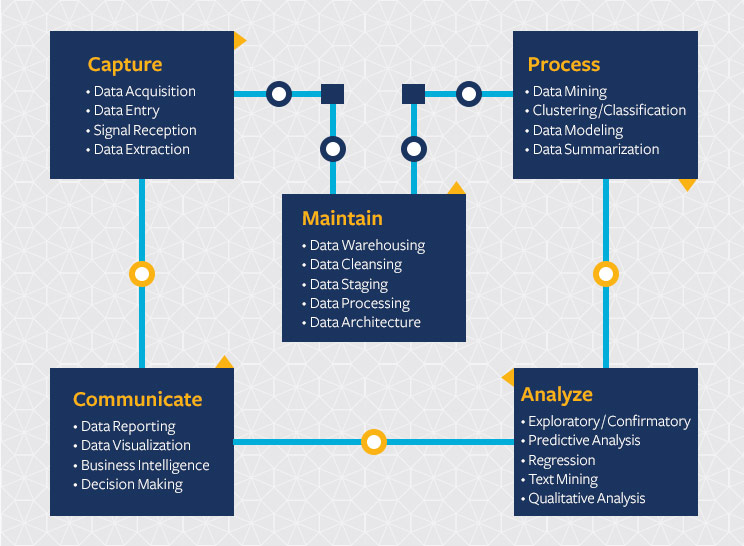
The term “data scientist” was coined when companies first realized the need for data professionals skilled in organizing and analyzing massive amounts of data. Ten years after the widespread business adoption of the internet, Hal Varian, Google’s chief economist, first dean of the UC Berkeley School of Information (I School), and UC Berkeley emeritus professor of information sciences, business, and economics, predicted the importance of adapting to technology’s influence and reconfiguration of different industries.
“The ability to take data — to be able to understand it, to process it, to extract value from it, to visualize it, to communicate it — that’s going to be a hugely important skill in the next decades.”
– Hal Varian, chief economist at Google and UC Berkeley professor of information sciences, business, and economics 1
Today, effective data scientists masterfully identify relevant questions, collect data from a multitude of different data sources, organize the information, translate results into solutions, and communicate their findings in a way that positively affects business decisions. These skills are now required in almost all industries, which means data scientists have become increasingly valuable to companies.
Develop Specialized Data Science Skills Online
Get your master’s in information and data science and earn a certificate from the UC Berkeley School of Information (I School).
What Does a Data Scientist Do?
Data scientists have become assets across the globe and are present in almost all organizations. These professionals are well-rounded, analytical individuals with high-level technical skills who can build complex quantitative algorithms to organize and synthesize large amounts of information used to answer questions and drive strategy in their organizations. They also have the communication and leadership experience to deliver tangible results to various stakeholders across an organization or business.
Data scientists are typically curious and result-oriented, with exceptional industry-specific knowledge and communication skills that allow them to explain highly technical results to their non-technical counterparts. They possess a strong quantitative background in statistics and linear algebra as well as programming knowledge with focuses in data warehousing, mining, and modeling to build and analyze algorithms.
They also use key technical tools and skills, including:
Apache Hadoop
Apache Spark
NoSQL databases
Cloud computing
iPython notebooks
Why Become a Data Scientist?
As increasing amounts of data become more accessible, large tech companies are no longer the only ones in need of data scientists. There’s now a demand for qualified data science professionals across organizations, big and small.
With the power to shape decisions, solve real-world challenges, and make a meaningful impact in diverse sectors, data science professionals have the opportunity to pursue various career paths.
Work from the comfort of your home
Gain new skills as data uses continue to grow
Request More Information
Where do you fit in data science.
Data is everywhere and expansive. Various terms related to mining, cleaning, analyzing, and interpreting data are often used interchangeably, but the roles typically involve different skill sets. The complexity of the data analyzed also differs.
Data Scientist
Data scientists examine which questions need answering and where to find the related data. They have business acumen and analytical skills as well as the ability to mine, clean, and present data. Businesses use data scientists to source, manage, and analyze large amounts of unstructured data. Data scientists also leverage machine learning techniques to model information and interpret results effectively, a skill that differentiates them from data analysts. Results are then synthesized and communicated to key stakeholders to drive strategic decision making in the organization.
Skills needed: Programming skills (SAS, R, Python), statistical and mathematical skills, storytelling and data visualization, Hadoop, SQL, machine learning
Data Analyst
Data analysts bridge the gap between data scientists and business analysts. They’re provided with the questions that need answering from an organization and then organize and analyze data to find results that align with high-level business strategy. Data analysts are responsible for translating technical analysis to qualitative action items and effectively communicating their findings to diverse stakeholders.
Skills needed: Programming skills (SAS, R, Python), statistical and mathematical skills, data wrangling, data visualization
Data Engineer
Data engineers manage exponentially growing and rapidly changing data. They focus on developing, deploying, managing, and optimizing data pipelines and infrastructure to transform and transfer data to data scientists and data analysts for querying.
Skills needed: Programming languages (Java, Scala), NoSQL databases (MongoDB, Cassandra DB), frameworks (Apache Hadoop)
Data Science Career Outlook and Salary Opportunities
Data science professionals are rewarded for their highly technical skill set with competitive salaries and great job opportunities at big and small companies in most industries. Data science professionals with the appropriate experience and education have the opportunity to make their mark in some of the most forward-thinking companies in the world.
Gaining specialized skills within the data science field can distinguish data scientists even further. For example, machine learning experts use high-level programming skills to create algorithms that continuously gather data and adjust their learning to improve prediction performance.
Learn how a Master of Information and Data Science from UC Berkeley can prepare you for a successful career in data science.
1 Hal Varian on How the Web Challenges Managers . (2009). Mckinsey . Retrieved December 2023. arrow_upward
Resume Builder
- Resume Experts
- Search Jobs
- Search for Talent
- Employer Branding
- Outplacement
Data Researcher Job Description
Data researcher duties & responsibilities.
To write an effective data researcher job description, begin by listing detailed duties, responsibilities and expectations. We have included data researcher job description templates that you can modify and use.
Sample responsibilities for this position include:
Data Researcher Qualifications
Qualifications for a job description may include education, certification, and experience.
Licensing or Certifications for Data Researcher
List any licenses or certifications required by the position: AAPCA, AHIMA, PPBC
Education for Data Researcher
Typically a job would require a certain level of education.
Employers hiring for the data researcher job most commonly would prefer for their future employee to have a relevant degree such as Bachelor's and Master's Degree in Computer Science, Economics, Statistics, Business, Mathematics, Finance, Communication, Graduate, Physics, Education
Skills for Data Researcher
Desired skills for data researcher include:
Desired experience for data researcher includes:
Data Researcher Examples
- Microsoft Word (.docx) .DOCX
- PDF Document (.pdf) .PDF
- Image File (.png) .PNG
- Perform primary and secondary health plan research, including extensive communication with payers via telephone
- Collaboration with team for plan changes and formulary updates
- Work with other departments on the facilitation of different data sets
- Support sales in the delivery of data, reports, and ad hoc research assignments
- Desktop and telephone research for aircraft and company profile information
- Work with HPC facility operators and application scientists running computations at the Berkeley Lab to understand and analyze available data sources and necessary analyses
- Collect, manipulate, and analyze data related to security and HPC systems-behavior related research questions in scientific computing environments
- Write scientific research papers suitable for submission to peer-reviewed computer science venues
- Enable science by helping to create better understanding of the computational behavior of software running on HPC systems, allowing scientists to understand and use computing systems more efficiently
- Work closely with researchers and application scientists throughout the DOE Office of Science community, with faculty and students from universities throughout the world, with staff in Integrated Data Frameworks group at LBNL, where this position is housed
- Publications in top tier conferences /journals
- Demonstrated ability to work on applied research problems in interdisciplinary environments
- Proven hands on technical skills including an analytical package (R, Matlab, SAS, Weka) big data processing tools (Hadoop, Java)
- Ability to work with a team with proven verbal and written communications and organizational skills
- Basic knowledge in information retrieval, data mining, machine learning, statistical analysis and modeling
- This is one year contract position to start beginning of 2016
- Create and implement algorithms for predictive modeling, graph analysis and text mining
- Deliver reliable, readable and maintainable code
- Work with team to develop innovative approaches for data analysis, machine learning, data mining and natural language processing
- Manage small R&D projects and drive innovation and hacking
- Responsible for project architecture and survey design based on analyst objectives, hypotheses, usage intentions, and serving client needs that the research will address
- Analyze and interpret primary research data
- Support written research attributed to study findings
- Provides advice on data interpretation to ensure usage is accurate and defensible
- Under supervision, performs tasks in support of the process for ancillary services
- Track the key industry metrics reported by the power plants, energy companies, coal mines, and gas pipelines that we cover
- Deep knowledge of information retrieval, data mining, machine learning, statistical analysis and modeling
- 2 years proven search experience in a search firm, start-up or corporate environment
- Specific expertise in manufacturing, engineering, supply chain, and operations searches preferred
- Great software system and organizational skills, utilizing data systems-oriented research
- ATS/RTS experience with sourcing, tracking, and managing of leads and candidate flow
- Proficiency in passive candidate sourcing methods, including social media, boolean, and internet research
- Accurately enter all publisher information onto the company data base
- Contact publishers for delivery information either by telephone, email, fax or post
- Send orders to the publishers via various methods, including EDI, email and post
- Source publishers and titles from the internet and data bases
- Maintain system information
- Verify information received and offer alternate solutions for customers
- Ability to understand and retain high volumes of different procedures
- Contribute to effective team working both internal and external
- Develop and maintain excellent working relationships with all internal departments and teams
- Ensure that all relevant company and departmental Health, Safety and Environmental policies and procedures are adhered to at all times
- Ability to work in a team environment, manage multiple projects and provide strong consultative skills throughout the search process
- Working knowledge of various social media and analytics tools (such as Radian6, Talkwalker and the like, the ability to learn proprietary tools)
- Je behaalde recent je Master met een sterke focus op statistiek
- Een eerste onderzoekservaring is een plus
- Je hebt een basiskennis van R en interesse om je hierin verder te verdiepen
- Je bent vertrouwd met survey methodologie en multivariate statistiek
- Contact publishers and update the database with new edition information
- Place orders for new editions when due
- Respond to queries & claims via email & phone
- Ensure accurate records are regularly maintained using IT and manual systems, as
- Take ownership and carry out analysis to resolve outstanding coding queries where standard approaches have failed
- To implement initiatives that will positively impact the quality of the data that we supply to clients
- To ensure that the success of the initiatives are quantified through metrics published on a weekly basis
- Ensure that all queries are handled efficiently and effectively
- Build and maintain a good working relationship with internal stakeholders
- Create & maintain a high level of product knowledge – awareness of changes in the market and new product launches for key manufacturers
- The incumbent will proactively identify and utilize the most current resources and technology available to evaluate our donor pool and analyze and track trends
- Proven ability to create and maintain strategic recruiting plans with clearly defined objectives, desired outcomes, and a calendar of events
- Je hebt een sterke interesse voor data science in een marktonderzoeksomgeving
- Nieuwsgierig en bereid om steeds bij te leren
- Je haalt jouw energie uit complexe uitdagingen
- Experience in data mining (cluster analysis, text mining, time series analysis)
- We expect you to providing input and ideas for new collection methods and product improvements related to the covered content sets
- Understand the data management process and work effectively within it
- Build a knowledge base for products across manufacturers and retailers to enable the coding functions to code more effectively and to prevent partially coded items
- Work closely with other Operational departments regarding improving data quality of existing retailer data
- Where required contact manufacturers or make retailer store visits to source missing product information
- Work in Madrid and then travel within Spain (Barcelona and Malaga – subject to change) with the team to set up data collection projects in field locations
- Work one-on-one with participants to ensure project objectives are met
- Be accountable for specific processes including securing testing materials, handling logistics, troubleshooting technical or process issues and providing daily report
- Work closely with team to follow protocol and continually refine participant experience
- Be a quick learner and grasp complex project details and own specific aspects of the project
- Degree in Computer Science, Cognitive Science, Artificial Intelligence, Cognitive Psychology, Information Science, Neuroscience, Psychology, Neurology, or related discipline with a focus on design, development, application, and evaluation of machine learning and advanced data collection, statistics and analysis methods
- 5-7 years of experience in a healthcare analysis capacity, with healthcare data is required
- Ability to query large data sets in either Access or SAS
- Superior communication skills on technical subjects
- PhD in Computer Science, Physics and/or Industrial Engineering, with research/publication track record, or MS in Computer Science, Physics, and/or Industrial Engineering or with 3 or more years of industry related experience
- Creativity, initiative, enthusiasm, and results orientation to drive your inventions towards new products and services
Related Job Descriptions
Create a Resume in Minutes with Professional Resume Templates
I am an Employer
I am a candidate.

Data Researcher Job Description, Key Duties and Responsibilities

This post discusses the job description of a data researcher to help you understand what they do. It presents the key duties, tasks, and responsibilities that commonly make up the data researcher work description in most organizations.
This post also provides the major requirements most recruiters will want prospective candidates for the data researcher job to meet to be qualified to access the position.
Please, continue reading to increase your knowledge of the data researcher career:
What Does a Data Researcher Do?
The data researcher is responsible for the research and management of data relevant to an organization, ensuring quality, completeness, and integrity, to enhance day-to-day operations and improved accuracy and efficiency in data processes, or to aid decision-making.
They work for educational institutions, technology companies, institutes for research, etc.
They are responsible for the design, collection, analysis and review of research and evaluation data, as well as the dissemination of statistics that are objective, accurate, and timely.
The data researcher job description also entails developing spreadsheets and data bases to support project activities, and providing quantitative and qualitative analysis and interpretation of findings to aid decision making.
It also involves working with large amounts of data and developing actionable intelligence from the analysis.
Data researchers also provide support to the sales team and the sales process by developing analyses for sales pitches and press releases.
They are also responsible for carrying out ad hoc analyses in response to client requests. They also help to identify new opportunities for market research; performing analysis and developing data-driven models.
The data researcher work description also involves developing and applying statistical models for estimation and prediction of corporate performance across various sectors.
Data Researcher Job Description Example/Sample/Template
Data researchers perform various functions, which primarily involve researching and identifying entities (companies, brands, people, etc.), beliefs, systems, processes, events etc., and actions related to them from different content sources, and processing collected data in an accurate manner using technical knowledge.
They are also responsible for the quality, accuracy, and completeness of the data.
The primary duties, tasks, and responsibilities that make up the data researcher job description are listed below:
- Responsible for modeling information from the media using internally developed tools
- Take part in product planning meetings and provide statistical backed guidance on product development
- Work collaboratively with the Data Strategy team where applicable, to develop an engagement plan for researchers
- Make addition to the development of training materials and strategies related to the organization’s projects
- Work together with other researchers to collect, process, and understand data that can facilitate clients’ decisions
- Responsible for the design, validation, and visualization of data-driven models, including machine learning approaches, to understand social and behavioral phenomena in support of the institution’s mission
- Responsible for collecting and analyzing text and other data from websites and other sources using APIs and custom code
- Responsible for creating structured datasets from large, unstructured data that describe people, activities, and behavior; social networks, communication, and other social phenomena of interest
- Work together with experts to pioneer new approaches to research by integrating diverse data sources
- Responsible for analyzing and interpreting experimental data
- Responsible for communicating findings to project teams and other technical and non-technical stakeholders.
Data Researcher Job Description for Resume
You can use the sample data researcher job description above in making the professional or job experience section of your resume.
If you have worked before as a data researcher or are presently working in that role and are preparing a resume for a new job, it will be beneficial to add the professional experience section to your resume.
This section helps you show the recruiter that you have been successful performing the duties of a data researcher.
You can easily and quickly create this section by adopting the data researcher duties and responsibilities shown in the sample job description above.
Data Researcher Requirements – Skills, Knowledge, and Abilities for Career Success
If you are seeking to work as a data researcher, recruiters will generally ask you to meet certain requirements to be qualified to access the position.
This is to prove that you will be effective in carrying out the obligations, purpose, and objectives of the data researcher role if employed by the organization.
Shown below are major requirements, which applicants for the data researcher position are commonly expected to meet to be able to access it:
- Education: Employers require at least a Bachelor’s degree in Accounting, Finance, or Economics; Mathematics, Statistics, or Computer Science; Operations Research or in a related field. However, an MS, PhD, or other advanced graduate degree is preferred
- Knowledge: To work as a data researcher, applicants must possess an understanding of the industry they are seeking to work in. In addition to industry knowledge, employers also look out for candidates with hands-on experience compiling and analyzing complex, high volume, and dimensional datasets
- Employers also require a solid and proven knowledge of research methodologies, web and social media applications, and familiarity with web searching tools to source information
- It is also beneficial that applicants have a working knowledge of SQL, R, or Perl; Python, Java, or other languages appropriate for large scale data analysis, as well as experience working with relational and/or NoSQL databases (e.g., MySQL, HBase, Cassandra, Neo4J, etc.)
- Collaborative skills: The data researcher often works with other researchers, sales teams, and product teams to understand the project at hand and provide relevant information. So it is crucial that they have the ability to work in a team-oriented environment, as well as with people from diverse backgrounds
- Interpersonal skills: It is also essential that they have the necessary skills to build rapport, establish meaningful relationships, manage, and build a team
- Computer skills: Data researchers utilize the computer as a primary tool; hence, they must be proficient in the use of Microsoft Office applications, including Excel, PowerPoint, and Word. They must also be familiar with Google Documents, data visualization software (e.g., plot.ly or Tableau), and statistical analysis software applications
- Attention to detail: The data researcher is responsible for the accuracy, quality, and integrity of data. Therefore, it is crucial that they pay attention to detail and have a drive for excellence
- Communication skills: After performing data analysis, it s the responsibility of the data researcher to convey and explain findings to varying audiences with a technical or non-technical background. In view of this, it is important that they can draft clear and concise documentation, reports, and specifications, as well as communicate verbally to the relevant parties.
If you are a recruiter or HR manager needing to hire for the data researcher position in your organization, you will need to make a description of the vacant role so that individuals who are interested in the job will know the duties and responsibilities they will be assigned to perform if hired.
The data researcher job description example above will help you in writing the perfect description of the role for your organization.
The information on this page is also helpful to individuals interested in the data researcher career to learn about the kind of duties commonly assigned to the role. This will enable them to decide correctly if it’s the career they will like to pursue.
Did this post increase your knowledge of what data researchers do? Please, make a comment in the box below. You may also share your job description if you work as a data researcher .
Recommended:

This Site Uses Cookies
Privacy overview.
Data Analyst
- Certifications
- Related Topics

What Is a Data Analyst? How to Become One, Salary, Skills.
Data analysts solve measurable business problems with the help of computer programming and data analytics practices. Here’s what to know about a data analyst’s needed skills, salary and how to become one.
What Is a Data Analyst?
Data analysts conduct statistical analysis on structured data to uncover relevant business conclusions. They primarily focus on converting tangible, readily available data into actionable insights and answers.
What Do Data Analysts Do?
Data analysts acquire and organize cleaned data to search for applicable patterns and trends. They utilize data analysis techniques, programming languages and data visualization tools to conduct analysis and display their findings. Unlike data scientists , data analysts usually don’t work with raw data or machine learning models and don’t conduct largely hypothetical analysis.
Data Analyst Responsibilities
- Gather, reorganize and clean data as necessary from primary and secondary sources.
- Analyze and interpret patterns and trends in structured data sets.
- Extract actionable business insights and present findings to other professionals.
- Communicate with various parties to identify data information needs.
Day-to-Day Responsibilities of Data Analysts
- Use analytics platforms like KNIME to aggregate and clean collected data.
- Use programming languages like Python to manage data structures and conduct data mining operations.
- Create conclusion charts and graphs with visualization tools like Tableau.
- Collaborate with software developers to optimize data collection and analysis systems.
Data Analysts Within a Company
Data analysts are usually part of a data science team within a company. They frequently collaborate with business intelligence analysts , data engineers , data scientists and software developers to accomplish their work.
Importance of Data Analysts
The insights that data analysts uncover through their work can be used to alleviate workflow roadblocks or to eventually make impactful business decisions. Specific business problems or optimization issues that relate to data may take longer to solve without data analysts.
What Skills Are Needed to Be a Data Analyst?
Qualifications to be a data analyst.
- Internship and/or on-the-job training experience in data science or data analytics.
- Ability to organize, clean and interpret large sets of data.
- Ability to conduct statistical and regression analysis to track and identify trends.
- Proficiency in Python or R for data analysis purposes.
Data Analyst Prerequisites
- Bachelor’s degree in computer science, information systems, statistics or a similar field.
Data Analyst Hard Skills
- Expertise in data analysis, cleaning and preparation.
- Knowledge of big data tools and databases.
- Knowledge of cloud computing technologies.
- Experience with data analysis tools and techniques.
- Experience with data visualization tools.
- Knowledge of machine learning technologies.
- Expertise in programming languages (Java, Python, R, Scala, SQL)
- Experience with statistics, mathematics and related analysis.
Data Analyst Soft Skills
- Collaboration.
- Critical thinking skills.
- Problem-solving skills.
- Verbal and written communication skills.
Tools and Programs Data Analysts Use
- Google Sheets
- Jupyter Notebook
- Microsoft Excel
- Microsoft Power BI
How to Become a Data Analyst
Data analyst education and experience.
Data analyst candidates are often expected to have a bachelor’s degree in computer science, information systems, statistics or a similar field.
Candidates will often need to obtain applicable data science or analytics experience through an internship, on-the-job training and/or work experience. Knowledge in the areas of data analysis and tools, data visualization, programming languages (Java, Python, R, Scala, SQL), statistics, big data and effective communication are also recommended.
Data Analyst Certificates and Courses
- 21 Python Data Science Courses and Bootcamps to Know
- Data Analytics Accelerator
- Data Analytics Bootcamp
- Intro to Data Analytics Webinar
- Learning Python for Data Analysis and Visualization
Data Analyst Career Path
After gaining experience as a data analyst, professionals can move into a data scientist, data analytics consultant or specialist role like marketing analyst, operations analyst or systems analyst. From here, professionals may progress into management and leadership roles like senior data analyst, analytics manager, director of analytics or chief data officer.
Data Analyst Salary and Job Outlook
Data analysts jobs, falling under the category of operations research analyst jobs by the U.S. Bureau of Labor Statistics, are projected to grow 23 percent by 2031.
The full compensation package for a data analyst depends on a variety of factors, including but not limited to the candidate’s experience and geographic location. See below for detailed information on the average data analyst salary.
Expand Your Data Analyst Career Opportunities
Invest in your skillset by taking expert-led data science courses from Udemy.

Regardless of your industry or role, fluency in the language of data analytics will allow you to contribute to data driven decision making.
Hello and welcome to the course Product Management: Business KPIs & User Metrics analysis.
In this course, you will learn
#1 - How to look at user metrics & business KPIs
PREDICTIVE, PRESCRIPTIVE ANALYTICS FOR BUSINESS DECISION MAKING
LEARN HOW TO BUILD PREDICTIVE AND PRESCRIPTIVE MODELS USING NUMERICAL DATA
Prescriptive analytics can cut through the clutter of…
Hello, My name is Minerva Singh and I am an Oxford University MPhil (Geography and Environment) graduate. I recently finished a PhD at Cambridge University (Tropical Ecology and Conservation).
I have several…
Data Analyst Certifications + Programs
Give your resume a boost with in-demand data science certifications available from Udacity.

Whether you have coded before or are brand new to the world of programming, this course will put you on the fast track to building confidence with this intuitive, object- oriented language. Learn programming fundamentals and build a custom application. Graduate with the ability to start applying Python within high-growth fields like analytics, data science, and web development.
What you'll accomplish
This is a beginner-friendly program with no prerequisites, although some students may have coded previously. First-time programmers will have access to pre-course preparatory lessons and additional resources to boost their confidence with key concepts and set up their development environments. Throughout this expert-designed program, you’ll:
- Learn object-oriented programming fundamentals and Python basics that get you coding from day one.
- Build a Python program and add on increased complexity throughout the course.
- Troubleshoot Python code and practice common debugging techniques.
- Push your skills to the next level by adding scripting, modules, and APIs to your Python toolkit.
- Explore introductory data science and web development as potential career directions for Python programmers.
- Demonstrate your Python skills by creating apps that pull in data with Pandas or integrate functionality from APIs with Flask.
Why General Assembly
Since 2011, General Assembly has graduated more than 40,000 students worldwide from the full time & part time courses. During the 2020 hiring shutdown, GA's students, instructors, and career coaches never lost focus, and the KPMG-validated numbers in their Outcomes report reflect it. *For students who graduated in 2020 — the peak of the pandemic — 74.4% of those who participated in GA's full-time Career Services program landed jobs within six months of graduation. General Assembly is proud of their grads + teams' relentless dedication and to see those numbers rising. Download the report here .
Your next step? Submit an application to talk to the General Assembly Admissions team
Note: reviews are referenced from Career Karma - https://careerkarma.com/schools/general-assembly

General Assembly’s Data Analytics Immersive is designed for you to harness Excel, SQL, and Tableau to tell compelling stories with a data driven strategy. This program was created for analysts, digital marketers, sales managers, product managers, and data novices looking to learn the essentials of data analysis.
You will learn to use industry tools, Excel, and SQL to analyze large real world data sets and create data dashboards and visualizations to share your findings. The Data Analytics Accelerator culminates in a.
Throughout this expert-designed program, you’ll:
- Use Excel, SQL, and Tableau to collect, clean, and analyze large data sets.
- Present data-driven insights to key stakeholders using data visualization and dashboards.
- Tell compelling stories with your data.
- Graduate with a professional portfolio of projects that includes a capstone project applying rigorous data analysis techniques to solve a real-world problem

General Assembly’s Data Analytics Immersive is a transformative course designed for you to get the necessary skills for a data analyst role in three months.
The Data Analytics bootcamp is led by instructors who are expert practitioners in their field, supported by career coaches that work with you since day one and enhanced by a career services team that is constantly in talks with employers about their tech hiring needs.
As a graduate, you’ll have a portfolio of projects that show your knowledge of data analytics skills, as well as experience with visualization tools and frameworks that employers demand. Throughout this expert-designed program, you’ll:
- Acquire, analyze, and visualize data sets in real time.
- Master industry-standard tools like SQL, Excel, Tableau, PowerBI, and Python.
- Turn data into stories that can influence and inform important decisions.
- Ask the right questions and answer them with data-informed insights.
- Demonstrate what you’ve learned with a solid professional portfolio.
Note: reviews are referenced from Career Karma - https://careerkarma.com/schools/general-assembl
Careers Related to Data Analyst
Data analyst jobs, companies hiring data analysts, most common skills for data analyst, related data science careers.

30 Data Researcher Interview Questions and Answers
Common Data Researcher interview questions, how to answer them, and example answers from a certified career coach.

In today’s data-driven world, the role of a Data Researcher has become increasingly vital for organizations seeking to make informed decisions and gain valuable insights. Your meticulous approach to collecting, analyzing, and interpreting data has brought you this far in your career journey – but now it’s time to impress potential employers during the interview process.
To help you confidently navigate through your upcoming interview, we’ve compiled a list of common Data Researcher interview questions that will showcase your expertise and problem-solving skills. Along with these questions, we’ll provide guidance on how to answer them effectively, ensuring you stand out as a top candidate in this competitive field.
1. What experience do you have in data collection and analysis?
Hiring managers want to gauge your ability to navigate the world of data, from gathering raw information to drawing actionable insights. Your experience in data collection and analysis will demonstrate your ability to tackle complex challenges, use various tools and methodologies, and ultimately contribute to the company’s decision-making process and strategic planning. The more proficient you are in these areas, the more valuable you become as a data researcher.
Example: “During my time as a research assistant at XYZ University, I was responsible for collecting and analyzing data for various projects. One of the most significant projects involved conducting surveys to assess student satisfaction with campus facilities. I designed questionnaires, distributed them both online and in-person, and collected responses from over 1,000 students.
After gathering the data, I used statistical software like SPSS and Excel to clean, organize, and analyze it. Through descriptive statistics and regression analysis, I identified trends and correlations that helped inform recommendations for facility improvements. My findings were presented to university administrators, who implemented several changes based on our insights. This experience not only honed my skills in data collection and analysis but also demonstrated the real-world impact that well-executed research can have on decision-making processes.”
2. Can you describe a project where you had to collect, clean, and analyze large datasets?
Diving into the nitty-gritty of data is at the core of a data researcher’s job. By asking about a specific project, interviewers want to gauge your hands-on experience and expertise in handling large datasets, as well as your ability to identify and fix data inconsistencies. This question also helps them understand your thought process, problem-solving skills, and how you approach complex tasks that are critical to the role.
Example: “During my previous role as a data researcher, I was assigned to a project that aimed to identify trends and patterns in customer behavior for an e-commerce company. The dataset provided consisted of millions of transaction records spanning over two years, which included information on customer demographics, purchase history, and browsing behavior.
The first step involved cleaning the data by identifying and addressing missing values, inconsistencies, and duplicate entries. This process required close attention to detail and the use of various data cleansing techniques, such as imputation and outlier detection. Once the data was cleaned, I used Python libraries like Pandas and NumPy to manipulate and analyze the dataset efficiently.
Through my analysis, I was able to uncover valuable insights into customer preferences, seasonal trends, and potential areas for improvement in the company’s marketing strategy. These findings were then presented to the management team, who utilized the information to make informed decisions about future campaigns and promotions. Ultimately, this project not only honed my skills in handling large datasets but also demonstrated the value of data-driven decision-making in achieving business goals.”
3. Which programming languages are you proficient in for data manipulation and analysis?
As a data researcher, your potential employer wants to ensure you possess the technical skills necessary to work with large datasets and extract valuable insights from them. Proficiency in programming languages such as Python, R, and SQL is essential for tasks like data cleaning, transformation, and analysis. By asking this question, the interviewer is assessing your ability to effectively use these languages to support the company’s research goals and data-driven decision making.
Example: “I am proficient in Python and R for data manipulation and analysis. In my previous role as a data researcher, I primarily used Python along with libraries such as Pandas, NumPy, and Matplotlib to clean, analyze, and visualize large datasets. This allowed me to efficiently process the data and extract valuable insights for the team.
I also have experience working with R, particularly when it comes to statistical modeling and hypothesis testing. Utilizing packages like dplyr, ggplot2, and tidyr, I’ve been able to perform advanced analyses and create compelling visualizations that effectively communicate our findings to stakeholders. My proficiency in both Python and R has enabled me to tackle various data-related challenges and contribute significantly to the success of my projects.”
4. Are you familiar with any data visualization tools? If so, which ones?
Data visualization is a vital skill for a data researcher, as it allows you to present complex information in a visually appealing and easily digestible format. Interviewers ask about your familiarity with data visualization tools to assess your ability to transform raw data into meaningful insights that can be easily understood by non-experts. Showcasing your knowledge of various data visualization tools demonstrates your versatility and adaptability in using the best tool for the job and effectively communicating your findings to different audiences.
Example: “Yes, I am familiar with several data visualization tools that help in presenting complex data in a more understandable and visually appealing manner. Some of the tools I have experience with include Tableau, Microsoft Power BI, and Google Data Studio.
Tableau is my go-to tool for creating interactive dashboards and visualizations, as it offers a wide range of customization options and supports various data sources. Power BI is another powerful tool I’ve used, particularly when working within the Microsoft ecosystem, as it integrates seamlessly with other Microsoft applications like Excel and SharePoint. Lastly, Google Data Studio has been useful for creating real-time reports and sharing them easily with team members, especially when working with Google Analytics or Google Sheets data.”
5. How do you ensure the accuracy and reliability of the data you collect and analyze?
Accuracy and reliability are the cornerstones of quality data research, and interviewers want to ensure you prioritize these aspects in your work. By asking this question, they are looking to gauge your understanding of essential data verification techniques, your attention to detail, and your commitment to delivering accurate, trustworthy insights that can drive informed decision-making within the organization.
Example: “To ensure the accuracy and reliability of the data I collect and analyze, I follow a systematic approach that includes verifying data sources, cross-checking information, and using appropriate analytical methods. First, I make sure to use reputable and reliable sources for data collection, such as government databases, industry reports, or peer-reviewed research articles. This helps establish a solid foundation for my analysis.
Once I have collected the data, I perform thorough cross-checks by comparing it with other relevant sources to identify any discrepancies or inconsistencies. If there are any doubts about the data’s validity, I investigate further to resolve the issue before proceeding with the analysis. Additionally, I maintain clear documentation of my data collection process, including source citations and notes on any assumptions made during the analysis.
When analyzing the data, I choose appropriate statistical techniques and tools based on the nature of the data and the research question at hand. This ensures that the results obtained from the analysis are accurate and meaningful. Finally, I always review my findings critically and seek feedback from colleagues or subject matter experts to validate my conclusions and ensure their reliability.”
6. Describe your experience using APIs to gather data.
Employers want to know if you have the technical skills and experience required to efficiently gather and manipulate data from various sources. APIs, or Application Programming Interfaces, are an essential way to access and collect data from different platforms, websites, or databases. Your familiarity with APIs demonstrates your ability to work with complex data sets and adapt to various data sources, which is a valuable skill in the world of data research.
Example: “During my previous role as a data researcher, I frequently used APIs to gather and analyze data from various sources. One notable project involved collecting social media data for sentiment analysis. To achieve this, I utilized the Twitter API to access tweets containing specific keywords related to our client’s products.
I started by familiarizing myself with the API documentation and setting up authentication using OAuth. Once connected, I wrote Python scripts utilizing the Tweepy library to extract relevant tweet data such as text, timestamp, user information, and engagement metrics. This allowed me to efficiently collect large volumes of data while adhering to the API rate limits.
The gathered data was then cleaned, preprocessed, and analyzed to identify trends and sentiments that helped inform our client’s marketing strategy. The use of APIs in this project not only streamlined the data collection process but also ensured we had access to real-time, accurate information directly from the source.”
7. Have you ever worked with unstructured data? If so, how did you handle it?
Data researchers often face the challenge of working with unstructured data, which requires creativity, flexibility, and problem-solving skills. By asking this question, interviewers want to know if you have experience dealing with this common issue and gauge your ability to transform messy information into valuable insights. Your response will demonstrate your analytical skills, adaptability, and resourcefulness in tackling real-world data problems.
Example: “Yes, I have worked with unstructured data in a previous project where we were analyzing customer feedback from various sources like social media, emails, and online reviews. The challenge was to extract valuable insights from this raw, unorganized information.
To handle the unstructured data, I first used natural language processing (NLP) techniques to preprocess the text by removing stop words, stemming, and tokenizing. Then, I applied topic modeling algorithms such as Latent Dirichlet Allocation (LDA) to identify common themes and patterns within the data. This allowed us to group similar feedback together and gain a better understanding of our customers’ concerns and preferences. Ultimately, these insights helped inform our marketing strategies and improve overall customer satisfaction.”
8. What methods do you use to validate the quality of the data you work with?
Accuracy and reliability are paramount in the world of data research. Interviewers want to ensure that you have a strong understanding of data validation techniques and that you actively employ them in your work. This question helps them gauge your attention to detail, your commitment to maintaining data integrity, and your ability to recognize and address potential errors or inaccuracies in the data you handle.
Example: “To validate the quality of data, I employ a combination of techniques to ensure its accuracy and reliability. First, I perform an initial assessment by checking for any missing values, inconsistencies, or outliers in the dataset. This helps me identify potential issues that may require further investigation.
Once I have a general understanding of the data’s structure, I use cross-validation methods such as comparing it with other reputable sources or benchmarking against industry standards. This step allows me to confirm the credibility of the information and detect any discrepancies that might impact my analysis.
Furthermore, I collaborate with colleagues or subject matter experts to review the data and provide their insights on its validity. Their expertise can help uncover hidden patterns or trends that might not be immediately apparent, ensuring a comprehensive evaluation of the data’s quality. Through this multi-faceted approach, I can confidently work with data that is accurate, reliable, and relevant to the research objectives.”
9. Can you explain the difference between supervised and unsupervised machine learning algorithms?
When considering a data researcher candidate, interviewers want to know whether you possess a solid understanding of the different machine learning approaches. This question is asked to explore your familiarity with the concepts and their applications, as well as your ability to explain complex ideas clearly. Supervised and unsupervised algorithms form the basis of many data-driven solutions, so it’s essential for a data researcher to be well-versed in their differences and use cases.
Example: “Supervised machine learning algorithms involve training a model using labeled data, where the input-output relationship is already known. The algorithm learns from this data and then applies that knowledge to make predictions on new, unseen data. Common supervised learning techniques include regression for continuous outputs and classification for categorical outputs.
On the other hand, unsupervised machine learning algorithms work with unlabeled data, meaning there’s no predefined output or target variable. Instead, these algorithms aim to identify patterns, relationships, or structures within the data itself. Clustering and dimensionality reduction are common unsupervised learning techniques used to group similar data points together or reduce the complexity of high-dimensional data, respectively.
Both supervised and unsupervised learning have their unique applications in data research, depending on the problem at hand and the availability of labeled data.”
10. Describe a situation where you had to deal with missing or incomplete data. How did you handle it?
Data researchers often face the challenge of working with imperfect information. Interviewers want to know if you possess the analytical skills, creativity, and resourcefulness to handle these situations effectively. Your response to this question demonstrates your ability to fill in the gaps, make informed assumptions, and ultimately deliver accurate and meaningful insights, even when the data isn’t perfect.
Example: “During a previous project, I was tasked with analyzing customer satisfaction data to identify trends and areas for improvement. While reviewing the dataset, I noticed that some survey responses were incomplete or missing entirely. To address this issue, I first assessed the extent of the missing data and determined whether it would significantly impact the analysis.
Since the missing data represented a small percentage of the total responses, I decided to proceed with caution by using statistical imputation techniques to estimate the missing values. This involved identifying patterns in the available data and making educated assumptions based on those patterns. Additionally, I made sure to document my methodology and assumptions thoroughly so that other team members could understand the approach taken and its potential limitations.
After completing the analysis, I presented my findings to the team, highlighting the areas where we had estimated data and discussing the possible implications on our conclusions. This transparency allowed us to make informed decisions while acknowledging the limitations of the dataset.”
11. What is your approach to handling outliers in a dataset?
When working with datasets, outliers can have a significant impact on the overall analysis and conclusions. Interviewers want to know how you approach these unusual data points because it demonstrates your critical thinking skills and understanding of data quality. They’re interested in seeing whether you have the ability to recognize, manage, and communicate the potential effects of outliers in your research and analysis.
Example: “When handling outliers in a dataset, my first step is to identify and understand the nature of these data points. I begin by visualizing the data using appropriate plots, such as box plots or scatter plots, which can help me spot any potential outliers. Once identified, I investigate whether these outliers are due to errors in data collection, entry, or processing, or if they represent genuine observations.
If the outliers result from errors, I take corrective measures, such as fixing data entry mistakes or addressing issues with data collection methods. However, if the outliers are valid observations, I consider their impact on the analysis. In some cases, removing them might be necessary to prevent distortion of results, especially when using techniques sensitive to extreme values. Alternatively, if the outliers provide valuable insights or are essential for the research question, I may choose to keep them and use robust statistical methods that minimize their influence on the overall analysis. This approach ensures that the final conclusions drawn from the dataset are both accurate and meaningful.”
12. Explain the concept of data normalization and why it’s important.
Data normalization is a key concept for any data researcher, and interviewers want to ensure you understand its importance. Normalization is the process of organizing data in a database to minimize redundancy and improve data integrity. By demonstrating your knowledge of data normalization, you show that you can maintain and work with clean, high-quality data, leading to more accurate and reliable analysis and insights for the organization.
Example: “Data normalization is a process used in database design to organize data and reduce redundancy, ensuring that each piece of information is stored only once. This is achieved by dividing larger tables into smaller ones and defining relationships between them using primary and foreign keys. The main goal of normalization is to eliminate anomalies, such as insertion, update, and deletion anomalies, which can lead to inconsistencies and inaccuracies in the data.
Normalization is important for several reasons. First, it improves the efficiency of data storage by reducing duplicate data, saving space, and making the database easier to maintain. Second, it enhances data integrity by enforcing consistency across related records, ensuring that changes made to one record are automatically reflected in others. Finally, normalized databases facilitate more efficient querying and reporting, as they allow for simpler and faster retrieval of information. In summary, data normalization plays a critical role in maintaining accurate, consistent, and easily accessible data within a database system.”
13. Do you have experience working with relational databases? If so, which ones?
Your ability to navigate relational databases is essential for a data researcher, as these databases are often used to store, organize, and analyze large amounts of information. By asking this question, interviewers seek to gauge your familiarity with specific tools and platforms, as well as your experience in handling complex data sets. It’s a way to assess your technical skills and determine if you can efficiently manage the data-driven tasks required for the role.
Example: “Yes, I have extensive experience working with relational databases throughout my career as a data researcher. My primary expertise lies in using MySQL and PostgreSQL for managing and organizing large datasets. In my previous role at XYZ Company, I was responsible for designing and maintaining the database schema using MySQL, which involved creating tables, defining relationships between them, and optimizing queries to ensure efficient data retrieval.
I have also worked on projects that utilized PostgreSQL, where I gained experience in advanced features such as full-text search, JSON support, and spatial data processing. This allowed me to develop a deeper understanding of different database systems and their unique capabilities, enabling me to choose the most suitable solution based on project requirements.”
14. What statistical techniques do you commonly use in your data analysis projects?
Your ability to select and apply appropriate statistical techniques is critical to a data researcher role. Employers want to ensure that you have a deep understanding of various statistical methods and can effectively use them to analyze and interpret data, leading to meaningful insights and informed decisions for the organization. Demonstrating your expertise and experience with statistical techniques will signal that you are a capable data researcher who can contribute to the success of the company’s data-driven projects.
Example: “As a data researcher, I employ various statistical techniques depending on the nature of the project and the specific research question. Two commonly used methods in my work are regression analysis and hypothesis testing.
Regression analysis allows me to model relationships between variables and identify trends or patterns within the data. This technique is particularly useful when trying to predict outcomes based on certain input factors or understand how changes in one variable might impact another. For example, I’ve used multiple linear regression to analyze the relationship between sales performance and marketing spend across different channels.
Hypothesis testing is another essential tool for making informed decisions based on sample data. It helps me determine whether observed differences or correlations are statistically significant or simply due to chance. One common test I use is the t-test, which compares means between two groups. In a recent project, I employed an independent samples t-test to evaluate if there was a significant difference in customer satisfaction scores between two product versions.
These techniques, along with others like ANOVA, chi-square tests, and cluster analysis, enable me to extract valuable insights from data and support evidence-based decision-making processes.”
15. How do you stay up-to-date on the latest trends and developments in data research?
Staying current in the field of data research is essential to maintaining a competitive edge in the job market and delivering the most valuable insights to your employer. By asking this question, interviewers want to gauge your commitment to professional growth and your ability to adapt to an ever-evolving landscape, while also ensuring that you’re well-informed about new methodologies, tools, and technologies that could benefit the organization.
Example: “To stay up-to-date on the latest trends and developments in data research, I actively engage with various sources of information. First, I subscribe to industry-leading journals and publications such as Harvard Business Review, Data Science Central, and Journal of Big Data, which provide valuable insights into new methodologies, tools, and best practices.
I also participate in online forums and communities where professionals discuss current challenges, share experiences, and exchange ideas. This helps me gain practical knowledge from my peers and learn about real-world applications of emerging technologies. Additionally, I attend webinars, conferences, and workshops whenever possible to network with other professionals and hear directly from experts in the field.
This combination of staying informed through reputable publications, engaging with professional communities, and attending events allows me to continuously expand my knowledge and ensure that my skills remain relevant in the ever-evolving world of data research.”
16. Describe a time when you had to present complex data findings to a non-technical audience. How did you make the information accessible and understandable?
Data researchers must be able to effectively convey their findings to people who may not have a strong background in data analysis. This question seeks to evaluate your ability to break down complex information and present it in a way that is easy for others to comprehend. The interviewer wants to know if you can adapt your communication style to suit different audiences and ensure that your insights make a meaningful impact on decision-making processes.
Example: “I once worked on a project where I had to analyze customer behavior data for an e-commerce company and present the findings to the marketing team, who were not well-versed in technical data analysis. My goal was to help them understand the key insights so they could make informed decisions about their marketing strategies.
To make the information accessible and understandable, I started by identifying the most important takeaways from my analysis that would be relevant to the marketing team’s objectives. Then, I used visual aids like charts and graphs to represent the data in a more digestible format. For example, I created a heatmap to show the peak hours of website traffic and a bar chart to display the most popular product categories among different age groups.
During the presentation, I focused on explaining the context and significance of each finding rather than diving into complex statistical methods. I also encouraged questions throughout the session to ensure everyone understood the key points. This approach allowed me to effectively communicate the insights from the data analysis, enabling the marketing team to develop targeted campaigns based on the findings.”
17. Can you provide an example of a project where you used predictive analytics to solve a problem or answer a question?
Employers are interested in your ability to leverage data and predictive analytics to draw meaningful insights and inform decision-making. By asking for a specific example, they want to gauge your experience and expertise in using these tools, as well as your thought process and problem-solving skills. Sharing a successful project demonstrates your aptitude for data-driven analysis and your ability to apply it in real-world scenarios.
Example: “Certainly! I recently worked on a project for an e-commerce company that wanted to optimize its marketing efforts by targeting customers who were most likely to make repeat purchases. My role was to analyze the historical transaction data and develop a predictive model to identify these high-value customers.
I started by cleaning and preprocessing the data, ensuring it was free of inconsistencies and missing values. Next, I performed exploratory data analysis to understand patterns and correlations between various customer attributes and their purchasing behavior. Based on my findings, I selected relevant features such as average order value, frequency of purchases, and time since last purchase to build the predictive model.
I experimented with several machine learning algorithms, including logistic regression, decision trees, and random forests, to find the best-performing model. After fine-tuning the parameters and validating the model using cross-validation techniques, I settled on a random forest classifier due to its superior performance in terms of accuracy and precision.
The final model successfully identified customers with a high likelihood of making repeat purchases, enabling the marketing team to focus their efforts on this segment and ultimately increase the company’s revenue through targeted campaigns. This project showcased the power of predictive analytics in driving informed business decisions and achieving desired outcomes.”
18. What is your experience with web scraping tools and techniques?
Employers want to gauge your proficiency in using web scraping tools and techniques because it’s a vital skill for a data researcher. Web scraping is the process of extracting data from websites, and this information is often used for analysis, research, or generating insights. Your familiarity with various web scraping methods and tools demonstrates your ability to efficiently gather the necessary data to support the organization’s objectives.
Example: “Throughout my career as a data researcher, I have gained extensive experience with various web scraping tools and techniques. My primary go-to tool is Python’s Beautiful Soup library, which allows me to efficiently extract information from HTML and XML documents. In combination with the requests library, I can automate the process of fetching web pages and parsing their content.
When dealing with more complex websites that rely on JavaScript for rendering content, I utilize Selenium WebDriver. This enables me to interact with dynamic elements on the page and retrieve data that might not be accessible using traditional methods. Additionally, I am well-versed in implementing proxies and rate-limiting strategies to ensure compliance with website terms of service and avoid IP blocking.
My expertise in web scraping has allowed me to gather valuable insights and support data-driven decision-making across various projects, ultimately contributing to the achievement of overall business goals.”
19. How do you prioritize multiple data research projects with competing deadlines?
Time management is a critical skill in any workplace, but it is especially important for data researchers who often juggle multiple projects with varying deadlines. By asking this question, interviewers want to assess your ability to effectively prioritize tasks, manage your workload, and ensure timely delivery of accurate and insightful research findings that can drive business decisions.
Example: “When faced with multiple data research projects and competing deadlines, I prioritize them based on a combination of factors such as urgency, project complexity, and stakeholder expectations. First, I assess the urgency of each project by considering their respective deadlines and any potential consequences if they are not completed on time. Projects with tighter deadlines or higher stakes will naturally take precedence.
After evaluating urgency, I consider the complexity of each project and estimate the amount of time and resources required to complete them. This helps me allocate my time effectively and identify any potential bottlenecks that may arise during the research process. Additionally, I maintain open communication with stakeholders to understand their expectations and keep them informed about progress and any changes in priorities.
This approach allows me to efficiently manage multiple projects while ensuring that I meet deadlines and deliver high-quality results for all stakeholders involved.”
20. Have you ever encountered ethical concerns while conducting data research? If so, how did you address them?
Ethics play a significant role in data research, as it involves handling sensitive information, maintaining privacy, and ensuring unbiased analysis. Interviewers ask this question to gauge your awareness of ethical considerations and your ability to navigate potential dilemmas. Demonstrating how you’ve dealt with ethical concerns in the past showcases your commitment to integrity and responsible research practices, which are essential qualities for any data researcher.
Example: “Yes, I have encountered ethical concerns during my time as a data researcher. One specific instance involved working on a project that required collecting sensitive personal information from participants. To address these concerns, I ensured that our research team adhered to strict privacy and confidentiality protocols.
We obtained informed consent from all participants before collecting any data, clearly explaining the purpose of the study and how their information would be used. Additionally, we anonymized the collected data by removing personally identifiable information and assigning unique identifiers to each participant. This allowed us to analyze the data without compromising individual privacy. Furthermore, we implemented stringent security measures to protect the stored data from unauthorized access.
Throughout the entire process, open communication with stakeholders and maintaining transparency about our methods were key in addressing ethical concerns. This approach not only helped maintain the integrity of our research but also built trust among participants and other parties involved in the project.”
21. What steps do you take to protect sensitive data during your research process?
Data security is a critical aspect of any job involving sensitive information. Employers want to make sure that you have a strong understanding of best practices for safeguarding data and maintaining confidentiality. By describing the steps you take to protect sensitive data, you demonstrate not only your awareness of potential risks but also your commitment to upholding ethical research standards. This helps build trust with both your employer and the clients whose data you handle.
Example: “Protecting sensitive data is a top priority during my research process. First, I ensure that all data storage and transfer methods are secure by using encrypted channels and password-protected files. This helps prevent unauthorized access to the information.
When working with sensitive data, I adhere to strict access control policies, granting access only to those who need it for their specific tasks. Additionally, I maintain detailed logs of data usage, which allows me to track any potential breaches or misuse of the information.
Furthermore, I stay up-to-date on industry best practices and regulations related to data privacy, such as GDPR, ensuring compliance throughout the research process. This proactive approach not only safeguards sensitive data but also fosters trust among stakeholders involved in the project.”
22. Describe your experience working with geospatial data and related tools.
Employers want to know about your familiarity with geospatial data and related tools because working with geographic information is a critical aspect of a data researcher’s job. Your ability to analyze, interpret, and visualize spatial data using specific software can significantly impact the quality of your research and the insights you can provide to the company. Demonstrating your expertise in this area can help convince interviewers that you have the necessary skills to excel in the role.
Example: “During my time as a data researcher, I have had the opportunity to work extensively with geospatial data and related tools. One of my key projects involved analyzing land use patterns in urban areas using satellite imagery and GIS software like ArcGIS and QGIS. This project required me to process large datasets, perform spatial analysis, and create visually appealing maps to effectively communicate the findings.
I also gained experience working with various geospatial data formats such as shapefiles, GeoJSON, and KML, as well as utilizing Python libraries like Geopandas and Shapely for more advanced geospatial operations. My familiarity with these tools and techniques has allowed me to efficiently analyze and interpret complex geospatial data, ultimately supporting informed decision-making processes within the organization.”
23. Can you explain the concept of data clustering and its applications?
Data clustering is a core concept in data analysis, and interviewers ask this question to test your understanding of it and how it can be applied. Your ability to explain the concept demonstrates your technical knowledge and analytical skills, which are essential for a data researcher. It also gives the interviewer insight into how you approach complex concepts and communicate them to others, which is crucial in a collaborative work environment.
Example: “Data clustering is an unsupervised machine learning technique that involves grouping similar data points together based on their features or characteristics. The goal is to maximize the similarity within each cluster while minimizing the similarity between different clusters. This is achieved by using various distance metrics, such as Euclidean or Manhattan distance, and optimization algorithms like K-means, hierarchical clustering, or DBSCAN.
Clustering has numerous applications across industries. In marketing, it can be used for customer segmentation, allowing businesses to identify groups of customers with similar preferences or behaviors and tailor marketing strategies accordingly. In finance, clustering helps detect patterns in stock price movements, enabling better investment decisions. Additionally, in healthcare, clustering can aid in identifying patient groups with similar symptoms or conditions, leading to more effective treatment plans and resource allocation. These are just a few examples of how data clustering contributes to improved decision-making and efficiency in diverse fields.”
24. What is your experience with natural language processing techniques?
As a data researcher, interviewers want to assess your ability to analyze and extract meaning from complex, unstructured data, such as text or speech. Natural language processing (NLP) is a key aspect of this, as it involves using algorithms and artificial intelligence to make sense of human language. Demonstrating your experience with NLP techniques shows that you’re equipped to handle the challenges of working with large amounts of text data, which can be essential for many projects in data research.
Example: “During my time as a data researcher, I have had the opportunity to work on several projects involving natural language processing (NLP) techniques. One notable project involved sentiment analysis of customer reviews for an e-commerce company. My role was to preprocess and clean the text data, which included tokenization, stopword removal, and stemming. After preprocessing, I implemented various machine learning algorithms such as Naive Bayes, Support Vector Machines, and Random Forests to classify the reviews into positive, negative, or neutral sentiments.
Another NLP project I worked on focused on topic modeling for a news organization. Using Latent Dirichlet Allocation (LDA), I helped identify common themes across thousands of articles, enabling the editorial team to better understand their content coverage and make informed decisions about future topics. This experience has given me a solid foundation in applying NLP techniques to real-world problems and understanding the importance of tailoring these methods to specific use cases.”
25. How do you handle situations where the available data does not support a desired conclusion or hypothesis?
The essence of data research is to uncover the truth and insights hidden within the data. Employers want to know if you can remain objective and prioritize accuracy over personal biases or desired outcomes. Demonstrating your ability to analyze data impartially, even when it leads to unexpected or undesirable conclusions, shows your commitment to maintaining the integrity of your research and your value as a data researcher.
Example: “When I encounter a situation where the available data does not support a desired conclusion or hypothesis, my first step is to reevaluate the data collection and analysis process. This involves double-checking for any errors in data entry, sampling biases, or analytical methods that may have led to inaccurate results.
If after this thorough review, the data still doesn’t support the initial hypothesis, it’s essential to communicate these findings objectively and transparently to stakeholders. As a data researcher, my primary responsibility is to provide accurate and reliable insights, even if they contradict our expectations. In such cases, I would present the evidence clearly and suggest alternative hypotheses or avenues of investigation that could help us better understand the issue at hand. This approach ensures that we maintain scientific integrity while continuing to explore new possibilities and drive informed decision-making within the organization.”
26. Describe a time when you had to learn a new tool or technique quickly for a data research project.
The world of data research is constantly evolving, and successful professionals in this field must be adaptable and quick learners. When interviewers ask this question, they want to gauge your ability to stay current with new tools, methodologies, and technologies. They’re also interested in assessing your problem-solving skills and proactive attitude when facing unfamiliar situations or challenges in your work.
Example: “During a previous project, our team was tasked with analyzing large datasets to identify trends and patterns related to customer behavior. Midway through the project, we realized that our existing tools were not efficient enough to handle the volume of data and deliver results within the tight deadline.
To overcome this challenge, I took the initiative to research alternative tools and discovered that Python’s Pandas library would be an ideal solution for our needs. Despite having limited experience with Python at the time, I quickly immersed myself in online tutorials and resources to learn the necessary skills. Within a week, I became proficient in using Pandas for data manipulation and analysis.
I then shared my newfound knowledge with the rest of the team, providing them with a brief training session on how to use the library effectively. As a result, we were able to streamline our data analysis process, complete the project on time, and provide valuable insights to our client. This experience taught me the importance of being adaptable and resourceful when faced with unexpected challenges in data research projects.”
27. Have you ever worked on a cross-functional team? If so, how did you contribute as a data researcher?
Cross-functional collaboration is essential to the success of many projects, particularly those that involve complex data analysis. Interviewers want to know if you have experience working in diverse teams and can effectively communicate your data-driven insights to non-experts. They’re interested in learning about your ability to adapt, collaborate, and contribute meaningfully in a team setting where different skills and perspectives come together to solve problems or achieve common goals.
Example: “Yes, I have worked on a cross-functional team in my previous role as a data researcher for a marketing project. The team consisted of members from various departments such as marketing, sales, and product development. My primary responsibility was to gather, analyze, and interpret relevant data that would help the team make informed decisions.
I contributed by conducting extensive market research to identify trends, customer preferences, and competitor strategies. Additionally, I analyzed internal sales data to determine the effectiveness of past marketing campaigns and identify areas for improvement. This information allowed our marketing team to develop targeted strategies and optimize their efforts.
Furthermore, I collaborated with the product development team to provide insights into customer needs and preferences, which helped them refine existing products and create new offerings tailored to the market demand. My ability to communicate complex data findings in an easily understandable manner enabled the team to make well-informed decisions, ultimately contributing to the success of the project.”
28. Explain the importance of metadata in data research projects.
Data researcher interviewers want to know if you understand how metadata can be the key to unlocking valuable insights in a data research project. Metadata provides context, helps in data organization, and can improve the overall efficiency and accuracy of research. By demonstrating your knowledge of metadata’s importance, you showcase your ability to work with data in a comprehensive and meaningful way.
Example: “Metadata plays a vital role in data research projects as it provides essential context and information about the collected data. It helps researchers understand the structure, origin, and relationships between different datasets, which is critical for accurate analysis and interpretation.
For instance, metadata can include details such as data collection methods, units of measurement, timeframes, and data source reliability. This information allows researchers to assess the quality and relevance of the data, ensuring that their analyses are based on valid and reliable inputs. Additionally, metadata facilitates data organization, making it easier to locate, retrieve, and manage large volumes of data throughout the project lifecycle. In summary, metadata enhances the overall efficiency and accuracy of data research projects by providing valuable context and supporting effective data management practices.”
29. What strategies do you use to stay organized and manage your workload as a data researcher?
Organization and time management are essential skills in the world of data research. Interviewers ask this question to gauge your ability to prioritize tasks, stay on top of deadlines, and maintain a high level of productivity. They want to ensure that you can handle the demands of the job while delivering accurate and thorough research results, which ultimately contribute to the success of the company’s projects and goals.
Example: “As a data researcher, I rely on a combination of time management techniques and digital tools to stay organized and manage my workload effectively. One strategy I use is the Pomodoro Technique, where I break down tasks into focused intervals with short breaks in between. This helps me maintain productivity while avoiding burnout.
I also utilize project management software like Trello or Asana to create task lists, set deadlines, and prioritize assignments based on their urgency and importance. This allows me to have a clear overview of my responsibilities and progress at any given moment. Additionally, I make sure to keep all relevant files and documents well-organized using cloud storage platforms such as Google Drive or Dropbox, ensuring easy access and collaboration with team members when needed. These strategies have proven successful in helping me manage my workload efficiently and deliver high-quality results consistently.”
30. In your opinion, what are some emerging trends or technologies that will shape the future of data research?
Curiosity and the ability to stay ahead of the curve are essential qualities for a data researcher. By asking about emerging trends and technologies, interviewers want to gauge your level of interest and knowledge in the field, as well as your ability to analyze and adapt to the ever-changing landscape of data research. This question helps them understand your potential to grow with the company and contribute to its long-term success.
Example: “One emerging trend that I believe will significantly shape the future of data research is the increasing adoption of artificial intelligence (AI) and machine learning. These technologies have the potential to automate various aspects of data collection, analysis, and interpretation, allowing researchers to process larger volumes of data more efficiently. This can lead to faster insights and better decision-making for businesses.
Another trend worth noting is the growing importance of data privacy and security. With stricter regulations like GDPR and an increased awareness of ethical considerations surrounding data usage, researchers must adapt their methodologies to ensure compliance and protect sensitive information. This may involve implementing new tools or practices to anonymize data and maintain transparency with stakeholders about how data is collected and used.
Both AI-driven automation and a heightened focus on data privacy are likely to continue shaping the field of data research in the coming years, pushing professionals to stay up-to-date with evolving technologies and best practices to remain competitive and effective in their roles.”
30 Executive Personal Assistant Interview Questions and Answers
30 public accountant interview questions and answers, you may also be interested in..., 30 geoscientist interview questions and answers, 20 interview questions every hvac supervisor should be prepared for, 30 furniture maker interview questions and answers, 30 clinical informatics coordinator interview questions and answers.
University of Utah researcher faked data for years, according to investigators
Gian-stefano brigidi was highly regarded among neuroscientists for his work on how life experiences change the brain. but a federal office found he manipulated his data..
(Francisco Kjolseth | The Salt Lake Tribune) University of Utah research park is pictured on Thursday, Oct. 27, 2022. A neuroscience researcher at the school was fund to have manipulated data in his studies of the brain, according to federal investigators.
A former University of Utah neuroscientist — who was regarded in the field as a “visionary” — manipulated results and faked data in his research for years, according to the findings of a federal investigation.
The report on the misconduct from the U.S. Office of Research Integrity states that Gian-Stefano Brigidi used at least 43 fabricated numbers across several scientific presentations, a handful of grant applications and one published paper in the peer-reviewed journal “Cell.” Using that faked data, he was awarded more than $1 million in federal funding.
The U. stated this week that Brigidi no longer works at the school, but declined to comment further on his employment or the findings from investigators. Brigidi, who was widely considered a creative thinker in the study of the brain, was first hired as an assistant professor at the school in January 2021. His tenure there ended in August 2023, a spokesperson confirmed.
Prior to working at the U., Brigidi was a postdoctoral fellow in a lab at the University of California San Diego, as well as an assistant professor there.
Brigidi told The Transmitter — a publication that writes about neuroscience research and first reported on the faked data — that no misconduct happened during his time at the U., though the federal report shows that he continued to use the numbers in Utah that he had originally manipulated while in California. He did not respond to requests for comment from The Salt Lake Tribune.
Both the U. and UC San Diego did their own analyses of his work, which also confirmed the research misconduct that has called into question years of Brigidi’s work. And it provides a glimpse into the oversight of research and the rigorous process for when allegations arise that research is not based on real results.
“Allegations of misconduct can come through many channels, and as soon as we are aware of an allegation, UC San Diego’s Office of Research Compliance and Integrity begins our inquiry,” a spokesperson for the California school said in an email to The Tribune.
The faculty leader of the Bloodgood Lab at UC San Diego , Brenda Bloodgood, did not respond to a request for comment. Her lab is renowned for its studies of how experiences shape the neurons of the brain — work that Brigidi was continuing in his position at the U. and for which he was also awarded hundreds of thousands of dollars in funding.
Currently, his picture remains with the noted alumni on the Bloodgood Lab’s website . His staff page has been removed from the U.’s site.
Brigidi specifically was heralded by the National Institutes of Health in 2021 , a few months after joining the U.’s faculty, for his “highly innovative” project on how the electrical circuitry of the human brain is altered by memories or behaviors — such as having a kid or earning a promotion.
The idea was that significant experiences leave a mark on a molecular level, according to the announcement of the award.
The U. has since requested the National Institutes of Health to terminate that $1.37 million grant.
It’s unclear what happens to other funding awarded to Brigidi through the U.S. Public Health Service.
The research office’s report states that Brigidi “knowingly or intentionally manipulated” graphs, figures and images in presentations and posters over seven years, from 2015 to 2022.
Now, he has entered into a voluntary agreement that will require his research at future jobs to be supervised by two or three senior faculty members for the next five years. If he submits any applications for federal funding, the institution employing him must include a certification that the research is “based on actual experiments.”
Brigidi must also correct or retract the paper he published in “Cell” in 2019.
This is the second time in the last two years that a faculty member at the University of Utah has been cited by the federal Office of Research Integrity for misconduct. Last year, Ivana Frech, a former assistant professor in the U.’s School of Medicine, was also found to have manipulated data by altering images in her work about cellular iron regulation.
“ORI found that these acts constitute a significant departure from accepted practices of the relevant research community,” the office wrote in that report.
Frech is no longer employed by the U., with her last day there in October 2013. It’s unclear why the investigation into image manipulation came a decade after that. But she will be required to retract or correct her findings that were also published in “Cell.” Frech did not respond to a request for comment from The Tribune.
Julie Kiefer, a U. spokesperson, said the school “takes research misconduct seriously.” When manipulation in research occurs, she said, the university will work to correct the record, notify federal funding agencies and provide training on responsible research practices.
She said that the U. is committed to “ethical conduct and excellence in scientific inquiry.”

Donate to the newsroom now. The Salt Lake Tribune, Inc. is a 501(c)(3) public charity and contributions are tax deductible
RELATED STORIES
All of utah’s colleges will increase tuition and fees. here’s a rundown., after dei bill, this is what utah’s college presidents fear will be the next target of lawmakers, first university in utah renames dei office after lawmakers ban words. this is what it’s now called., gov. cox said he didn’t see evidence dei programs work. here’s the data utah colleges say they’ve given him., practice your faith in a safe place with religious services at this upscale utah retirement community, nfl draft tracker: utes safety cole bishop is first utah player selected, the new president of utah’s slcc is ‘a first-generation community college student himself’, utah congressional candidate says jan. 6 protesters are ‘politically persecuted’ — and he’s a democrat, bagley cartoon: no justice, utah woman in viral tiktok charged with sexual battery after pulling teen’s skirt down in restaurant, featured local savings.
Search & Apply for Jobs
You are now leaving Citi Careers portal, and entering a third-party site, operated on behalf of Citi.
Please select a location from the dropdown to proceed.
Keyword Search
Data Scientist
The Spec Analytics Analyst is a developing professional role. Applies specialty area knowledge in monitoring, assessing, analyzing and/or evaluating processes and data. Identifies policy gaps and formulates policies. Interprets data and makes recommendations. Researches and interprets factual information. Identifies inconsistencies in data or results, defines business issues and formulates recommendations on policies, procedures or practices. Integrates established disciplinary knowledge within own specialty area with basic understanding of related industry practices. Good understanding of how the team interacts with others in accomplishing the objectives of the area. Develops working knowledge of industry practices and standards. Limited but direct impact on the business through the quality of the tasks/services provided. Impact of the job holder is restricted to own team. Responsibilities:
- Incumbents work with large and complex data sets (both internal and external data) to evaluate, recommend, and support the implementation of business strategies
- Identifies and compiles data sets using a variety of tools (e.g. SQL, Access) to help predict, improve, and measure the success of key business to business outcomes
- Responsible for documenting data requirements, data collection / processing / cleaning, and exploratory data analysis; which may include utilizing statistical models / algorithms and data visualization techniques
- Incumbents in this role may often be referred to as Data Scientists
- Specialization in marketing, risk, digital and AML fields possible
- Appropriately assess risk when business decisions are made, demonstrating particular consideration for the firm's reputation and safeguarding Citigroup, its clients and assets, by driving compliance with applicable laws, rules and regulations, adhering to Policy, applying sound ethical judgment regarding personal behavior, conduct and business practices, and escalating, managing and reporting control issues with transparency.
Qualifications:
- 0-2 years relevant experience
- Have the ability to retrieve and manipulation data
- Possess analytic ability and problem solving skills
- Working experience in a quantitative field
- Excellent communication and interpersonal skills, be organized, detail oriented, and adaptive to matrix work environment
- Ability to build partnerships with cross-functional teams
- Bachelors/University degree or equivalent experience
This job description provides a high-level review of the types of work performed. Other job-related duties may be assigned as required.
------------------------------------------------------
Job Family Group:
Job Family:
Citi is an equal opportunity and affirmative action employer.
Qualified applicants will receive consideration without regard to their race, color, religion, sex, sexual orientation, gender identity, national origin, disability, or status as a protected veteran.
Citigroup Inc. and its subsidiaries ("Citi”) invite all qualified interested applicants to apply for career opportunities. If you are a person with a disability and need a reasonable accommodation to use our search tools and/or apply for a career opportunity review Accessibility at Citi .
View the " EEO is the Law " poster. View the EEO is the Law Supplement .
View the EEO Policy Statement .
View the Pay Transparency Posting

Join Fraud Early Warning Sr. Supervisor Hector for a day in the life
Fraud Early Warning Sr. Supervisor Hector talks about originally joining Citi just to get through college, but instead has built a 21-year career here because of the opportunities and mobility available within Citi.
Learn More >

Global Benefits
We bring the best to our people. We put our employees first and provide the best-in-class benefits they need to be well, live well and save well.

Why Join Citi APAC- In the Lens of Corporate Social Responsibility
Learn from some of our APAC leaders on how Corporate Social Responsibility is upheld across the communities we serve in the region.
Related Jobs
Featured career areas.
You have no saved jobs
Previously Viewed Jobs
You have no viewed jobs
An official website of the United States government
Here's how you know
Official websites use .gov A .gov website belongs to an official government organization in the United States.
Secure .gov websites use HTTPS. A lock ( Lock Locked padlock ) or https:// means you've safely connected to the .gov website. Share sensitive information only on official, secure websites.
Most NSF systems and services, including NSF.gov, Research.gov and FastLane, will be unavailable from Friday, April 26, 11 p.m. EDT – Saturday, April 27, 8:00 a.m. EDT due to extended maintenance. We apologize for any inconvenience.
Dear Colleague Letter: Using Long-Term Research Associated Data (ULTRA-Data)
April 23, 2024
Dear Colleague:
With this Dear Colleague Letter (DCL), the U.S. National Science Foundation (NSF) seeks to stimulate and encourage the use and reuse of data from environmental time series research to improve generalizable understanding in fields including (but not limited to) ecology, organismal evolution/adaptation, geoscience, and oceanography.
The collection and comparison of long-term environmental measurements are critical to generate an integrated understanding of how ecosystem components interact, test ecological and evolutionary theories, and support the development and testing of ecological models. To advance the understanding of long-term dynamics of populations, communities, and ecosystems, NSF has made substantial investments in the collection and archiving of long-term data. Projects like Hawaii Ocean Time-series (HOT), Arctic Observing Network (AON), Bermuda Atlantic Time-series Study (BATS), Centers for Transformative Environmental Monitoring Programs (CTEMPs), Critical Zone research (CZ), National Ecological Observatory Network (NEON), Long-Term Research in Environmental Biology (LTREB), and Long-term Ecological Research (LTER) sites collect environmental data, make observations, test hypotheses, and in some cases conduct experiments, but few resources are dedicated to accomplishing larger-scale synthesis.
Data collected by long-term projects are often multidisciplinary (including biology, chemistry, geology, and other fields of study) and may cover broad spatial scales in addition to an extended temporal aspect. These data are valuable because they can be used to explore regional, continental, and global scale questions regarding environmental and ecological processes. While all resulting data are publicly accessible, differences in how they are recorded, reported, and accessed, mean significant time and training may need to be invested to harmonize the data for use.
GOALS OF THE DCL
- Synthesize, compare, and/or combine long- and short-term datasets to advance understanding of ecosystem and environmental dynamics, ecology, and evolution;
- Conduct new modeling activities, including ecological or environmental forecasting;
- Increase the interoperability of data sets that are available from public repositories/databases such as the Community Surface Dynamics Modeling System (CSDMS), the Consortium of Universities for the Advancement of Hydrologic Science (CUAHSI), National Ecological Observatory Network (NEON), Biological & Chemical Oceanography Data Management Office (BCO-DMO), United States Antarctic Program Data Center (USAP-DC), Arctic Data Center, Environmental Data Initiative (EDI), EPA Environmental Dataset Gateway (EDG), Ocean Observing Initiative (OOI), and DataONE, Paleobiology Database;
- Propose workshops for both researchers and data scientists on accessing and using long-term data sets, with dissemination of the products to the scientific community (e.g., ESIIL).
NSF seeks to support diverse teams of investigators and institutions in the scientific activities that it funds. Submissions that benefit and involve the full breadth of the research community, including undergraduates, graduate students, postgraduates, and faculty at all institutions of higher education are encouraged.
Programs within the following NSF divisions/offices welcome submission of proposals responsive to this DCL. See the "How to Respond to this DCL" section for additional guidance on identifying a program.
Directorate for Biological Sciences
- Division of Environmental Biology
- Division of Integrative and Organismal Systems
Directorate for Geosciences
- Division of Earth Sciences
- Division of Ocean Sciences
- Office of Polar Programs
HOW TO RESPOND TO THIS DCL
Principal Investigators should contact program officers in the participating areas of NSF listed above about the suitability of submission to an individual program in response to this DCL, and to discuss the scope and size of potential proposals.
Proposals should follow the guidelines, deadlines (if any), budget limitations (if any), and solicitation-specific criteria of the relevant NSF program(s), once identified. Awards for projects responsive to this DCL will be funded through the relevant NSF program(s).
The proposal title should begin with "ULTRA-Data:" after any NSF Proposal & Award Policies & Procedures Guide (PAPPG) and/or solicitation-specific title requirements, if applicable. At the end of the Overview section of the Project Summary, include a sentence indicating that the proposal is being submitted in response to this DCL. Proposals that fail to address the objectives and guidance described in this DCL and in the relevant funding opportunity will be returned without review.
NSF is broadly interested in enabling discovery through the use and reuse of existing resources with untapped potential. Proposals responsive to this DCL should be primarily focused on utilizing data from environmental time series. Proposals primarily focused on innovative use of physical specimens and of metadata tracing back to physical specimens may be appropriate for the Innovative Use of Scientific Collections DCL ( NSF 24-069 ), and we encourage PIs to consider that document.
Questions should be directed to program directors in the relevant NSF research program(s); not the signatories to this DCL.
Susan Marqusee, Assistant Director Directorate for Biological Sciences
Alexandra Isern, Assistant Director Directorate for Geosciences
Numbers, Facts and Trends Shaping Your World
Read our research on:
Full Topic List
Regions & Countries
- Publications
- Our Methods
- Short Reads
- Tools & Resources
Read Our Research On:
Table of Contents
Immigration status, educational attainment, poverty status, homeownership, top states of residence, marital status, methodology, facts on hispanics of mexican origin in the united states, 2021.
An estimated 37.2 million Hispanics of Mexican origin lived in the United States in 2021, according to a Pew Research Center analysis of the U.S. Census Bureau’s American Community Survey. Mexicans in this statistical profile are people who self-identified as Hispanics of Mexican origin; this includes immigrants from Mexico and those who trace their family ancestry to Mexico.
Mexicans are the largest population of Hispanic origin living in the United States, accounting for 60% of the U.S. Hispanic population in 2021. From 2000 to 2021, the Mexican-origin population increased 79%, growing from 20.9 million to 37.2 million. At the same time, the Mexican foreign-born population living in the U.S. grew by 23%, from 8.7 million in 2000 to 10.7 million in 2021.
For a downloadable spreadsheet of these findings, see “ U.S. Hispanic population data (detailed tables) .”
Note: Figures greater than 1 million are rounded to the nearest 100,000; other figures greater than 100,000 are rounded to the nearest 10,000; figures that are less than or equal to 100,000 and greater than 25,000 are rounded to the nearest 5,000.
Source: Pew Research Center tabulations of the 2000 census (5% IPUMS) and the 2010 and 2021 American Community Surveys (1% IPUMS).
The following key facts compare demographic and economic characteristics of the Mexican-origin population in the U.S. with the characteristics of U.S. Hispanics and the U.S. population overall. They are based on Pew Research Center tabulations of the 2021 American Community Survey.
- Among Hispanics in the U.S., 32% are foreign born, compared with 29% of U.S. Mexicans.
- 62% of foreign-born Mexicans have been in the U.S. for over 20 years, and 35% of foreign-born Mexicans are U.S. citizens.
- 20% of U.S. Hispanics ages 25 and older have obtained at least a bachelor’s degree, compared with 15% of Mexicans.
- Among Mexicans ages 25 and older, the U.S. born are more likely than the foreign born to have a bachelor’s degree or higher (21% vs. 9%).
- Among U.S. Hispanics and Mexicans, the median annual personal earnings for those ages 16 and older was $30,000.
- Looking at full-time, year-round workers, U.S. Hispanics earned $40,000, while Mexicans also earned $40,000.
- The share of U.S. Hispanics overall who live in poverty is 18%. The share is the same for Mexicans.
- 18% of U.S.-born Mexicans live in poverty, as do 17% of foreign-born Mexicans.
- The rate of homeownership among U.S. Hispanic households is 51%, compared with 53% for Mexicans.
- Among Mexicans in the U.S., rates of homeownership are 54% for the U.S. born and 53% for foreign born.
- The Mexican population is concentrated in California (34%), Texas (26%), Arizona (5%), Illinois (5%) and Colorado (2%).
- The median age of U.S. Hispanics (29.5) is similar to that of Mexicans (27.9) and lower than that of the U.S. population (37.8).
- U.S. Hispanics ages 18 and older are about as likely to be married (46%) as Mexicans (47%).
- Among Mexicans ages 18 and older, those who are foreign born are more likely to be married than U.S.-born Mexicans (62% vs. 37%).
- 6% of U.S. Hispanic females ages 15 to 44 gave birth in the 12 months prior to the July 2021 American Community Survey. That was similar to the rate for Mexican females (7%).
- 72% of U.S. Hispanics ages 5 and older speak only English at home or speak English at least “very well,” compared with 74% of Mexicans.
- Meanwhile, 67% of Hispanic adults are English proficient, as are 69% of Mexican adults.
Note: This is an update of a fact sheet originally published in September 2019, which former Research Analyst Antonio Flores contributed to and co-wrote.
Pew Research Center’s fact sheets on U.S. Latinos and the accompanying blog post examine the Latino population of the United States overall and by its 17 largest origin groups – Mexicans, Puerto Ricans, Salvadorans, Dominicans, Cubans, Guatemalans, Colombians, Hondurans, Spaniards, Ecuadorians, Peruvians, Venezuelans, Nicaraguans, Argentines, Panamanians, Chileans and Costa Ricans. These sheets provide detailed geographic, demographic and economic characteristics for all Latinos and for each Latino origin group. They are based on the Center’s tabulations of the U.S. Census Bureau’s 2010 and 2021 American Community Survey (ACS) and the 2000 U.S. decennial census.
The ACS is the largest household survey in the United States, with a sample of more than 3 million addresses . It covers the topics previously covered in the long form of the decennial census. The ACS is designed to provide estimates of the size and characteristics of the resident population, which includes persons living in households and group quarters. For more about the ACS, including the sampling strategy and associated error, see the 2010 or 2021 American Community Survey’s Accuracy of the Data document provided by the Census Bureau.
The specific data sources for these fact sheets are the 1% samples of the 2010 and 2021 ACS Integrated Public Use Microdata Series (IPUMS) provided by the University of Minnesota and the 5% sample of the 2000 decennial census. IPUMS assigns uniform codes, to the extent possible, to data collected by the decennial census and the ACS from 1850 to 2021. For more information about IPUMS, including variable definition and sampling error, please visit the “ IPUMS Documentation and User Guide .”
Due to differences in the way in which IPUMS and Census Bureau adjust income data and assign poverty status, data provided on these topics might differ from data that are provided by the Census Bureau.
For the purposes of these fact sheets, the foreign born include those persons who identified as naturalized citizens or noncitizens and are living in the 50 states or the District of Columbia. Persons born in Puerto Rico and other outlying territories of the U.S. and who are now living in the 50 states or D.C. are included in the U.S.-born population.
1615 L St. NW, Suite 800 Washington, DC 20036 USA (+1) 202-419-4300 | Main (+1) 202-857-8562 | Fax (+1) 202-419-4372 | Media Inquiries
Research Topics
- Age & Generations
- Coronavirus (COVID-19)
- Economy & Work
- Family & Relationships
- Gender & LGBTQ
- Immigration & Migration
- International Affairs
- Internet & Technology
- Methodological Research
- News Habits & Media
- Non-U.S. Governments
- Other Topics
- Politics & Policy
- Race & Ethnicity
- Email Newsletters
ABOUT PEW RESEARCH CENTER Pew Research Center is a nonpartisan fact tank that informs the public about the issues, attitudes and trends shaping the world. It conducts public opinion polling, demographic research, media content analysis and other empirical social science research. Pew Research Center does not take policy positions. It is a subsidiary of The Pew Charitable Trusts .
Copyright 2024 Pew Research Center
Terms & Conditions
Privacy Policy
Cookie Settings
Reprints, Permissions & Use Policy
PRESS RELEASE:
Informative Research’s Ryan Kaufman Named HousingWire’s 2024 Rising Star
Source: Informative Research | Fri, 26 Apr 2024, 07:00:59 EDT
IRVINE, Calif., April 26, 2024 (SEND2PRESS NEWSWIRE) — Informative Research , a leading technology platform that delivers data-driven solutions to the lending community, announced today that Ryan Kaufman, IT Manager – Integrations, has been selected by HousingWire magazine for its annual Rising Stars award.

Kaufman’s selection highlights his exceptional leadership and significant contributions to Informative Research. His instrumental role in driving transformative change, leading the adoption of new technology and developing proprietary integrations and solutions has propelled the company’s growth and enhanced operational efficiency.
“Ryan’s holistic approach to improvement, from technological advancements to mentoring initiatives, underscores his commitment to excellence and positions him as a standout nominee,” said Informative Research SVP of Information Technology Ajay Trilokeshwaran. “His ability to leverage technology and develop tailored solutions, as demonstrated by his successful integration projects and cost-saving initiatives, truly sets him apart as a Rising Star in the mortgage industry.”
In the past year, Kaufman led groundbreaking initiatives resulting in substantial cost savings and operational improvements for Informative Research and its clients. Notably, he implemented innovative programs that prevented unnecessary credit report orders for two of the top lenders in the country, resulting in significant cost savings and enhanced operational efficiency.
Kaufman’s leadership extends beyond technological innovations; he has mentored teams and spearheaded key projects that have significantly advanced Informative Research’s capabilities and offerings. His dedication to continuous improvement and collaboration embodies the values of Informative Research and inspires those around him to strive for excellence.
The Rising Stars award program celebrates individuals under 40 who exhibit remarkable professional momentum and drive growth and change in the housing industry. HousingWire’s selection committee chose this year’s Rising Stars based on their professional achievements within their organizations, contributions to the overall housing economy, community outreach, client impact and personal success.
“The Rising Stars award is one of my favorite industry awards because it reinforces the bright future that exists in mortgage and real estate,” HousingWire Editor-in-Chief Sarah Wheeler said. “In an industry that has experienced its share of challenges and successes, these young leaders bring a fresh perspective, innovative ideas and a relentless drive to shape the future of the industry, and I am continuously impressed by the level of talent that we see each year.”
For more information about HousingWire’s Rising Stars award program and the complete list of honorees, visit https://www.housingwire.com/articles/announcing-the-2024-class-of-rising-stars/ .
About Informative Research:
Informative Research, a Stewart company, is a leading technology platform that delivers data-driven solutions to the lending community. The solutions provider currently serves mortgage companies, banks, and lenders throughout the United States. The company is recognized for streamlining the loan process with its straightforward service model, progressive solutions, and cutting-edge technology. To learn more, visit https://www.informativeresearch.com .
About HousingWire:
HousingWire is an information services company that provides unique data and research, respected business journalism and must-attend events for housing leaders to use to advance their understanding and business outcomes. Our vision is a world in which housing leaders have a complete view of the housing market, and a broad community of peers with whom they can connect. We are committed to delivering the data, analytics, media, and events that advance this vision.
Because housing is too important for narrow perspectives and missed connections. Informed housing leaders are better housing leaders. A connected housing industry is a better housing industry. And the full picture always reveals new opportunities.
News Source: Informative Research
Like, Share, Save this Press Release:
STORY FILED UNDER: Mortgage | AP | Awards and Honors | Business | California Business | Finance | FinTech | Irvine Business
DepthPR | HousingWire Rising Star
View Informative Research News Room

ABOUT THE NEWS SOURCE: Informative Research
Informative Research, a Stewart company, is a leading technology platform that delivers data-driven solutions to the lending community. The solutions provider currently serves mortgage companies, banks, and lenders throughout the United States. The company is recognized for streamlining the loan process with its straightforward service model, progressive solutions, and cutting-edge technology.
More Information: https://www.informativeresearch.com/
Follow: | LinkedIn
RSS News Feed for Informative Research
LEGAL NOTICE AND TERMS OF USE: The content of the above press release was provided by the “news source” Informative Research or authorized agency, who is solely responsible for its accuracy. Send2Press® is the originating wire service for this story and content is Copr. © Informative Research with newswire version Copr. © 2024 Send2Press (a service of Neotrope). All trademarks acknowledged. Information is believed accurate, as provided by news source or authorized agency, however is not guaranteed, and you assume all risk for use of any information found herein/hereupon.
Rights granted for reproduction by any legitimate news organization (or blog, or syndicator). However, if news is cloned/scraped verbatim, then original attribution must be maintained with link back to this page as “original syndication source.” Resale of this content for commercial purposes is prohibited without a license. Reproduction on any site selling a competitive service is also prohibited. This work is licensed under a Creative Commons Attribution-NonCommercial 3.0 Unported License .
Story Reads as of 2024-04-26 22:13:29: 439 views
CONNECT WITH SEND2PRESS ON SOCIAL MEDIA
REFERENCES: Mortgage News, Informative Research, a Stewart company, fintech, data-driven solutions to the lending community | ID:117919
University of Idaho murder suspect's alibi defense puts spotlight on cellphone data analyst
When Bryan Kohberger ’s lawyers filed an updated alibi defense la s t week , suggesting cellphone tower data will show the man suspected in the slayings of four University of Idaho students was not in the area of the crime scene when they were killed, they said they planned to turn to an Arizona-based cell data analyst for key testimony.
It wouldn’t be the first time that Sy Ray has been asked to be an expert witness in a high-profile murder trial , although he said Friday that, out of the more than 100 times he’s testified in state and federal cases, it has typically been for the prosecution.
Now, Ray’s involvement in the case of the four college students fatally stabbed in their off-campus apartment house in November 2022, which continues to stir speculation over why someone would commit the gruesome act, is putting a spotlight on his expertise after past scrutiny over his credentials.
A timeline of the Idaho stabbings
Ray declined to address the Kohberger case, as a judge issued a gag order last year preventing many involved from speaking publicly, but he said in general that it takes “competent experts with adequate experience to interpret call detail records.”
“Where the challenges come in is when there’s a different level of experience,” he added, “and some of these records can be extremely complicated.”
Ray, a former Gilbert, Arizona, police detective , founded ZetX Corp., a company specializing in cellular geolocation mapping, in 2014. In the courtroom, Ray has found himself and his mapping software, Trax, under questions about reliability before.
“I’ve seen in previous cases where his credibility has been brought into question,” said Mark Pfoff, a cellular technology expert and former sheriff’s detective in El Paso County, Colorado.
Pfoff testified for the defense in a 2022 hearing related to the case of a man accused of stalking an ex-girlfriend. But the judge barred prosecutors from using Ray’s software data.
District Court Judge Juan Villaseñor ruled that ZetX’s Trax mapping was inadmissible and based on a “sea of unreliability” after other experts found the technology to be problematic.
“For one, the Court doesn’t find Ray credible,” Villaseñor wrote , adding: “He inflated his credentials, inaccurately claiming to be an engineer.” He went on to say that Ray has “no qualifications, licenses, or credentials to support” calling himself an engineer and that there’s “no evidence that Ray’s taken any engineering classes.”

Villaseñor also took exception with how the Trax algorithm wasn’t open to “scientific scrutiny.”
“While Ray stands by his formula, it hasn’t gained traction in the scientific community,” the judge wrote. “The methodology and algorithm aren’t published or subject to peer review, and they’ve been routinely labeled as junk science by the relevant scientific community.”
Ray said on Friday that he agreed with the defense in that there was inaccuracy with the data, but the case was an anomaly. NBC News found other cases, including in Pennsylvania and Michigan , in which Ray’s credibility and data were questioned in hearings, but judges ultimately deemed them admissible.
“I absolutely stand by the product,” Ray said.
He added that the Colorado judge denigrated his background unfairly and that he was misquoted and misinterpreted about discussing how he and engineers interpret call records. He said he has gone into the field to research how a cellphone will connect to certain cell sites, which an engineer would not need to do.
“In a way, I’m doing something the engineers don’t do to figure out how to do this better,” he said Friday, adding that the Trax software is “testable” by others.
It’s unclear how many law enforcement agencies currently use Trax, but Ray in 2022 said he provided training to more than 8,000 law enforcement officers, prosecutors and defense experts. LexisNexis purchased ZetX in 2021. The data analytics company said in a statement that it is “proud to support a broad range of law enforcement agencies,” but does not disclose customer information.
According to a background of Ray’s experience filed in court documents by Kohberger’s defense team, he ended his role as a director for LexisNexis Special Services last year.
He has also appeared on various true crime television shows, including NBC’s “Dateline,” and hosts a true crime podcast with his wife, “ Socialite Crime Club ,” in which they “discuss their involvement in criminal cases from around the world and what it takes to solve complex investigations.”
Idaho alibi
In a 10-page filing Wednesday signed by Anne Taylor, Kohberger’s lead public defender, his lawyers said they would call on Ray to help corroborate their client’s alibi.
At the time of the slayings, Kohberger was a doctoral student at Washington State University and living in Pullman, Washington, about 10 miles west of Moscow, Idaho, where the University of Idaho is located.
In an affidavit following Kohberger’s arrest weeks after the killings, prosecutors said he was linked to the scene through male DNA discovered on a knife sheath left at the victims’ apartment house.
In addition, investigators said, they tracked Kohberger in the area of the home through his cellphone use and surveillance that picked up a Hyundai Elantra that they believed he was driving.
Kohberher’s alibi defense said he would go for nighttime drives, and that those only increased during the school year.
“This is supported by data from Mr. Kohberger’s phone showing him in the countryside late at night and/or in the early morning on several occasions,” they wrote. “The phone data includes numerous photographs taken on several different late evenings and early mornings, including in November, depicting the night sky.”

In the early morning hours of Nov. 13, 2022, when Kaylee Goncalves, 21; Madison Mogen, 21; Xana Kernodle, 20; and Kernodle’s boyfriend, Ethan Chapin, 20, were killed, Kohberger “was out driving” in an area south of Pullman and west of Moscow.
But, the defense team added, Ray’s testimony intends to show that “Kohberger’s mobile device did not travel east on the Moscow-Pullman Highway in the early morning hours of November 13th, and thus could not be the vehicle captured on video along the Moscow-Pullman highway near Floyd’s Cannabis shop.”
They said that Ray would be able to share further analysis that would be based on discovery provided by the prosecution, but if such information is “not disclosed, Mr. Ray’s testimony will also reveal that critical exculpatory evidence, further corroborating Mr. Kohberger’s alibi, was either not preserved or has been withheld.”
Prosecutors had said in its affidavit that a search warrant provided Kohberger’s cellphone data for the 24 hours before and after the incident, and it showed that he left his home two hours before the killings and then turned his phone off, only to turn it on again afterward, when it was seen traveling from Idaho to Pullman.

A grand jury last May indicted Kohberger on four counts of murder and burglary, and a judge entered a not guilty plea on his behalf.
A trial was expected to begin last October, but has been delayed, with a change of venue hearing scheduled for June 27.
Cellphone analysis
While further detail about how Ray would support the defense’s alibi claim is unclear, the use of such cellphone mapping technology and forensics has become a sought-after capability in legal proceedings, experts say, as prosecutors attempt to prove a defendant was at the scene of a crime. Defense teams as well may bring on their own experts to refute law enforcement’s analysis.
Kevin Horan, a retired FBI agent and co-founder of Precision Cellular Analysis, an Ohio-based firm that consults in legal cases, said mapping software generally works the same: It matches cell site information, known as call detail records, with a list of cell towers, and plots it onto a map.
He said analysts can determine from which side, or sector, of a cell tower a cellphone utilized. In criminal cases, he added, investigators can use that information to analyze whether the phone was in a certain vicinity of where the crime happened.
“Ultimately the question of where the phone was during the date and time in question is answered by the jury, who must decide based on all available evidence if the defendant and his phone were at the crime scene,” Horan said. “Cellphone evidence like this simply helps the jury draw these types of conclusions. A properly trained cellphone expert will never testify that, based on the cell data, the defendant or his phone were at a crime scene.”
Horan said Ray’s Trax mapping software has stood out from other programs because it includes an estimated coverage area of a cell site, which he finds “highly problematic and misleading,” and that only a “drive test” in which scanning gear is used can help determine a cell site’s full coverage area.
Ray said the company he founded has a database in which every cell site in the U.S. — hundreds of thousands — have been mapped, updated over time and archived.
“We’ve been drive-testing since 2014, and every drive test we do, we archive,” Ray said. “Nobody will ever be able to drive-test every cell site. It’s an impossible task.”
Horan said in general it’s imperative for the data collected to be accurate and interpreted correctly.
“People’s lives, their liberty, is on the line, and we certainly don’t want to convict someone who’s innocent or use evidence that’s questionable and could come back at a later time,” he said.
Erik Ortiz is a senior reporter for NBC News Digital focusing on racial injustice and social inequality.
- Kreyòl Ayisyen
Supervisory Highlights, Issue 33 (Spring 2024)
This is the 33rd edition of Supervisory Highlights. The findings in this report cover select examinations regarding mortgage servicing, that were completed from April 1, 2023 through December 31, 2023.
Full report
Read the full report
IMAGES
VIDEO
COMMENTS
3. Get an entry-level data analytics job. Though there are many paths to becoming a data scientist, starting in a related entry-level job can be an excellent first step. Seek positions that work heavily with data, such as data analyst, business intelligence analyst, statistician, or data engineer. From there, you can work your way up to ...
Researcher. Robert Half 3.9. Boston, MA 02110. ( Central area) $60,000 - $750,000 a year. Full-time. Easily apply. Maintain a repository of research findings and related data. The Researcher will generate information and data on corporations, industry, government entities,….
As a data researcher, your responsibilities will include: Collecting and organizing large datasets from various sources. Cleaning and preprocessing data to ensure consistency and accuracy. Performing statistical analyses and data modeling. Interpreting findings and presenting results concisely and clearly. Collaborating with stakeholders to ...
Data Researcher Job Duties. Collect and compile data from various primary and secondary sources, ensuring accuracy and relevance to research objectives. Design and implement data collection tools, such as surveys and questionnaires, tailored to specific research needs. Perform statistical analysis of collected data using software tools like ...
A data analyst is a person whose job is to gather and interpret data in order to solve a specific problem. The role includes plenty of time spent with data but entails communicating findings too. Here's what many data analysts do on a day-to-day basis: Gather data: Analysts often collect data themselves. This could include conducting surveys ...
What does a Data Researcher do? Quantitative researchers perform mathematically based technical configurations and designs that help financial services firms and investment banks make decisions while mitigating potential risk. They study, plan, develop, and deploy models and systems involving intricate and sophisticated statistical formulas.
Data analyst. Data analysts, unlike data scientists, use structured data to solve business problems. Using tools such as SQL, Python, and R, statistical analysis, and data visualization, data analysts acquire, clean, and reorganize data for analysis to spot trends that can be turned into business insights. They tend to bridge the gap between ...
Keep in mind that everyone's journey is different. The step-by-step below follows the career path of someone wanting to earn a degree, build a portfolio, apply for an entry-level role, and work up to the data scientist title. 1. Obtain the necessary education. Fifty-one percent of data scientists have a bachelor's degree, 34 percent have a ...
Data science continues to evolve as one of the most promising and in-demand career paths for skilled professionals. Today, successful data professionals understand they must advance past the traditional skills of analyzing large amounts of data, data mining, and programming skills. To uncover useful intelligence for their organizations, data ...
Responsibilities for data researcher. Perform primary and secondary health plan research, including extensive communication with payers via telephone. Collaboration with team for plan changes and formulary updates. Work with other departments on the facilitation of different data sets. Support sales in the delivery of data, reports, and ad hoc ...
People who searched for data researcher jobs in United States also searched for data analyst, data scientist, research associate, research analyst, database administrator. If you're getting few results, try a more general search term. If you're getting irrelevant result, try a more narrow and specific term.
Learn what data researchers do, how they collect, analyze, and interpret data, and what skills and education they need. See a sample job description, resume tips, and requirements for this role.
Research Assistant/Research Associate (6256U), Institute of Research on Labor and Employment - 65975. University of California, Berkeley 4.2. Berkeley, CA 94720. $33.57 - $45.50 an hour. Full-time. Communicates with government partners about data requests and other data issues. Demonstrated quantitative skills, knowledge, and experience in data ...
Oakland, CA 94601. ( Oak Tree area) $120,000 - $125,000 a year. Full-time + 1. Monday to Friday. Easily apply. Conduct data collection and analysis. Continuously promote research-based and best practices. Knowledge of research-based and best practices of the following:….
Data Analyst Salary and Job Outlook. Data analysts jobs, falling under the category of operations research analyst jobs by the U.S. Bureau of Labor Statistics, are projected to grow 23 percent by 2031. The full compensation package for a data analyst depends on a variety of factors, including but not limited to the candidate's experience and ...
The data analyst form is more about finding patterns in big columns of (structured) data, building visualizations and reports, and communicating insights. On the other hand, data scientists tend to deal with the unexpected through the use of techniques that fall in the realm of predictive analytics.
data analysis, the process of systematically collecting, cleaning, transforming, describing, modeling, and interpreting data, generally employing statistical techniques. Data analysis is an important part of both scientific research and business, where demand has grown in recent years for data-driven decision making.Data analysis techniques are used to gain useful insights from datasets, which ...
Data collection is a systematic process of gathering observations or measurements. Whether you are performing research for business, governmental or academic purposes, data collection allows you to gain first-hand knowledge and original insights into your research problem. While methods and aims may differ between fields, the overall process of ...
12. Explain the concept of data normalization and why it's important. Data normalization is a key concept for any data researcher, and interviewers want to ensure you understand its importance. Normalization is the process of organizing data in a database to minimize redundancy and improve data integrity. By demonstrating your knowledge of ...
For many researchers unfamiliar with qualitative research, determining how to conduct qualitative analyses is often quite challenging. Part of this challenge is due to the seemingly limitless approaches that a qualitative researcher might leverage, as well as simply learning to think like a qualitative researcher when analyzing data. From framework analysis (Ritchie & Spencer, 1994) to content ...
A neuroscience researcher at the school was fund to have manipulated data in his studies of the brain, according to federal investigators. By Courtney Tanner | April 26, 2024, 3:01 p.m.
The Spec Analytics Analyst is a developing professional role. Applies specialty area knowledge in monitoring, assessing, analyzing and/or evaluating processes and data. Identifies policy gaps and formulates policies. Interprets data and makes recommendations. Researches and interprets factual information.
Propose workshops for both researchers and data scientists on accessing and using long-term data sets, with dissemination of the products to the scientific community (e.g., ESIIL). NSF seeks to support diverse teams of investigators and institutions in the scientific activities that it funds. Submissions that benefit and involve the full ...
The specific data sources for these fact sheets are the 1% samples of the 2010 and 2021 ACS Integrated Public Use Microdata Series (IPUMS) provided by the University of Minnesota and the 5% sample of the 2000 decennial census. ... public opinion polling, demographic research, media content analysis and other empirical social science research ...
Research Data Analyst 3. University of California, Davis. Hybrid work in Davis, CA 95616. $80,300 - $147,500 a year. Full-time. Experience with scientific manuscript writing and data analysis in an academic or research setting. Experience with quantitative and qualitative research…. Posted 11 days ago ·. More...
NTT Research, based in Silicon Valley, is pursuing potentially groundbreaking research in vital areas including all-optical networking and enhanced data security.
IRVINE, Calif., April 26, 2024 (SEND2PRESS NEWSWIRE) -- Informative Research, a leading technology platform that delivers data-driven solutions to the lending community, announced today that Ryan ...
University of Idaho murder suspect's alibi defense puts spotlight on cellphone data analyst. Bryan Kohberger's defense team said it will turn to an Arizona-based cellphone data expert, Sy Ray, who ...
Since data science is gaining momentum in India, many job opportunities are available. Starting in a related entry-level job can be an excellent first step to becoming a data scientist. Seek positions that work heavily with data, such as data analyst, business intelligence analyst, statistician, or data engineer.
/ Data & Research / Reports Category: Supervisory Highlights Supervisory Highlights, Issue 33 (Spring 2024) APR 24, 2024. This is the 33rd edition of Supervisory Highlights. The findings in this report cover select examinations regarding mortgage servicing, that were completed from April 1, 2023 through December 31, 2023.