Maths with David
Problem solving. draw diagram.
In mathematics, diagrams are often a useful way of organising information and help us to see relationships. A diagram can be a rough sketch, a number line, a tree diagram or two-way table, a Venn diagram, or any other drawing which helps us to tackle a problem.
Labels (e.g. letters for vertices of a polygon) are useful in a diagram to help us be able to refer to items of interest.
A diagram can be updated as we find out new information.
Examples of using a diagram to tackle a problem
First we will read all three examples and have a quick think about them and then we will look at how a diagram can help us with each one:
Restaurant Example
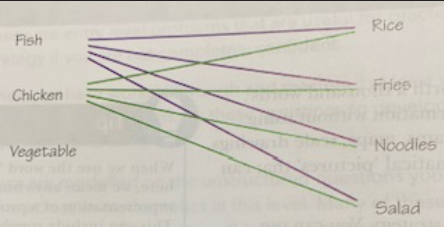
A restaurant offers a “business lunch” where people can choose either fish or chicken or vegetables for their main course, accompanied by a side portion of rice, chips, noodles or salad. How many different combined meals can they choose between?
Rectangle Area Example
To the nearest centimetre, the length and width of a rectangle is 10cm and 8cm.
- What are the limits of accuracy for the area of the rectangle?
- the lengths of the sides?
Prime Numbers Example
Masha says that if she writes out numbers in rows of six then all of the prime numbers will either be in the column that has 1 at the top, or they will be in the column that has 5 at the top. How can you find out if she is correct?
Worked Solutions to Examples
One way to tackle this would be to write out a list, being systematic to ensure that all combinations are considered.
Another is to draw out a diagram like the one below. As shown, you actually don’t need to finish the diagram in order to conclude how many combinations there are:
You could also use a 2-way table as shown below:
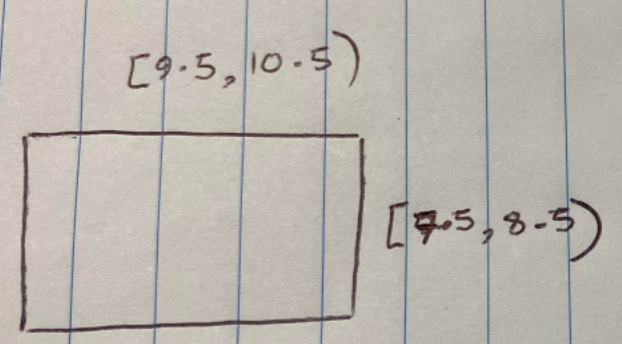
Drawing a rough sketch of the rectangle labelled with the boundaries of its side lengths can really help us to visualise the situation here:
It can then be helpful to draw sketches of the smallest possible rectangle and the largest possible rectangle:
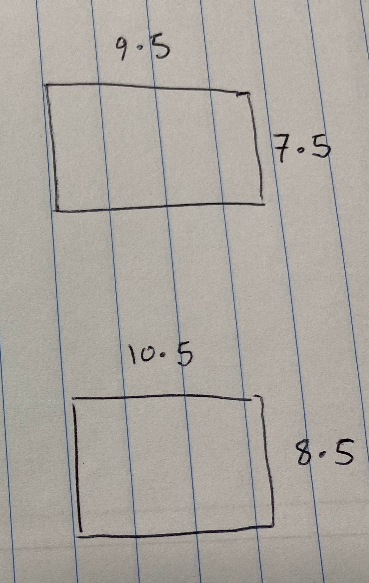
We can now answer the questions, so (a) the smallest possible area is 7.5 x 9.5 = 71.25cm 2 and the largest “possible” area is 8.5 x 10.5 = 89.25cm 2 . So the limits of accuracy are [71.25,89.25) cm 2 .
For (b), we can see from the sketches that the difference between the minimum and the maximum values is 1cm in the case of both the width and the lenght. For part (ii) we simply subtract the numbers above to give 89.25-71.25 = 18cm 2 .
Here, listing out numbers, especially for the first few is going to be helpful. We should list them as specified in the question, and we can highlight the prime numbers:
Because we know that no even numbers other than 2 are prime, we know that further prime numbers cannot be in the second, fourth or sixth column. The third column keeps adding 6s, so it is adding multiples of 3 to multiples of 3, so the numbers will always be divisible by 3, so further numbers in this column cannot be prime. So she is correct that the prime numbers must be in the first or the fifth column.
31 Questions of increasing difficulty
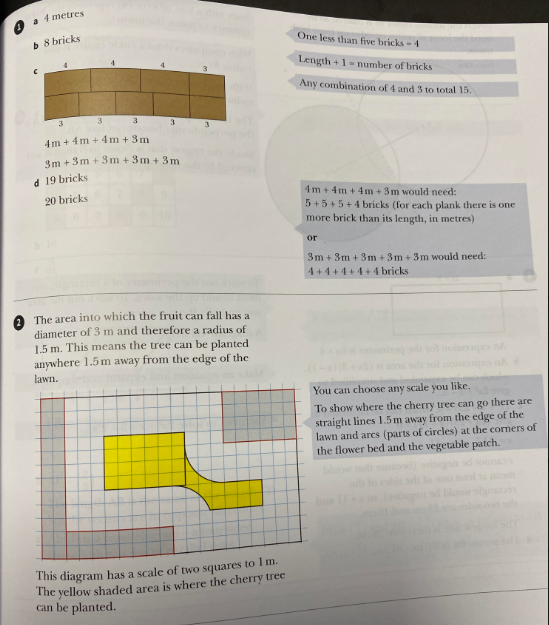
1.) In a cement factory, cement bags are placed on pallets made of planks of wood and bricks. The number of bricks needed to make a pallet is calculated as being one more than the length of the plank in metres (as shown below):
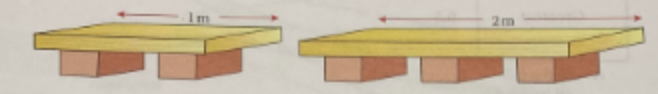
a.) What length of pallet uses five bricks?
b.) If the pallet is 7m long, how many bricks are used in it?
The factory needs pallets with a total length of 15m for the next batch of cement. It has planks of wood that are 4m long and 3m long.
c.) What combinations of planks can they have?
d.) How many bricks would be needed for each combination?
2.) Sonia wants to plant an apple tree in her garden. She needs to make sure that there is a circular area of lawn with diameter 3m around the base of the tree, so that all of the fruit will fall onto the lawn area.
Below is a (not to scale) sketch of Sonia’s garden:
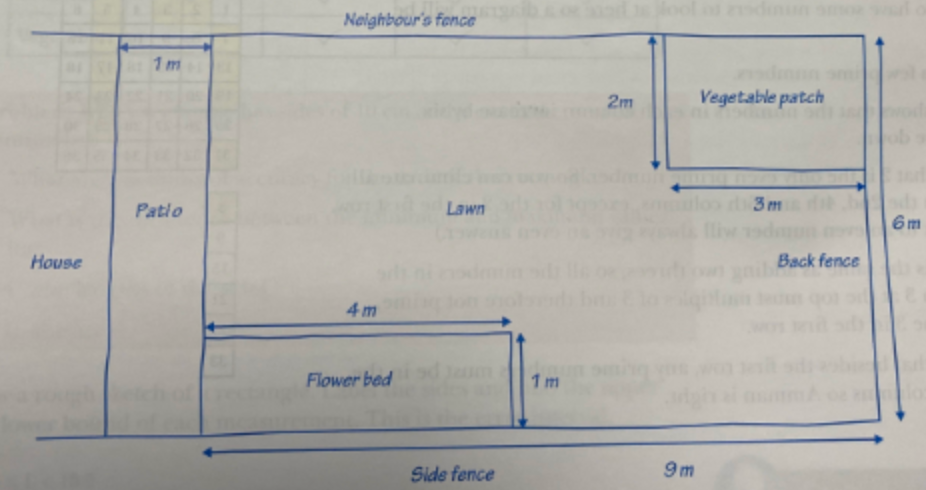
Where could the tree be placed to meet her requirements?
3.) The diagram below represents towns A and B in a mountainous region:
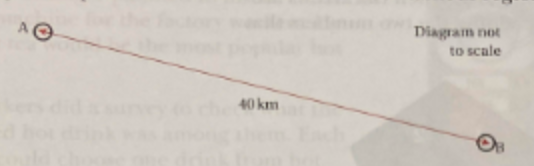
The mountain rescue helicopters from both towns will always be sent to rescue any casualty within a 25km radius of town A or town B. The fire and rescue team from town B will travel to any accident scene closer to town B than town A.
Shade the region that the helicopters and town B’s fire an rescue team will both cover.
4.) A rectangle has length (2x+3) and width (x-1).
a.) Write an expression for the perimeter of the rectangle.
b.) Write an expression for the area of the rectangle.
The area of the rectangle is 250cm 2 .
c.) How long is the longest side?
d.) What is the perimeter of the rectangle?
5.) The probability that Hannah catches the 6.30am train to the city is 0.7.
If she misses the train, she will be late for work.
The probability that the train will be late is 0.15.
If the train is late, she will be late for work.
What is the probability that Hannah will be on time for work on a particular day?
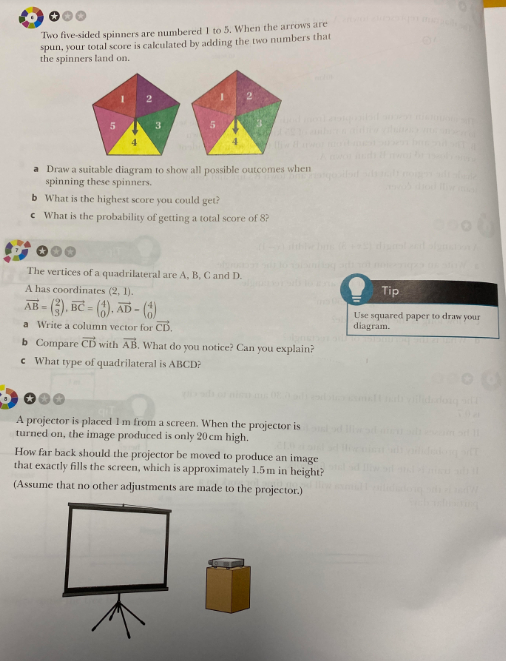
6.) Two five-sided spinners are numbered 1 to 5. When the arrows are spun, your total score is calculated by adding the two numbers that the spinners land on.
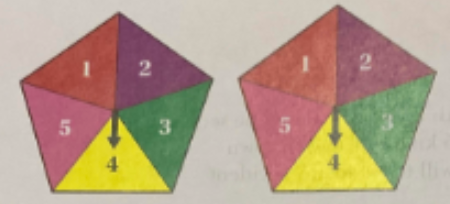
a.) Draw a suitable diagram to show all possible outcomes when spinning these spinners.
b.) What is the highest score you could get?
c.) What is the probability of getting a total score of 8?
Worked Solutions to Questions

Share this:

- Already have a WordPress.com account? Log in now.
- Subscribe Subscribed
- Copy shortlink
- Report this content
- View post in Reader
- Manage subscriptions
- Collapse this bar

Fun teaching resources & tips to help you teach math with confidence

Math Strategies: Problem Solving by Drawing a Picture
I am a very visual learner . Whenever I am facing a word problem of any kind, my initial reaction is to draw a picture. Even if it is a fairly simple problem and I think I already know how to solve it (or even already know the answer), I will almost always still draw a picture . but even if you don’t think of yourself as a “visual learner,” drawing pictures (or other visuals) is still one of the most powerful strategies. Brain research shows that when solving math problems, the ‘visual’ parts of our brain light up, even when we don’t draw a picture! So rest assured, problem solving by drawing a picture is helpful for any student!

–>Pssst! Do your kids need help making sense of and solving word problems? You might like this set of editable word problem solving templates ! Use these with any grade level, for any type of word problem :
Solve Math Problems by Drawing a Picture:
Maybe I’m drawn to this strategy because I’m such a great artist…no, that’s definitely not it! I believe it is because seeing a visual representation of the problem can put things in perspective, help organize the information, and enable students to make connections that may not have been otherwise seen.
Because of the impact of visuals on our brain and our learning, this is an important and helpful problem solving strategy . Especially if you are stuck and don’t know where to go or what to do. Then you have nothing to lose, right?
When I was teaching high school, I would often encourage students to draw a picture when working on distance/rate/time problems .
It is very easy to get bogged down in all the details and numbers, especially if the problem includes unnecessary information (details that you don’t really need to know in order to solve it). Wading through everything you’re given and making sense of what’s important can be easier when you draw a picture!
It’s also incredibly important to draw a picture when working on geometry tasks, such as Pythagorean theorem problems or similar triangles and indirect measurement . Even if you know how to solve it without a picture, you will greatly increase you chances of a careless mistake if you don’t take the extra five seconds to draw a picture.
One important thing to remember, however, is that the picture does not need to be pretty . In fact, in some cases it may not even be a picture, just a visual representation of the information.
And that’s ok! The point is to help you solve the math problem , not to win an art award. ( Thank goodness, because seriously, I’m no artist! ).
If you would like to discuss this strategy with your students and help encourage them to use it when appropriate, I’ve created a short set of problems to do just that!
These word problems could be used with grades 2-4 and include a page that specifically states, “Draw a picture…” and then another page of problems were it would be useful to draw a picture, but it is not explicitly stated.
The goal is to get students used to organizing the information in a meaningful way to help them better think about and/or solve the problem.

{Click HERE to go to my shop and download the Problem Solving by Drawing a Picture Practice Problems !}
What do you think? Do you use this problem solving strategy or encourage your students to try it? Do you think it’s helpful?
Here are the other articles in this series on problem solving:
- Problem Solve using Guess and Check
- Problem Solve by Finding a Pattern
- Problem Solve by Making a List
- Problem Solve by Solving an Easier Problem
- Problem Solve by Working Backwards
Thanks so much for your Math freebie. Drawing pictures is a great way to access student understanding. Arlene LMN Tree
Thanks Arlene! Yes, I agree! Students have to show what they know to be able to draw an appropriate picture and solve. Thanks for stopping by! 🙂
- Pingback: Problem Solving Strategy: Draw a Picture - Teach Junkie
- Pingback: Word Problems – Teaching Math
Comments are closed.
Similar Posts

3 Simple Number Talk Ideas to Encourage Deep Math Thinking

{FREE} Multiplication Equation Search: Unique Challenge for Kids

{FREE} Pythagorean Theorem Word Problems Task Cards

Compare Decimals Cut & Paste Sort {FREE!}

Subtracting Mixed Numbers Printable Board Game {FREE}

How to Teach Subtraction with Regrouping: Simple Strategy
Find more resources to help make math engaging, join 165k+ parents & teachers.
Who learn new tips and strategies, as well as receive engaging resources to make math fun!

- Privacy Policy
Math Time Doesn't Have to End in Tears
Join 165,000+ parents and teachers who learn new tips and strategies, as well as receive engaging resources to make math fun. Plus, receive my guide, "5 Games You Can Play Today to Make Math Fun," as my free gift to get you started!
- Try for free
Problem Solving: Draw a Picture

Problem-solving is a critical 21st Century and social-emotional skill
Looking for more resources on 21st Century skills and social-emotional learning? Find them in our FutureFit resources center .
What Is It?
The draw a picture strategy is a problem-solving technique in which students make a visual representation of the problem. For example, the following problem could be solved by drawing a picture:
A frog is at the bottom of a 10-meter well. Each day he climbs up 3 meters. Each night he slides down 1 meter. On what day will he reach the top of the well and escape?

Why Is It Important?
Drawing a diagram or other type of visual representation is often a good starting point for solving all kinds of word problems . It is an intermediate step between language-as-text and the symbolic language of mathematics. By representing units of measurement and other objects visually, students can begin to think about the problem mathematically . Pictures and diagrams are also good ways of describing solutions to problems; therefore they are an important part of mathematical communication.
How Can You Make It Happen?
Encourage students to draw pictures of problems at the very beginning of their mathematical education. Promote and reinforce the strategy at all subsequent stages. Most students will naturally draw pictures if given the slightest encouragement.
Introduce a problem to students that will require them to draw a picture to solve. For example:
Marah is putting up a tent for a family reunion. The tent is 16 feet by 5 feet. Each 4-foot section of tent needs a post except the sides that are 5 feet. How many posts will she need?
Demonstrate that the first step to solving the problem is understanding it. This involves finding the key pieces of information needed to figure out the answer. This may require students reading the problem several times or putting the problem into their own words.
16 feet by 5 feet 1 post every 4 feet, including 1 at each corner No posts on the short sides
Choose a Strategy
Most often, students use the draw a picture strategy to solve problems involving space or organization, but it can be applied to almost all math problems. Also students use this strategy when working with new concepts such as equivalent fractions or the basic operations of multiplication and division.
In This Article:
Featured high school resources.

Related Resources

About the author

TeacherVision Editorial Staff
The TeacherVision editorial team is comprised of teachers, experts, and content professionals dedicated to bringing you the most accurate and relevant information in the teaching space.
- Grades 6-12
- School Leaders
Live Event: Cool Ways to Teach with Graphic Novels!
Teaching Math Word Problems with Pictures
Help your students visualize their answers.

If you google word problem jokes, this one will pop up a lot:
“If you have 4 pencils and I have 7 apples, how many pancakes will fit on the roof?
Purple, because aliens don’t wear hats.”
It’s hilarious because it’s true! Many of our students see nonsense in word problems. They not only have to figure out what the word problem is asking them to do, but then they have to actually solve it. It’s a process. However, if we want them to internalize the concept, not just the numbers, pictures can help! Visuals can help students comprehend meaning when the words aren’t making sense to them. Don’t underestimate the power of teaching word problems with pictures. Here are a few easy ways to incorporate visuals into everyday math:
The power of “acting it out”
Before you go from manipulatives to drawing, try having students act out problems. If the problems involve eating, bring in food and have a student actually act like they are in the story problem. If the problem involves a specific number of boys and girls, have that many students get up and show the class what is going on in the problem. Taking this step will help students visualize the problem and think about the actions rather than just guessing if they should add, subtract, multiply, or divide.
[contextly_auto_sidebar]
Getting ready to draw
When you’re ready to start solving word problems with pictures, follow Jan Rowe’s steps :

- Read the entire problem: Get all the facts and underline keywords.
- Answer the question: What am I looking for?
- Draw a picture or diagram: Visualize as a real-world situation.
- Solve the problem: Set up the equation and solve.
- Check your solution: Is this answer reasonable?
Drawing as a step of the process
Visual representations are a good starting point for word problems because it is an intermediate step between language-as-text and the symbolic language of math . Drawing lowers the affective filter because it can be less stressful. We aren’t stepping straight into that equation; we are just drawing to figure out what the question is actually asking us. Remind students that we are not in art class. It is perfectly OK for your math pictures to be just scribbles as long as you know what they represent. Another great perk of the “Draw a Picture” strategy is that you, as a teacher, can really step inside the student’s brain to see how their mathematical brain works. Encourage labeling so that you can catch misconceptions right away. These drawings can lead to great math talk conversations, which build that academic language that we all want to hear.
Jayden had two boxes of books with twelve books in each box. He gave four books to his sister. How many books did Jayden keep for himself?
Draw a picture:

Try photography instead of drawing
Story problems are grounded in reading. Photograph Math is an activity that can help visual learners grasp the math skill first, then add in the language. All you’ll need is a camera (or phone) to take pictures. Here’s how it works:
- Students brainstorm the ways in which, and the places where, they use math.
- They stage a photograph representing one of these ideas.
- Students write their own real-life word problems to go with their posed photograph(s).
- Students take a photograph of the menu inside the cafeteria. They write problems that help them figure out how much money they need to get specific lunches, snacks, or drinks. Extension: Think about how much you would need to get a snack every day, for a week, etc.
- Someone might take a photo of a number on a library book. Then try to figure out what value that number would have based on the number of digits and round the number to the nearest whole, tenths, or hundredth.
- Students take a photo of your stash of whiteboards markers. They could write problems about the amount of each color you have. They may choose to think about what happens if another teacher borrows a certain number of markers, etc.
Photograph math can help students to start thinking like a mathematician in all aspects of life. If students begin to see the math around them, then they can truly begin to comprehend the story problems that we present to them in class.
Read a math picture book
Remember when I said story problems are grounded in reading? Why not use actual stories? Children’s picture books can provide a rich context from which to begin mathematical investigations . As students see math concepts play out in stories and illustrations, they are engaged and better able to construct meaning. Seeing the problem-solving process in action through a book can serve as a model for students when they go off on their own to solve problems. Here is a list of 16 picture books about math .
Assign math as picture prompts
Consider starting each week with a relevant picture prompt. Sometimes, the picture is of a mathematical error we came across in real life. The challenge to students is to figure out the mistake. Other times, we simply provide an image and challenge students to come up with a story problem to accompany it. Giving students ownership of these problems can strengthen and extend their comprehension of story problems.
- Put up a sign of a price mistake in a store. Then write on the board: “Ms. Caudill saw this sign at Walmart this weekend and laughed. Why? How might you fix it?”
- Show students the following prompt: Write a story problem using the photo and the following word bank: apples, tomatoes, sweet potatoes, pound, gallon, farmer’s market.
The truth is, story problems are challenging for all students. We have to find ways to make the story problems relative to students’ lives if we want them to succeed.
How do you teach word problems with pictures? Share in the comments below.
Want even more strategies for teaching word problems check out 14 effective ways to help your students conquer math word problems ., want more articles like this make sure to sign up for my weekly newsletter for third grade teachers .

You Might Also Like

14 Effective Ways to Help Your Students Conquer Math Word Problems
If a train leaving Minneapolis is traveling at 87 miles an hour... Continue Reading
Copyright © 2024. All rights reserved. 5335 Gate Parkway, Jacksonville, FL 32256
Strategy: Draw a Picture

Math Problem Solving Strategy: Draw a Picture to Solve a Problem

This is another free resource for teachers from The Curriculum Corner.
Looking to help your students learn to draw a picture to solve a problem?
This math problem solving strategy can be practiced with this set of resources.
Math Problem Solving Strategies
This is one in a series of resources to help you focus on specific problem solving strategies in the classroom.
Within this download, we are offering you a range of word problems for practice.
Each page provided contains a single problem solving word problem.
Below each story problem you will find a set of four steps for students to follow when finding the answer.
This set will focus on the draw a picture strategy for math problem solving.
What are the 4 problem solving steps?
After carefully reading the problem, students will:
- Step 1: Circle the math words.
- Step 2: Ask yourself: Do I understand the problem?
- Step 3: Solve the problem using words and pictures below.
- Step 4: Share the answer along with explaining why the answer makes sense.

Draw a Picture to Solve a Problem Word Work Questions
The problems within this post help children to see how they can draw pictures when working on problem solving.
These problems are for first and second grade students.
Within this collection you will find two variations of each problem.
You will easily be able to create additional problems using the wording below as a base.
The problems include the following selections:
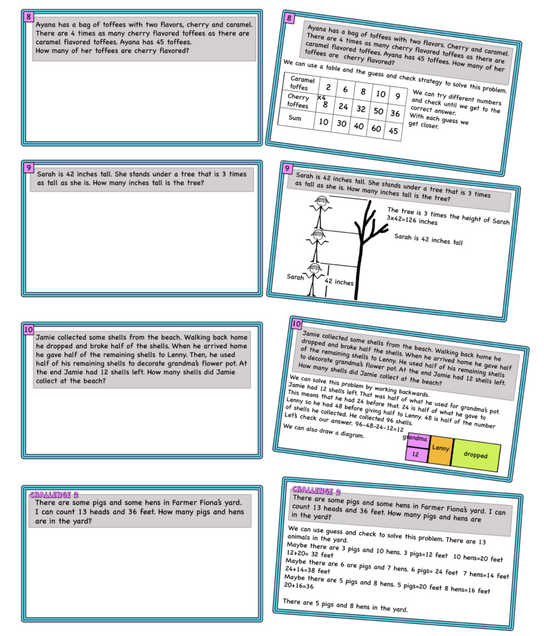
- Chicken and Cows – guess and check type problems
- Fruit Trees – multiple step simple addition and subtraction problems
- My Marbles – involves writing a simple fraction
- Art Box – simple subtraction
- Snowman – simple addition
- Cookies – multiple step problems
- Pillows & Buttons – simple multiplication (by 2, 5, 10)
- Chicken Nuggets – simple multiplication (by 2, 5, 10)
- Trading Cards – multiplication
- Flowers – multiplication
Extend the learning by encouraging your students to draw a picture and write an equation!
You can download this set of Draw a Picture to Solve a Problem pages here:
Problem Solving
You might also be interested in the following free resources:
- Addition & Subtraction Word Problem Strategies
- Fall Problem Solving
- Winter Problem Solving
- Spring Problem Solving
- Summer Problem Solving
As with all of our resources, The Curriculum Corner creates these for free classroom use. Our products may not be sold. You may print and copy for your personal classroom use. These are also great for home school families!
You may not modify and resell in any form. Please let us know if you have any questions.
Farm Fun Writing Word Problems Activity - The Curriculum Corner 123
Thursday 30th of January 2020
[…] Solving Problems Using Pictures (you will find word problems similar to the ones students might write within this set) […]
Strategy: Make a Table - The Curriculum Corner 123
Monday 27th of January 2020
[…] Draw a Picture to Solve a Problem […]
Strategy: Write a Number Sentence - The Curriculum Corner 123
[…] Drawing Pictures to Solve Problems […]
- PRINT TO PLAY
- DIGITAL GAMES

Problem-Solving Strategies
October 16, 2019
There are many different ways to solve a math problem, and equipping students with problem-solving strategies is just as important as teaching computation and algorithms. Problem-solving strategies help students visualize the problem or present the given information in a way that can lead them to the solution. Solving word problems using strategies works great as a number talks activity and helps to revise many skills.
Problem-solving strategies
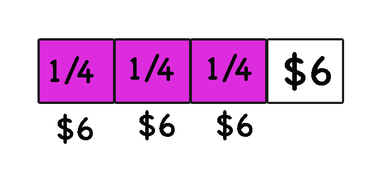
1. create a diagram/picture, 2. guess and check., 3. make a table or a list., 4. logical reasoning., 5. find a pattern, 6. work backward, 1. create a diagram/draw a picture.
Creating a diagram helps students visualize the problem and reach the solution. A diagram can be a picture with labels, or a representation of the problem with objects that can be manipulated. Role-playing and acting out the problem like a story can help get to the solution.
Alice spent 3/4 of her babysitting money on comic books. She is left with $6. How much money did she make from babysitting?
2. Guess and check
Teach students the same strategy research mathematicians use.
With this strategy, students solve problems by making a reasonable guess depending on the information given. Then they check to see if the answer is correct and they improve it accordingly. By repeating this process, a student can arrive at a correct answer that has been checked. It is recommended that the students keep a record of their guesses by making a chart, a table or a list. This is a flexible strategy that works for many types of problems. When students are stuck, guessing and checking helps them start and explore the problem. However, there is a trap. Exactly because it is such a simple strategy to use, some students find it difficult to consider other strategies. As problems get more complicated, other strategies become more important and more effective.
Find two numbers that have sum 11 and product 24.
Try/guess 5 and 6 the product is 30 too high
adjust to 4 and 7 with product 28 still high
adjust again 3 and 8 product 24
3. Make a table or a list
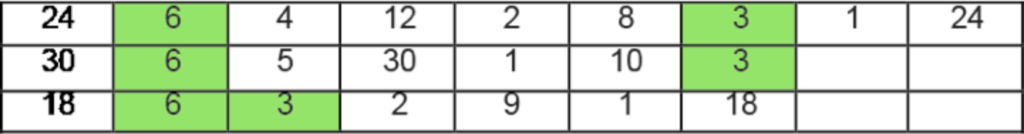
Carefully organize the information on a table or list according to the problem information. It might be a table of numbers, a table with ticks and crosses to solve a logic problem or a list of possible answers. Seeing the given information sorted out on a table or a list will help find patterns and lead to the correct solution.
To make sure you are listing all the information correctly read the problem carefully.
Find the common factors of 24, 30 and 18
Logical reasoning is the process of using logical, systemic steps to arrive at a conclusion based on given facts and mathematic principles. Read and understand the problem. Then find the information that helps you start solving the problem. Continue with each piece of information and write possible answers.
Thomas, Helen, Bill, and Mary have cats that are black, brown, white, or gray. The cats’ names are Buddy, Lucky, Fifi, and Moo. Buddy is brown. Thoma’s cat, Lucky, is not gray. Helen’s cat is white but is not named Moo. The gray cat belongs to Bill. Which cat belongs to each student, and what is its color?
A table or list is useful in solving logic problems.
Since Lucky is not gray it can be black or brown. However, Buddy is brown so Lucky has to be black.
Buddy is brown so it cannot be Helen’s cat. Helen’s cat cannot be Moo, Buddy or Lucky, so it is Fifi.
Therefore, Moo is Bill’s cat and Buddy is Mary’s cat.
5. Find a pattern.
Finding a pattern is a strategy in which students look for patterns in the given information in order to solve the problem. When the problem consists of data like numbers or events that are repeated then it can be solved using the “find a pattern” problem-solving strategy. Data can be organized in a table or a list to reveal the pattern and help discover the “rule” of the pattern.
The “rule” can then be used to find the answer to the question and complete the table/list.
Shannon’s Pizzeria made 5 pizzas on Sunday, 10 pizzas on Monday, 20 pizzas on Tuesday, and 40 pizzas on Wednesday. If this pattern continues, how many pizzas will the pizzeria make on Saturday?
6. Working backward
Problems that can be solved with this strategy are the ones that list a series of events or a sequence of steps .
In this strategy, the students must start with the solution and work back to the beginning. Each operation must be reversed to get back to the beginning. So if working forwards requires addition, when students work backward they will need to subtract. And if they multiply working forwards, they must divide when working backward.
Mom bought a box of candy. Mary took 5 of them, Nick took 4 of them and 31 were given out on Halloween night. The next morning they found 8 pieces of candy in the box. How many candy pieces were in the box when mom bought it.
For this problem, we know that the final number of candy was 8, so if we work backward to “put back” the candy that was taken from the box we can reach the number of candy pieces that were in the box, to begin with.
The candy was taken away so we will normally subtract them. However, to get back to the original number of candy we need to work backward and do the opposite, which is to add them.
8 candy pieces were left + the 31 given out + plus the ones Mary took + the ones Nick took
8+31+5+4= 48 Answer: The box came with 48 pieces of candy.
Selecting the best strategy for a problem comes with practice and often problems will require the use of more than one strategies.
Print and digital activities
I have created a collection of print and digital activity cards and worksheets with word problems (print and google slides) to solve using the strategies above. The collection includes 70 problems (5 challenge ones) and their solution s and explanations.
sample below
How to use the activity cards
Allow the students to use manipulatives to solve the problems. (counters, shapes, lego blocks, Cuisenaire blocks, base 10 blocks, clocks) They can use manipulatives to create a picture and visualize the problem. They can use counters for the guess and check strategy. Discuss which strategy/strategies are better for solving each problem. Discuss the different ways. Use the activities as warm-ups, number talks, initiate discussions, group work, challenge, escape rooms, and more.
Ask your students to write their own problems using the problems in this resource, and more, as examples. Start with a simple type. Students learn a lot when trying to compose a problem. They can share the problem with their partner or the whole class. Make a collection of problems to share with another class.
For the google slides the students can use text boxes to explain their thinking with words, add shapes and lines to create diagrams, and add (insert) tables and diagrams.
Many of the problems can be solved faster by using algebraic expressions. However, since I created this resource for grades 4 and up I chose to show simple conceptual ways of solving the problems using the strategies above. You can suggest different ways of solving the problems based on the grade level.
Find the free and premium versions of the resource below. The premium version includes 70 problems (challenge problems included) and their solutions
There are 2 versions of the resource
70 google slides with explanations + 70 printable task cards
70 google slides with explanations + 11 worksheets
You might also like
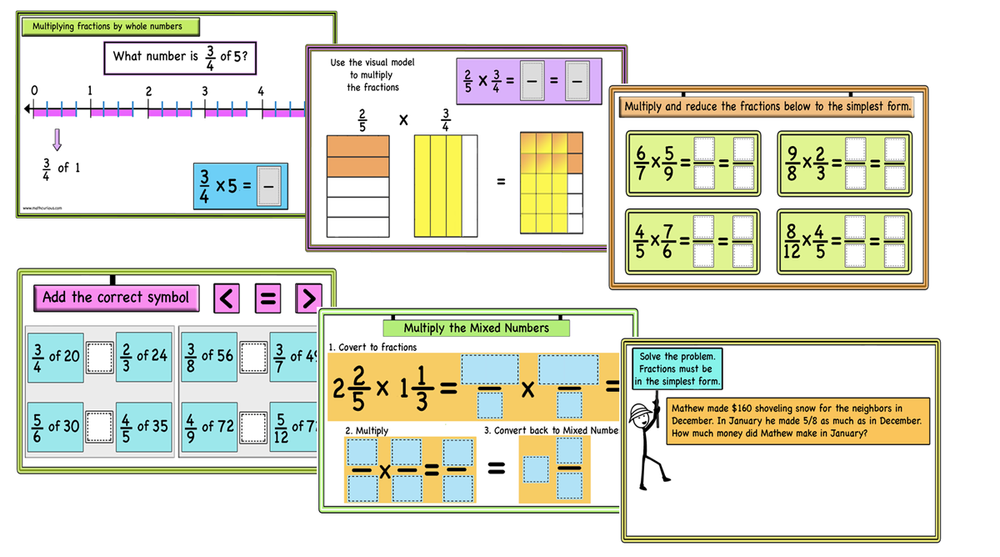
Multiplying fractions/mixed numbers/simplifying
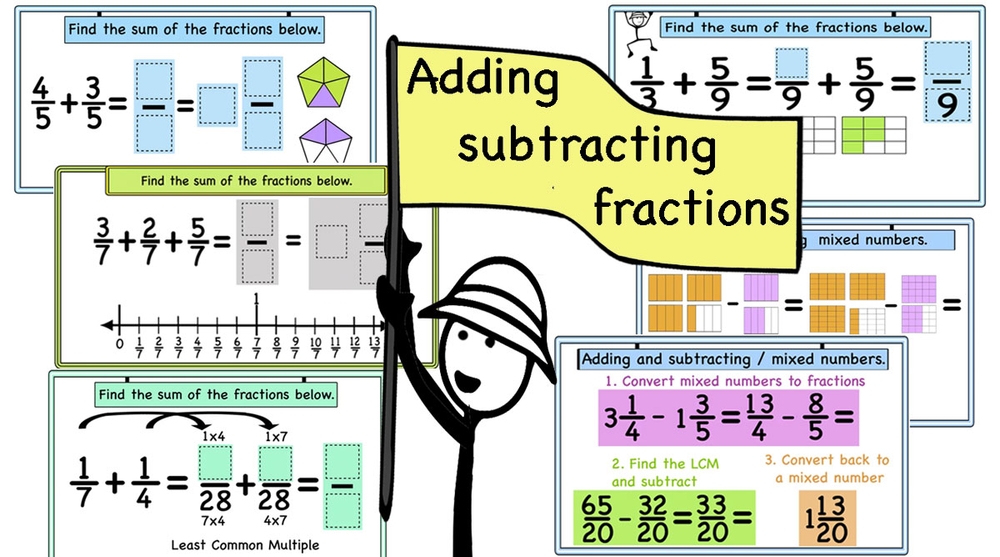
Adding and subtracting fractions
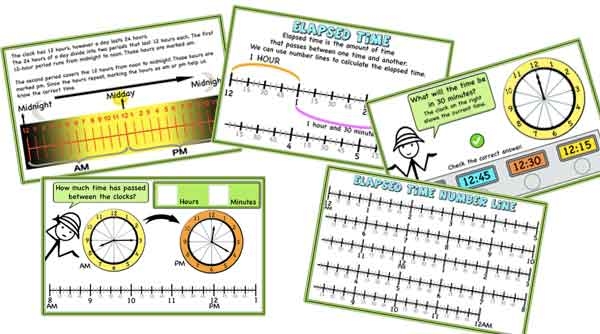
AM/PM, 24-hour clock, Elapsed Time – ideas, games, and activities
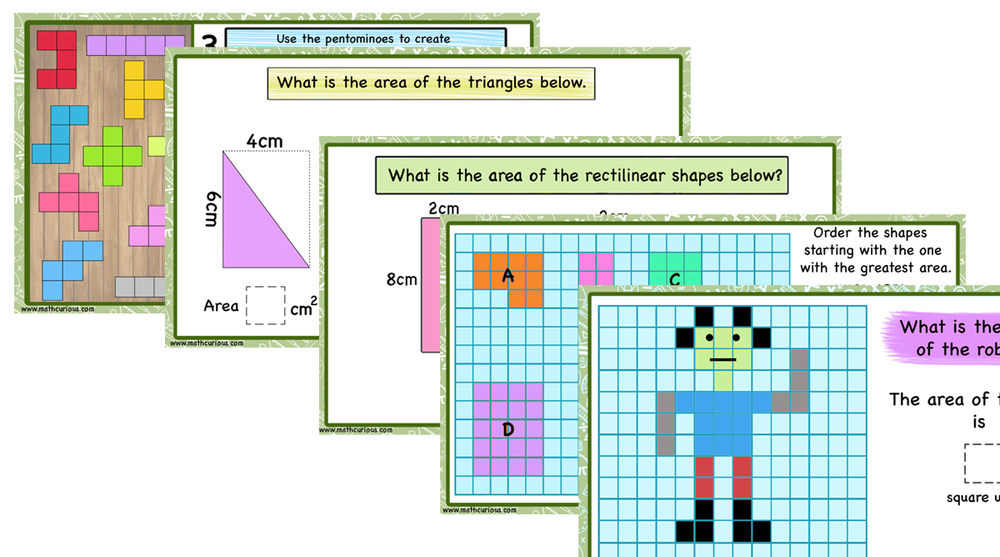
Teaching area, ideas, games, print, and digital activities
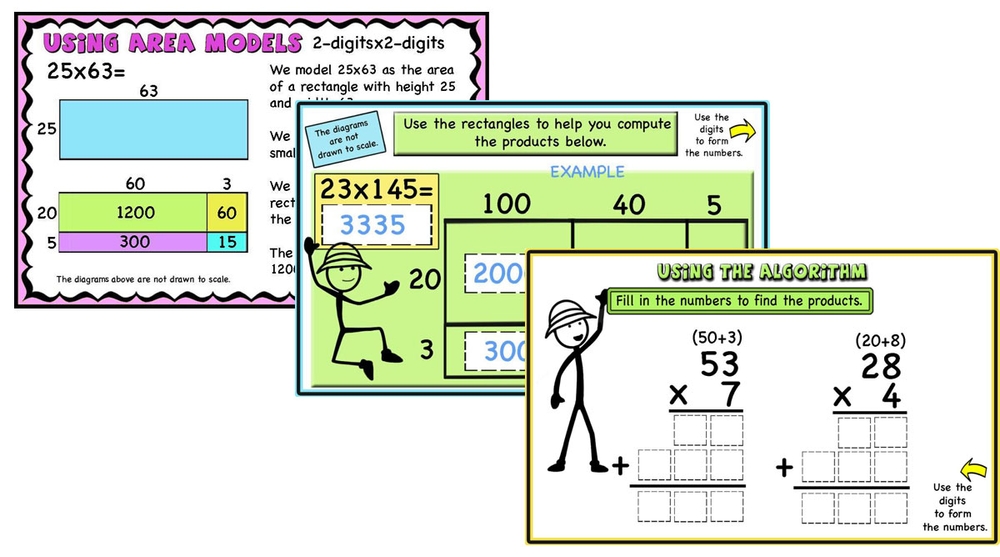
Multi-Digit Multiplication, Area model, Partial Products algorithm, Puzzles, Word problems
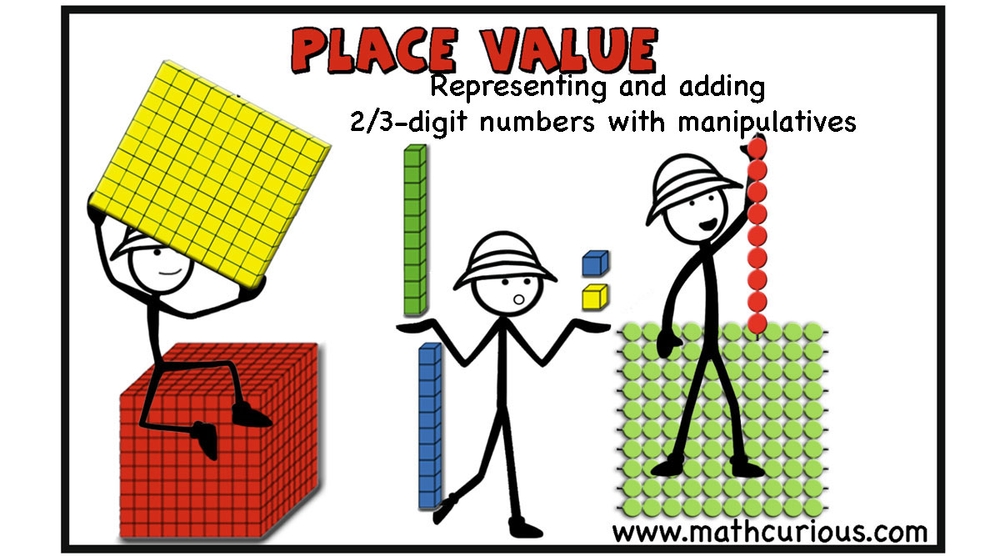
Place Value – Representing and adding 2/3 digit numbers with manipulatives
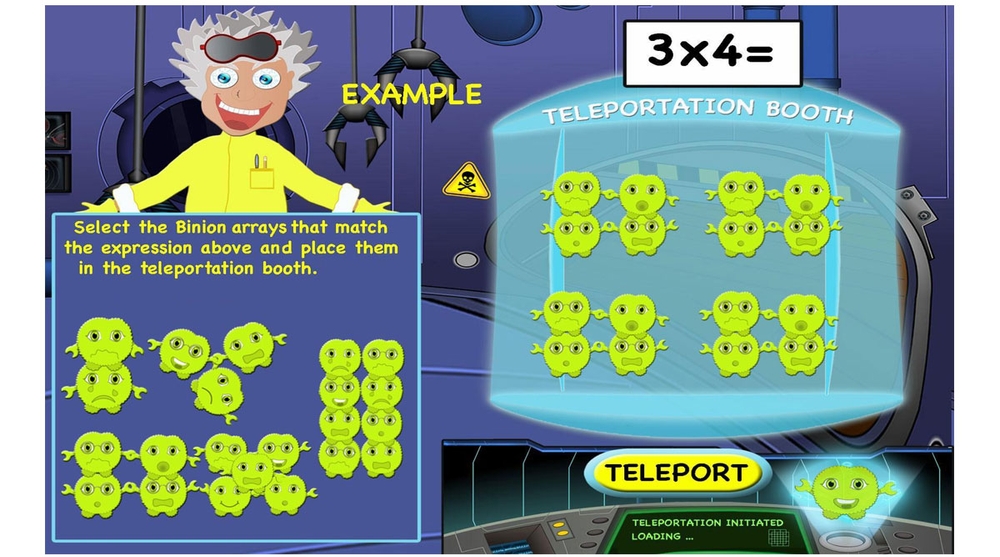
Multiplication Mission – arrays, properties, multiples, factors, division
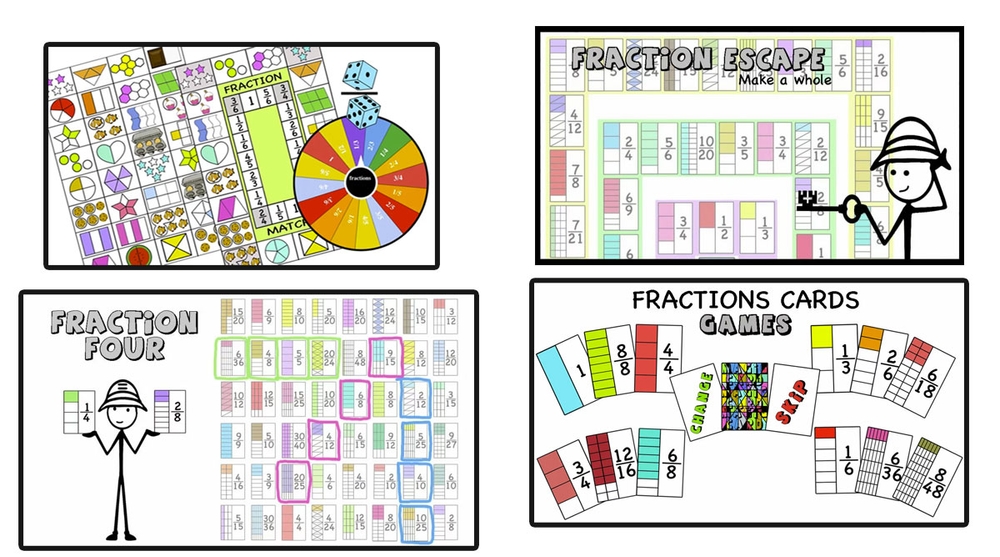
Fractions Games and activities – Equivalence, make 1, compare, add, subtract, like, unlike
Diving into Division -Teaching division conceptually
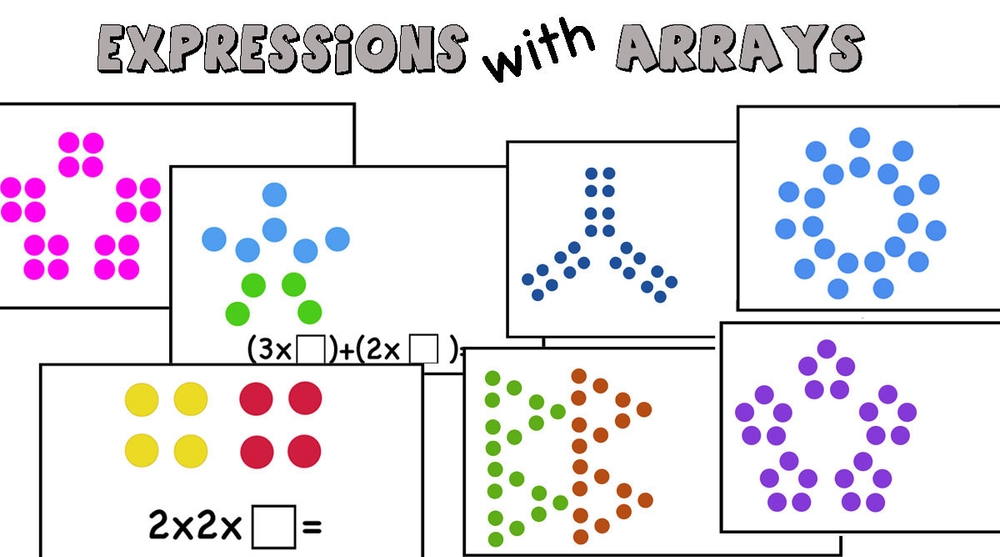
Expressions with arrays
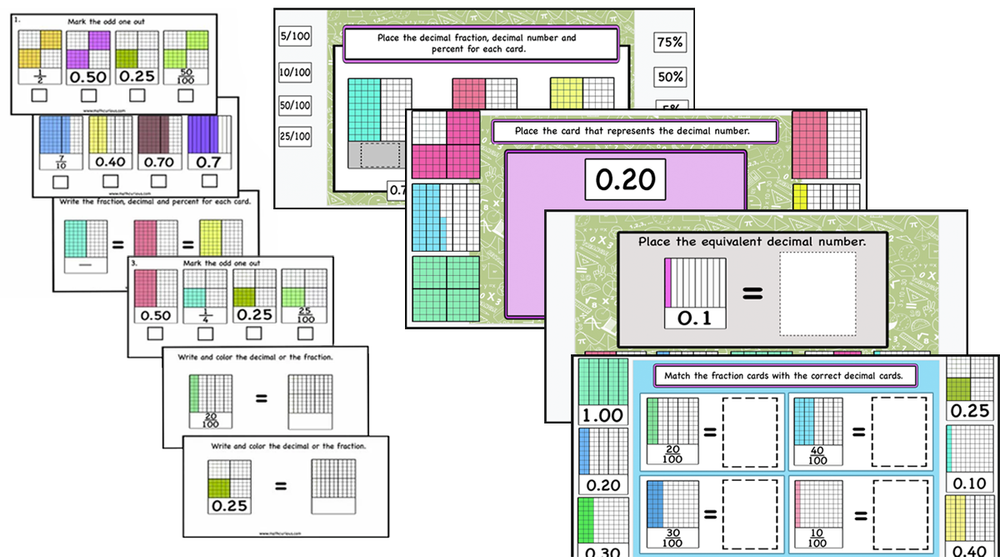
Decimals, Decimal fractions, Percentages – print and digital
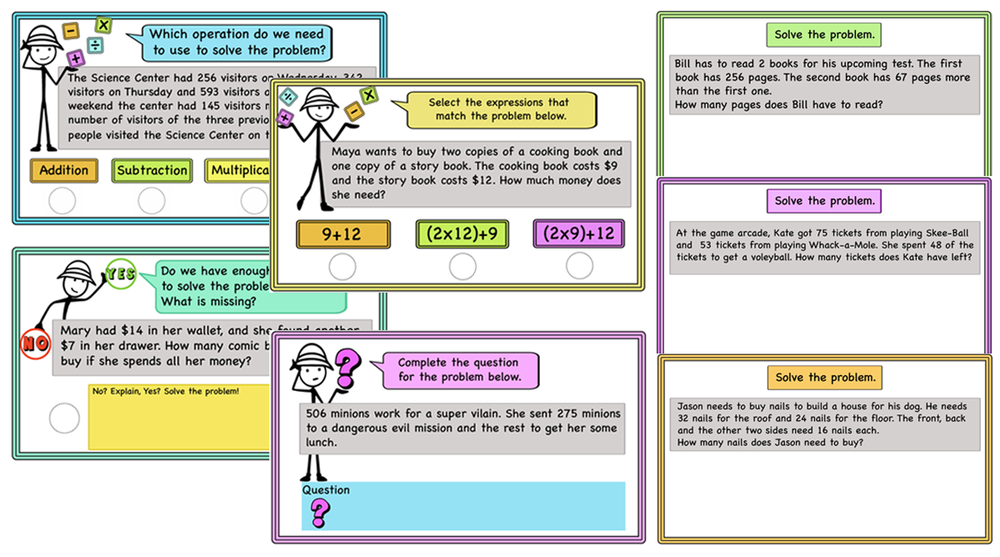
Solving Word Problems- Math talks-Strategies, Ideas and Activities-print and digital
Check out our best selling card games now available at amazon.com and amazon.ca.

Chicken Escape
A multiplayer card game that makes mental math practice fun! Chicken Escape is a fast-paced multiplayer card game. While playing…

Dragon Times – A math Adventure card game
Dragon Times is an educational fantasy card game that aims to motivate children to practice multiplication and division facts while…
How Do You Solve a Problem by Drawing a Diagram?
When your solving a word problem involving distance, drawing a diagram is a great way to see the problem! This tutorial shows you how to make and use a diagram for a word problem involving distance.
- word problem
Background Tutorials
Operations with whole numbers.

How Do You Add Whole Numbers?
To add numbers, you can line up the numbers vertically and then add the matching places together. This tutorial shows you how to add numbers vertically!
A Problem-Solving Plan

How Do You Make a Problem Solving Plan?
Planning is a key part of solving math problems. Follow along with this tutorial to see the steps involved to make a problem solving plan!
Further Exploration

How Do You Solve a Problem Using Logical Reasoning?
Using logic is a strong approach to solving math problems! This tutorial goes through an example of using logical reasoning to find the answer to a word problem.
- Terms of Use
Problem Solving Strategy: Draw a Picture
Make problem solving easier for students be teaching multiple strategies . Here is an explanation of how and why to encourage students to draw pictures for solving math word problems . Teaching students to draw pictures illustrating the details has many benefits.

Draw Pictures Strategy – Problem Solving
No matter what grade, drawing pictures can make solving problems a go-to strategy. This strategy can generally help students improve their accuracy, draw on their strengths as visual learners and determine importance in details. Read about how differing grades can benefit from this strategy and download free printable problems that encourage practicing this math strategy for second grade, third grade and fourth grade.
CONTINUE READING ON THE BLOG
| submit your tip |, have you seen.
- Solving Word Problems – Strategy Posters for Kids
- Problem Solving Printables for “Math Curse”
- Math Problems Made Real: Kids Lemonade Stand

Teach Junkie
Leslie {aka the original Teach Junkie} loves learning new things to make teaching easier and more effective. She enjoys featuring creative classroom fun when she's not designing teacher shirts, making kindergarten lesson plans or planning her family's next trip to Disney World.
Problem-Solving Flowchart: A Visual Method to Find Perfect Solutions
Lucid Content
Reading time: about 7 min
“People ask me questions Lost in confusion Well, I tell them there's no problem Only solutions” —John Lennon, “Watching the Wheels”
Despite John Lennon’s lyrics, nobody is free from problems, and that’s especially true in business. Chances are that you encounter some kind of problem at work nearly every day, and maybe you’ve had to “put out a fire” before lunchtime once or twice in your career.
But perhaps what Lennon’s saying is that, no matter what comes our way, we can find solutions. How do you approach problems? Do you have a process in place to ensure that you and your co-workers come to the right solution?
In this article, we will give you some tips on how to find solutions visually through a problem-solving flowchart and other methods.
What is visual problem-solving?
If you are a literal thinker, you may think that visual problem-solving is something that your ophthalmologist does when your vision is blurry. For the rest of us, visual problem-solving involves executing the following steps in a visual way:
- Define the problem.
- Brainstorm solutions.
- Pick a solution.
- Implement solutions.
- Review the results.
How to make your problem-solving process more visual
Words pack a lot of power and are very important to how we communicate on a daily basis. Using words alone, you can brainstorm, organize data, identify problems, and come up with possible solutions. The way you write your ideas may make sense to you, but it may not be as easy for other team members to follow.
When you use flowcharts, diagrams, mind maps, and other visuals, the information is easier to digest. Your eyes dart around the page quickly gathering information, more fully engaging your brain to find patterns and make sense of the data.
Identify the problem with mind maps
So you know there is a problem that needs to be solved. Do you know what that problem is? Is there only one problem? Is the problem sum total of a bunch of smaller problems?
You need to ask these kinds of questions to be sure that you are working on the root of the issue. You don’t want to spend too much time and energy solving the wrong problem.
To help you identify the problem, use a mind map. Mind maps can help you visually brainstorm and collect ideas without a strict organization or structure. A mind map more closely aligns with the way a lot of our brains work—participants can bounce from one thought to the next defining the relationships as they go.

Mind mapping to solve a problem includes, but is not limited to, these relatively easy steps:
- In the center of the page, add your main idea or concept (in this case, the problem).
- Branch out from the center with possible root causes of the issue. Connect each cause to the central idea.
- Branch out from each of the subtopics with examples or additional details about the possible cause. As you add more information, make sure you are keeping the most important ideas closer to the main idea in the center.
- Use different colors, diagrams, and shapes to organize the different levels of thought.
Alternatively, you could use mind maps to brainstorm solutions once you discover the root cause. Search through Lucidchart’s mind maps template library or add the mind map shape library to quickly start your own mind map.
Create a problem-solving flowchart
A mind map is generally a good tool for non-linear thinkers. However, if you are a linear thinker—a person who thinks in terms of step-by-step progression making a flowchart may work better for your problem-solving strategy. A flowchart is a graphical representation of a workflow or process with various shapes connected by arrows representing each step.
Whether you are trying to solve a simple or complex problem, the steps you take to solve that problem with a flowchart are easy and straightforward. Using boxes and other shapes to represent steps, you connect the shapes with arrows that will take you down different paths until you find the logical solution at the end.

Flowcharts or decision trees are best used to solve problems or answer questions that are likely to come up multiple times. For example, Yoder Lumber , a family-owned hardwood manufacturer, built decision trees in Lucidchart to demonstrate what employees should do in the case of an injury.
To start your problem-solving flowchart, follow these steps:
- Draw a starting shape to state your problem.
- Draw a decision shape where you can ask questions that will give you yes-or-no answers.
- Based on the yes-or-no answers, draw arrows connecting the possible paths you can take to work through the steps and individual processes.
- Continue following paths and asking questions until you reach a logical solution to the stated problem.
- Try the solution. If it works, you’re done. If it doesn’t work, review the flowchart to analyze what may have gone wrong and rework the flowchart until you find the solution that works.
If your problem involves a process or workflow , you can also use flowcharts to visualize the current state of your process to find the bottleneck or problem that’s costing your company time and money.

Lucidchart has a large library of flowchart templates to help you analyze, design, and document problem-solving processes or any other type of procedure you can think of.
Draw a cause-and-effect diagram
A cause-and-effect diagram is used to analyze the relationship between an event or problem and the reason it happened. There is not always just one underlying cause of a problem, so this visual method can help you think through different potential causes and pinpoint the actual cause of a stated problem.
Cause-and-effect diagrams, created by Kaoru Ishikawa, are also known as Ishikawa diagrams, fishbone diagrams , or herringbone diagrams (because they resemble a fishbone when completed). By organizing causes and effects into smaller categories, these diagrams can be used to examine why things went wrong or might go wrong.

To perform a cause-and-effect analysis, follow these steps.
1. Start with a problem statement.
The problem statement is usually placed in a box or another shape at the far right of your page. Draw a horizontal line, called a “spine” or “backbone,” along the center of the page pointing to your problem statement.
2. Add the categories that represent possible causes.
For example, the category “Materials” may contain causes such as “poor quality,” “too expensive,” and “low inventory.” Draw angled lines (or “bones”) that branch out from the spine to these categories.
3. Add causes to each category.
Draw as many branches as you need to brainstorm the causes that belong in each category.
Like all visuals and diagrams, a cause-and-effect diagram can be as simple or as complex as you need it to be to help you analyze operations and other factors to identify causes related to undesired effects.
Collaborate with Lucidchart
You may have superior problem-solving skills, but that does not mean that you have to solve problems alone. The visual strategies above can help you engage the rest of your team. The more involved the team is in the creation of your visual problem-solving narrative, the more willing they will be to take ownership of the process and the more invested they will be in its outcome.
In Lucidchart, you can simply share the documents with the team members you want to be involved in the problem-solving process. It doesn’t matter where these people are located because Lucidchart documents can be accessed at any time from anywhere in the world.
Whatever method you decide to use to solve problems, work with Lucidchart to create the documents you need. Sign up for a free account today and start diagramming in minutes.
About Lucidchart
Lucidchart, a cloud-based intelligent diagramming application, is a core component of Lucid Software's Visual Collaboration Suite. This intuitive, cloud-based solution empowers teams to collaborate in real-time to build flowcharts, mockups, UML diagrams, customer journey maps, and more. Lucidchart propels teams forward to build the future faster. Lucid is proud to serve top businesses around the world, including customers such as Google, GE, and NBC Universal, and 99% of the Fortune 500. Lucid partners with industry leaders, including Google, Atlassian, and Microsoft. Since its founding, Lucid has received numerous awards for its products, business, and workplace culture. For more information, visit lucidchart.com.
Related articles

Sometimes you're faced with challenges that traditional problem solving can't fix. Creative problem solving encourages you to find new, creative ways of thinking that can help you overcome the issue at hand more quickly.

Dialogue mapping is a facilitation technique used to visualize critical thinking as a group. Learn how you and your team can start dialogue mapping today to solve problems and bridge gaps in knowledge and understanding (plus get a free template!).
Bring your bright ideas to life.
or continue with
How to Solve Problems & Get Ideas with These 5 Diagrams
Drawing a digram is a powerful problem solving technique. The right diagram can reveal hidden relationships that lie hidden behind facts and figures. Try these five simple visualizations for everyday decision making.
Do you diagram to develop ideas and plan? If not, you should! Diagramming makes your ideas more solid because they start to exist in the real world, outside of your mind.
Thinkers out there have also developed visual models you can follow to help you plan and make decisions. We'll introduce you to five models and diagramming methods that you may not know, and tips and tools to help you make the most of them.
Personal Performance Model
The Personal Performance Model (developed by Mikael Krogerus and Roman Tsch ä ppeler, authors of The Decision Book: 50 Models for Strategic Thinking ) helps you decide whether you should change your job by tracking your satisfaction (or dissatisfaction) numerically.
How It Works
You may want to do this in a notebook where you can draw out the model on the pages and flip between them. Alternatively, you could make a line-graph of your answers to track them over time
Every evening for three weeks, ask yourself the following three questions, and insert your answers in the model on a scale of one ('doesn't apply at all') to ten ('totally applies'). Have to. To what extent are my current tasks being imposed on me or demanded of me? Able to. To what extent do my tasks match my abilities? Want to. To what extent does my current task correspond to what I really want? -- The Decision Book: 50 Models for Strategic Thinking
On a three-pointed plane, you'll see that your answers form a "sail". If your answers change significantly, then the sail is changing, and at least it shows you have variety in your work. The bad days may be only occasional.
If your answers stay roughly the same day-to-day (the sail doesn't change), ask yourself how satisfied you are with that state. Are you getting what you want out of your job? What would you rather, and do you have the means to take the leap?
You might need this diagram when assessing a job offer in case you're looking for a new career. While there are many apps which can help you make decisions , an analog skill with a simple diagram like this could be a more powerful exercise.
The Eisenhower Matrix
The Eisenhower Matrix (developed by former US President Dwight D. Eisenhower) helps you prioritize your tasks and work more efficiently. It's also a good model for people to follow to decide what to handle themselves and what to delegate, delete, seek help with, or automate .
Each of the tasks on your to-do list need to be assigned a quadrant according to which ones are 1) Important and Urgent, 2) Important but Not Urgent, 3) Unimportant and Not Urgent, 4) Unimportant, but Urgent. Then, simply follow the model as shown above to decide what to do when.
You can automate the Eisenhower Matrix with this Google Sheet template by Sidekick . After you open it, go to File > Make a Copy , and you'll have your own version to fill in. As you fill in the list, your to-do items will be automatically sorted on the spreadsheet page labeled "My Prioritized To-Do List".
Obviously you have to do the Q1 items first, but the key to living a great life (or planning a great event) is to figure out when you will do the Q2 items. The items in Q2 make us better. They let us "level up".
If you have always wanted to learn to play guitar, you need to put it in Q2, and the rule for Q2 is that you need to schedule it. If it's important, it needs some time in your schedule, whether that's tomorrow or months down the road. Just because you have no pressing need to learn guitar right away, doesn't mean you keep putting it off forever.
Check out our productivity tip on how to prioritize better .
Gantt Charts
Gantt charts (created by Karol Adamiecki and independently by Henry Gantt) help you manage the phases of complex projects over time by visually showing what tasks need to be completed on a horizontal time scale. Here's a video with some history and tips from projectmanager.com :
To start your Gantt chart simply, try a tool like Smartsheet . Put down your big tasks, and break them down into smaller tasks. Enter the date that each task is to be started and finished, or use your mouse to click and drag on the end points of the subtasks.
Let's say you were planning a wedding.
A big task might be "Organize decorations". That could be split into sub-tasks such as choosing flowers, buying chair covers, and selecting table centerpieces. "Building a guest list" could be a big task including brainstorming attendees, organizing a seating plan, and distributing invitations. Some of these tasks can be done by different people, and some of them have to be done before others, so you can plot all the tasks on your Gantt chart to make sure everyone involved in the planning stays on track and gets done on time.
You can also check out Binfire's product management tool with Gantt Charts for an alternative.
Affinity Diagrams
An affinity diagram helps you brainstorm by building connections between different concepts. It' s a great form of brainstorming for a group.
Unlike traditional group brainstorming, you don't have some people yelling out ideas while others quietly think --"That's a stupid idea," all the while you try to scribble them down on a whiteboard.
You start affinity diagramming by collecting ideas on sticky notes or Post-Its. Give everyone a stack of sticky notes and a pen, so they can all write their ideas down at once. Give them a prompt, like, "things you love about our brand" "things our team could work on" or "features of our competitors' product". I nstruct the group to put down one idea per Post-It, and use as many as they like. Use a different color for each question.
After a few minutes of working on each question, put the sticky notes up for everyone to see. Now, you can go through the answers together. You will see common themes emerge among the ideas. Let your group start to move them around and talk about clustering them by what feels right, and what fits the spirit of what the original writer meant.
After everyone seems happy with the clusters of ideas, give each cluster a name. Now you have big themes and concepts for your project that help your team get on the same page, and reveal what's important to the group. Finally, p hotograph the board.
If someone in the group has an iPhone, you can use the Post-It Plus app to capture the post-its, move them around, and share with the group.
Mind maps help you study and build creative ideas by organizing thoughts visually around a concept. It's a little like the opposite process from Affinity Diagramming.
Start by putting the name of your concept in the center of the page, and circle it (like the Cats mindmap I started above in Coggle ). As you're thinking (or paying attention in a classroom or lecture), add branches to that concept and connect it with the big ideas that contribute to it. Branch those concepts off into smaller ideas and notes, and so on and so forth. Use different colors, shapes, and connecting lines as necessary -- or draw illustrations if they help you capture an idea.
When you're done, you'll have a web connecting ideas and concepts together. When you look back on it later, studying will be easy because the concepts won't be displayed linearly, but by how they relate to each other.
If you're mind-mapping to brainstorm, try to approach it from the angle of filling out each of the branches as much as you can. It will help you get past a creative block because if you don't know what to think about next, or what kind of project you should make, you can look to your mind map and ask yourself, "What areas could I stand to fill out more?"
One of my favorite tools for mind mapping is Blumind, for Windows. It's lightweight, has great keyboard shortcuts, and lets you instantly transform your mind map into a variety of different formats like hierarchical organization charts, tree diagrams, and logic diagrams. There are mind-mapping tools for other platforms out there too.
What Kinds of Diagrams Do You Use?
There are tons of useful models and diagrams that you can make to solve everyday problems.
What kinds of diagrams do you find yourself using a lot? Let us know what we missed. We'd also love to hear about the kinds of tricky problems you may have had to solve and how you did it -- or challenges that may seem so complicated to plan that you don't know where to begin.
Image Credits : Badges Affinity Diagram by Open Michigan via Flickr
- Math Lessons Online
How to Draw a Diagram in Math
In math, diagrams play a crucial role in helping us visualize and understand complex concepts. Whether you’re a student trying to grasp a new math topic or a teacher looking for practical teaching tools, knowing how to draw a diagram can significantly enhance your math experience. This blog post will discuss why diagrams are necessary in math and explore the different types of diagrams you can utilize.
Why diagrams are essential in math
- Visual Representation: Math concepts can sometimes be abstract and difficult to imagine. Diagrams provide a visual representation that brings these concepts to life and makes them easier to comprehend.
- Enhanced Comprehension: By incorporating diagrams into your math learning or teaching, you can enhance comprehension and make seeing the relationships between different problem elements easier.
- Improved Problem Solving: Diagrams can also aid in problem-solving by providing a clear structure and helping you organize the given information. They allow you to break down complex problems into smaller, more manageable parts.
Different types of diagrams in math
- Bar Graphs: Bar graphs represent and compare data in different categories. They consist of vertical or horizontal bars representing different variables’ values.
- Pie Charts: Pie charts help illustrate proportions and percentages. They divide a circle into sectors, each representing a different category or value.
- Line Graphs: Line graphs are commonly used to show the relationship between two variables. They use lines to connect data points, visually representing how values change over time or across different conditions.
- Venn Diagrams: Venn diagrams are beneficial when dealing with sets and relationships between them. They use overlapping circles or shapes to show the commonalities and differences between groups or categories.
- Coordinate Grids: Coordinate grids consist of a horizontal x-axis and a vertical y-axis. They are essential for graphing equations, plotting points, and understanding variables’ relationships.
Utilizing these different types of diagrams in your math studies or teaching can enhance understanding, improve problem-solving skills , and make complex concepts more accessible. Feel free to get creative with your diagrams and experiment with different visual representations to find what works best. Remember, practice makes perfect, so keep drawing those diagrams and watch your math skills soar!
Essential Elements of a Diagram
Drawing a diagram in math can be a powerful tool to help you visualize and understand complex concepts. By incorporating the essential elements of a diagram, you can effectively represent mathematical ideas and relationships. In this section, we will explore the critical components of a diagram and how to use them to enhance your math experience.
Points and Lines
Points and lines are essential elements when constructing a diagram. Points are used to represent specific locations or values, while lines connect these points to illustrate relationships. For example, in a coordinate grid, points are plotted along the x and y-axis, and lines are drawn to connect these points, creating a graph.
To draw points, use a small dot or a cross to represent the values you want to visualize. Lines can be drawn using a ruler or connecting points with a straight line tool. Using points and lines in your diagram, you can effectively represent numerical data, functions, and geometric shapes.
Shapes and Figures
Another vital element of a diagram in math is shapes and figures. Shapes can represent various concepts, such as polygons, circles, triangles, or rectangles. They can be drawn using straight, curved, or a combination.
When drawing shapes, please pay attention to their dimensions and proportions. Use a ruler or any suitable tool to ensure accuracy. Labeling the sides or angles of the shapes can also provide additional information for the viewer.
In addition to basic shapes, you can use complex figures to represent more intricate concepts. For example, a Venn diagram can show the relationships between sets, with overlapping circles representing common elements.
Experiment with different shapes and figures to find the most effective way to represent your mathematical ideas. Be creative and use colors or shading to enhance the visual impact of your diagrams further.
By understanding and utilizing the essential elements of a diagram, you can unlock the power of visualization in math. Points and lines help illustrate relationships and values, while shapes and figures represent concepts and geometric properties. Practice drawing diagrams regularly to improve your skills and make math more accessible and enjoyable. So grab a pencil and a ruler, and let your creativity flow as you bring mathematical concepts to life through diagramming.
Drawing Diagrams Using Geometric Tools
Drawing a diagram in math can be a powerful tool to help you visualize and understand complex concepts. You can effectively represent mathematical ideas and relationships using geometric tools. This section will explore two essential geometric tools: the ruler and compass and the protractor and angle measurement.
Ruler and Compass
The ruler and compass are two of the most basic and essential tools in geometry. The ruler is used to draw straight lines and measure distances accurately. Use a ruler to ensure your lines are straight and precisely placed when drawing a diagram. Creating shapes or figures, such as polygons or graphs, is essential.
The compass is used to draw circles or arcs with a specific radius. Adjusting the compass to the desired radius allows you to create accurate circles or arcs representing geometric properties or relationships. For example, when drawing a circle to represent a shape’s circumference or radius, use the compass to ensure precise measurements.
To use the compass, place the pointed end at the circle’s center and rotate the other end around it. It will create a perfect circle or arc. Remember to keep the compass steady and the radius consistent to achieve accurate results.
Protractor and Angle Measurement
Angles play a crucial role in geometry, and the protractor is a valuable tool for measuring and drawing angles accurately. When drawing a diagram, it’s essential to represent angles correctly to convey the relationships between lines or shapes.
To use a protractor:
- Align the baseline of the protractor with one side of the angle.
- Read the measurement on the protractor to determine the angle’s size.
- Use this measurement to draw the angle accurately, ensuring the angle’s opening and shape are represented correctly.
Measuring angles is crucial when drawing shapes or figures that involve angles, such as triangles or polygons. It allows you to represent the properties and characteristics of these shapes accurately.
You can create precise and visually appealing diagrams by utilizing these geometric tools – the ruler, compass, and the protractor. Remember to keep your lines straight and measurements accurate with the ruler, create perfect circles or arcs with the compass, and consistently measure and draw angles with the protractor. Practice regularly to improve your skills and enhance the visual impact of your diagrams.
Drawing diagrams using geometric tools helps you understand math concepts better and allows you to communicate your ideas effectively. So grab your ruler, compass, and protractor. Let your imagination and creativity run wild as you bring mathematical concepts to life through diagramming.
Constructing Basic Diagrams
Regarding math, drawing diagrams is a powerful tool to help you understand and visualize complex concepts. Whether solving equations or working on geometry problems, incorporating essential geometric tools can make your diagrams accurate and informative. This section will explore how to draw a straight line and construct angles using simple geometric tools.
Drawing a Straight Line
Drawing a straight line is the foundation of constructing any diagram. To ensure accuracy, you’ll need a ruler. Place the ruler on your paper and hold it firmly. Using the ruler’s edge as a guide, draw a line from one point to another. Keep your hand steady, and make sure the line is straight and precisely placed. It is essential when creating shapes, graphs, or straight lines within your diagram. Remember, a crooked line could lead to incorrect interpretations of the math concept you’re trying to convey.
Constructing Angles
Angles are fundamental in math, and constructing them is crucial for representing relationships and measurements. Fortunately, with the help of a protractor, drawing accurate angles becomes easier:
- Carefully read the measurement on the protractor to determine the size of the angle. Now, mark the desired angle using a point or a dot.
- Use your ruler to draw the other side of the angle, ensuring that it matches the measurement you determined with the protractor.
Following these steps, you can construct angles accurately, illustrating their properties and characteristics in your diagram.
Additionally, when constructing triangles, polygons, or any other shapes that involve angles, it’s essential to pay attention to the measurements and relationships between angles. Consistently using the protractor will help you accurately represent the angles in your diagram, bringing clarity to your mathematical concepts.
Practicing regularly with the ruler and protractor will enhance your skills in constructing basic diagrams. Remember to keep your lines straight and precise with the ruler, and measure and draw angles accurately with the protractor. Frequent practice will improve your technical skills and enhance the visual impact of your diagrams, making them more compelling and informative.
So, gather your ruler and protractor, and let your creativity flow as you construct basic diagrams to uncover the beauty of math.
Creating Diagrams for Geometric Figures
Drawing diagrams is an essential math skill, as it helps you visualize and understand complex concepts. Creating accurate and informative diagrams can significantly enhance your mathematical understanding, whether you’re working with triangles, polygons, or other geometric figures. This section will explore how to draw triangles and construct polygons using essential geometric tools.
Drawing Triangles
Triangles are one of the most fundamental geometric shapes, so drawing them is crucial. To draw a triangle, you will need a ruler and a pencil.
- Start by selecting three points on your paper to serve as the vertices of your triangle. These points can be anywhere on the paper, but make sure they are close enough.
- Place your ruler on the paper, connecting the first two vertices with a straight line. Ensure your ruler is straight and firmly held to ensure accuracy.
- Next, draw lines from the remaining vertices to each other, creating the other two sides of the triangle. Again, make sure the lines are straight and precise.
- Finally, check that all three sides of the triangle are equal in length and that the angles formed by the intersecting lines are 60 degrees. It will ensure that your triangle is equilateral.
Constructing Polygons
Polygons are closed geometric figures with three or more straight sides. Constructing polygons requires precision and attention to detail. Here’s how you can do it:
- Start by deciding the number of sides or vertices you want your polygon to have. For example, if you want to draw a pentagon, you’ll need five vertices.
- Using your ruler, mark the positions of the vertices on your paper. Ensure they are evenly spaced and the lines connecting them will not intersect.
- Connect the vertices with straight lines, ensuring that each line is the same length and that the angles between the lines are equal. It will create a regular polygon.
- To construct irregular polygons, you can vary the lengths of the sides or adjust the angles between them. Just make sure the lines are still straight and accurately placed.
Remember, practicing will improve your skills in creating accurate and visually appealing diagrams. Be patient with yourself as you learn, and don’t be afraid to experiment with different shapes and sizes.
In conclusion, by mastering the art of drawing triangles and constructing polygons, you can accurately represent geometric figures and visually explore math’s beauty. So grab your ruler, pencil, and paper, and embrace the joy of creating diagrams for geometric figures in your mathematical journey.
Drawing accurate and informative diagrams is an essential math skill that greatly enhances your understanding of geometric figures. Creating visual representations can help you grasp complex concepts and solve mathematical problems, whether you’re working with triangles, polygons, or other shapes. Following the steps outlined in this blog section, you can confidently draw diagrams that accurately depict geometric figures and visually explore the beauty of math.
Benefits of Using Diagrams in Math
Using diagrams in math offers several advantages that can improve your learning experience and problem-solving abilities. Here are some key benefits:
- Visualization: Diagrams visually represent abstract concepts, making them easier to understand and remember. Seeing the relationships between different elements helps you visualize how they interact and relate to one another.
- Enhanced Comprehension: Diagrams can simplify complex ideas by breaking them into visual components. You can better comprehend mathematical concepts and their applications by seeing the different parts and their connections.
- Problem Solving: When faced with a math problem, diagrams allow you to analyze the situation visually and develop strategies for finding solutions. They can help you identify patterns, recognize symmetries, or determine crucial measurements for solving the problem.
- Communication: Diagrams serve as a universal language in math. They can help you communicate your ideas and solutions more effectively, especially when working collaboratively or presenting your work to others.
- Engagement: Creating and interacting with diagrams can make math more engaging and enjoyable. It adds creativity to the learning process and encourages you to explore mathematical concepts from different perspectives.
You can harness these benefits and enhance your mathematical skills by incorporating diagrams into your math practice . Remember to practice regularly, experiment with different shapes and sizes, and be patient with yourself as you develop your diagramming abilities.
In conclusion, drawing diagrams in math is a valuable tool that can improve your understanding, problem-solving skills, and overall engagement with the subject. Embrace the joy of creating diagrams for geometric figures and unlock the visual beauty of math in your mathematical journey. So grab your ruler, pencil, and paper, and start exploring the world of mathematical diagrams with confidence and curiosity.
- Grade 1 Lessons
- Grade 2 Lessons
- Grade 3 Lessons
- Grade 4 Lessons
- Grade 5 Lessons
- Grade 6 Lessons
- Grade 7 Lessons
- Grade 8 Lessons
- Kindergarten
- Math Activities
- Math Tutorial
- Multiplication
- Subtraction
- #basic mathematic
- #Basic Mathematical Operation
- #best math online math tutor
- #Best Math OnlineTutor
- #dividing fractions
- #effective teaching
- #grade 8 math lessons
- #linear equation
- #Math Online Blog
- #mathematical rule
- #mutiplying fractions
- #odd and even numbers
- #Online Math Tutor
- #online teaching
- #order of math operations
- #pemdas rule
- #Point-Slope Form
- #Precalculus
- #Slope-Intercept Form
- #Tutoring Kids
Thank you for signing up!
GET IN TOUCH WITH US
Powerful online learning at your pace

Using Strip Diagrams as a Problem-Solving Strategy
There’s a lot to be learned from the data that comes from state testing if we use it correctly . Oftentimes, we’ll take a problem that students, as a whole, perform poorly on and we create a bunch of problems just like that one and “teach” them how to work that type of problem. In the end, that’s not an effective strategy, because they’ll probably never see a problem exactly like that one again. A more effective way to use the data is to analyze the wrong answers to determine underlying misconceptions that resulted in the wrong answers and provide students with strategies and tools to improve their overall mathematical reasoning. As far as strategies go, drawing strip diagrams is one of the most powerful strategies students can have in their toolbox. And I have some super clear examples to persuade you!
This post contains affiliate links, which simply means that when you use my link and purchase a product, I receive a small commission. There is no additional cost to you, and I only link to books and products that I personally use and recommend.
The test items in this post come from the 2021 State of Texas Assessments of Academic Readiness (STAAR) test. A wonderful organization called lead4ward analyzes the test each year and provides error analysis statistics.
Analyzing errors
Let’s get started! As you can see from this test item, only roughly half of the students in the state got the correct answer. Look at the most common wrong answer, choice H. Can you see the error that the students who chose that answer made? Take a minute to figure it out before you scroll down.

Look closely at the order of the numbers in the problem. The smaller number comes first in the problem. Students who chose H realized it was a subtraction problem, but took the numbers in order from the problem and subtracted them. So they did 379 – 514. Nine minus 4 is 5. Seven minus 1 is 6. They couldn’t do 3 minus 5, so they did 5 minus 3. The answer they got was 265. Your first thought might be, I need to make sure my students always know to subtract the smaller number from the bigger number. Except that’s not true. If the temperature is 18 degrees and the temperature drops 29 degrees… We need to be extremely careful to not teach “rules” that expire .
The students who chose H lacked an understanding of the meaning of the numbers in the problem. The way we help them be more successful with problems like this is to give them tools to improve their comprehension of word problems and the numbers they contain. Enter strip diagrams.
Using drawings to describe problems
Drawing strip diagrams is a process that actually begins in Kindergarten and 1st grade when students should be drawing pictures to represent word problems. Students should understand that the numbers in a problem represent something—pizzas, soccer players, apples, money saved—and their drawings should include labels identifying what the numbers represent. At this point, the drawings don’t need to resemble strip diagrams. What’s important is the labeling. It could look something like what you see here.

Notice a couple of things. First, the boys and girls are represented by circles. Easy to draw and count. Students need to understand that these are math pictures, not art pictures. Next, and of critical importance, are the labels.
Beginning in 2nd grade, students can begin to draw more formal strip diagrams. Strip diagrams, also called tape diagrams, are often associated with Singapore Math. Char Forsten’s Step-by-Step Model Drawing is the book I learned model drawing from. Another great resource is Math Playground’s Thinking Blocks .
Modeling how to draw a strip diagram
Now let’s get back to that released test item I started this post with and see what the model-drawing process might look like.

This problem is a comparison subtraction problem. We always want students to draw the model with labels first. they will add the numbers in the next step.
Teacher: [Reads problem out loud] What is this story about? (lions) How many lions? (2) What does the problem tell us about the lions? (their weight) Do we know their weights? (yes) Which lion weighs more? (the older lion) What is the problem asking us to find? (the difference in their weights) Huh, what does that mean? (The older lion weighs more than the younger lion. The problem is asking how much more.)
NOTE: Notice that we didn’t talk about the numbers at all! The point of this discussion is to help students make sense of the numbers in the problem and verbalize what the problem is asking them to find.
Teacher: Drawing a model really helps me understand what math I need to do to solve a problem. Let’s draw a model to represent this problem. We know that the older lion weights more, so his bar should be longer, right? [draws and labels the older lion’s bar] That means the younger lion’s bar should be shorter. [draws and labels younger lion’s bar] And you guys told me the problem is asking for the difference. [adds the difference with a question mark]

Now we can plug in the numbers from the problem.

Notice that what I’ve described is very scripted. I want students to hear my mathematical thinking, and I’m teaching them the mechanics of drawing the model. But it’s important to let students use the tool to solve problems. Think how the models would look for these variations of the problem:
There are two lions at the zoo. The weight of the younger lion is 379 pounds. That’s 135 less than the weight of the older lion. How much does the older lion weigh?
There are two lions at the zoo. The weight of the older lion is 514. That’s 135 more than the weight of the younger lion. How much does the younger lion weigh?
Remember, our goal is for students to be able to use strip diagrams to solve new types of problems, so once they understand and can use the model, we have to give them new types of problems to solve without scripted instruction.
More examples of strip diagrams
Let’s take a look at a few more problems from the same test. Each of these problems had pretty dismal results.
This first problem is what we in Texas call a gridable . That means it’s not multiple choice—students have to write and bubble in their answers. A lot of times students will miss gridables due to calculation errors. But I’m pretty sure that’s not the case here. I doubt they miscalculated 4 x 5. What that means is that 38% of the 3rd-grade students in Texas did not recognize this as a multiplication problem. They likely added 4 + 5. Teaching keywords could be the culprit. Students see the word total in the problem, and they’ve been taught that total means addition. Teaching keywords basically gives students permission to not read and understand the problem—just find the keyword and plug the numbers into the operation. Not a sound problem-solving strategy. Instead, we see how a strip diagram could be drawn to represent the problem.

Here’s another multiplication problem. You can see from the error analysis that only 52% of the 3rd-graders correctly answered this problem. Answers B and D are calculation errors. Can you figure out the error these students made? Doing so can help you prevent these types of errors by addressing them in your instruction. Answer choice C results from adding the two numbers, not multiplying. Again, we see the keyword total in the question. Drawing a model would not only help the students visualize the problem as multiplication, but it might also prevent calculation errors. Students who are not confident with the standard algorithm could solve the problem with repeated addition.

Last one and it’s a doozy! Look at that error distribution. When it’s spread out like that, it usually means the kids just didn’t have a clue and guessed. There’s a lot going on here. How could we help students tackle a problem like this?

First, of course, is drawing a model. We see that this is a part/whole problem with three parts, one of which is missing. If you looked carefully at the wrong answers, answer choice F was adding all three numbers. Pretty hard to look at this model and think you’re supposed to add all three numbers.

Aside from model drawing, however, students should learn to write equations to match their models. That’s really the other thing that was hard about this problem. They weren’t asked to solve the problem, just find the correct way to solve it.
Final thoughts
Strip diagrams have to be presented to students as a problem-solving tool and they have to be used consistently. Yes, it takes longer for students to draw strip diagrams to represent their problems, but it should be an expectation. That means we probably need to assign fewer problems to allow students the time to draw their strip diagrams.
The labels are a must! If students can’t label their numbers, it’s a huge red flag. Work with those students in small groups to help them develop comprehension skills.
Students who say they know the answer without drawing a strip diagram should be reminded that we draw models when the problems are easy so we can use them as a problem-solving tool when the problems get harder. And if a large percentage of students can really solve the problems without drawing models are we challenging them enough?
So there you have it. Have I sold you on having students draw strip diagrams? Do you have tips of your own to share? I hope you’ll sound off in the comments.

Similar Posts

Skip-Counting Routine
Many mental math strategies rely on students being able to “jump” tens. For example, 10 more than 28 is 38. The fancy math term for this skill is counting by…

Skip-Counting…It Ain’t Just 2s, 5s, and 10s!
Skip-counting is a skill that is often thought of as an activity for students in lower grades. It shows up in the CCSSM in a couple of places: K.CC.1–Count to 100…

DIY Rekenreks
Rekenrek translates loosely to calculation rack or arithmetic rack, and it was designed by a Dutch mathematician. The rekenrek is a great visual model for developing a strong sense of…

Composing and Decomposing Numbers
One of the reasons I love teaching math is that it is so much different now than when I was in elementary school (Google paleolithic age for a frame of…

What Great Teachers Do Differently
I was first introduced to Todd Whitaker at CAMT back in 2012. I suspected I was in for a treat when the line to get in the auditorium was around…

What is Singapore Math?
A few years back I attended the SDE National Conference on Singapore Math Strategies, and it was four days of non-stop learning! It was my second time attending the conference,…
13 Comments
Strip/bar/tape diagrams are becoming one of my favorite strategies. The labels are crucial and I need to be better at expecting that. I am nearly to the part of 3rd grade where I will be teaching 2 step problems again and I think continuing the strip/tape/bar diagram representation is going to be a wonderful tool. Here’s hoping!
Thanks for your comment, Jessica! They are one of my favorites as well. So very powerful! Come back and let us know how it goes.
Any way we can show visuals for problems are going to support student understanding! Thank you for adding another tool to my teaching tool box! I teach 1st grade and I want to build my students’ confidence and understanding of math!
That’s wonderful, Suzanne! It’s so important that our students develop a positive math identity early.
Hi Donna, I am increasingly interested in the connections between literacy and math. Your post about how kids start by representing their mathematical thinking/problem solving with pictures, then labels, then drawing a model and later abstract number sentences. seems so similar to how young children write stories first with pictures, then we ask them to label and later on write sentences with words, punctuation etc. Do you know of any research linking the two? Thanks! Jennifer
You are so very correct! There are tons of professional books connecting the two. Solving word problems requires comprehension of the problem. Just like reading teachers tell their students to “make a movie in their head” when they read, I tell my math students the very same thing!
Thank you so much for breaking down strip diagrams. This is a tool I try to encourage my students to use, but I feel like I need to do more modeling for them after reading this. I also like how you pointed out we should analyze the best wrong answers for misconceptions.
I have been using strip diagrams to teach my 2nd graders for a few years. They always seem to struggle with understanding where to put the numbers when the story is comparing. How many more toys does Grant have than Amanda? So, I always pointed out that it’s a comparison, and that seemed to help. I am now a K-5 math interventionist and some upper grades teachers think it will be confusing to call that a comparison when they are not using >, <, = symbols. How can I help them understand those problem types, and is there harm in using the word comparison? I think they are still comparing – "how many more".
A strip diagram for comparison looks different. It’s one bar on top of the other. The difference is where the longer bar is shorter than the shorter bar. That might help with the confusion. Absolutely use the word comparison!
Hi Donna. I’m wondering how strip diagrams are any different than the part part whole organizer. They seem so similar to me. I’ve done a lot of work getting my students to use and understand the PPW as a tool. I like the idea of the strip diagram but fear I’ll confuse them if I introduce a new tool to use in place of a PPW.
They are very similar! Often students transition to strip diagrams in the intermediate elementary grades. No need to do both though.
Hi Donna! I started using tape diagrams with my students when my district adopted the Engage NY/Eureka Math Curriculum. I found that students have had great success in using this strategy. Thank you for this clear explanation on using tape diagrams during problem solving.
It’s such a powerful strategy! I’m glad to hear your students found success using it!
Leave a Reply Cancel reply
Your email address will not be published. Required fields are marked *
- International
- Schools directory
- Resources Jobs Schools directory News Search

Math Problem Solving Strategies - Draw a Picture Or Diagram
Subject: Mathematics
Age range: 7-11
Resource type: Other
Last updated
22 February 2018
- Share through email
- Share through twitter
- Share through linkedin
- Share through facebook
- Share through pinterest

Tes paid licence How can I reuse this?
Your rating is required to reflect your happiness.
It's good to leave some feedback.
Something went wrong, please try again later.
Professional quality resource from the Root7 Team. Great product as usual. Students use the Draw a Picture or Diagram strategy to solve a series of excellent problems. Includes a tutorial.
Empty reply does not make any sense for the end user
Report this resource to let us know if it violates our terms and conditions. Our customer service team will review your report and will be in touch.
Not quite what you were looking for? Search by keyword to find the right resource:
Drawing a diagram
Mathematical diagrams can support students to represent a situation and assist in finding a solution to a problem.
Teachers can scaffold students' use of a diagram to solve a problem, by asking, "Can we draw a diagram to help solve this problem?"
Understanding the strategy
To implement this strategy, teacher can:
- provide a problem for students to solve (working in pairs or groups)
- observe whether students use a diagram to help them solve the problem
- ask various students to draw their diagram on the board and compare
- lead a class discussion about the benefits of each diagram.
Examples of using a diagram to reason a solution
There are twenty people at a party and they each shake hands once. How many handshakes will there be?

This diagram was drawn by a Year 8 student solving the handshake problem above.
The teacher asked the student to draw the diagram on the board to explain how she used it solve the problem. The student's reasoning has been transcribed.
Reasoning a solution
The circles are people and the lines are handshakes.
Pointing to the diagram on the left:
"When there are four people, there will be 6 handshakes."
Pointing to the diagram on the right:
"If there was a fifth person, there would be an extra 4 handshakes, so 10 in total."
Each time you add a person, the number of handshakes you add is that person's number minus 1. So, the fifth person adds 4 handshakes, the sixth person adds 5 handshakes.
"When I wrote this down, I saw a pattern. You have to add all the numbers up to the number of people minus 1."
"For 4 people, the number of handshakes were 3 plus 2 plus 1 which equals 6; for 5 people, it's 4 + 3 + 2 + 1 = 10."
"For 20 people, it's 19 + 18 + 17 down to + 1."
This strategy supports the Mathematics proficiencies Reasoning ("adapt the known to the unknown") and Problem solving ("use mathematics to represent unfamiliar or meaningful situations") ( VCAA, n.d. )
Our website uses a free tool to translate into other languages. This tool is a guide and may not be accurate. For more, see: Information in your language
The home of mathematics education in New Zealand.
- Forgot password ?
- Teaching material
- Problem solving activities
- Problem Solving Information
- Problem Solving Strategies
Problem solving strategies
The Ministry is migrating nzmaths content to Tāhurangi. Relevant and up-to-date teaching resources are being moved to Tāhūrangi (tahurangi.education.govt.nz). When all identified resources have been successfully moved, this website will close. We expect this to be in June 2024. e-ako maths, e-ako Pāngarau, and e-ako PLD 360 will continue to be available.
For more information visit https://tahurangi.education.govt.nz/updates-to-nzmaths
What are problem solving strategies?
Strategies are things that Pólya would have us choose in his second stage of problem solving and use in his third stage ( What is Problem Solving? ). In actual fact he called them heuristics . They are a collection of general approaches that might work for a number of problems.
There are a number of common strategies that students of primary age can use to help them solve problems. We discuss below several that will be of value for problems on this website and in books on problem solving.
Common Problem Solving Strategies
- Guess (includes guess and check, guess and improve)
- Act It Out (act it out and use equipment)
- Draw (this includes drawing pictures and diagrams)
- Make a List (includes making a table)
- Think (includes using skills you know already)
We have provided a copymaster for these strategies so that you can make posters and display them in your classroom. It consists of a page per strategy with space provided to insert the name of any problem that you come across that uses that particular strategy (Act it out, Draw, Guess, Make a List). This kind of poster provides good revision for students.
An in-depth look at strategies
We now look at each of the following strategies and discuss them in some depth. You will see that each strategy we have in our list includes two or more subcategories.
- Guess and check is one of the simplest strategies. Anyone can guess an answer. If they can also check that the guess fits the conditions of the problem, then they have mastered guess and check. This is a strategy that would certainly work on the Farmyard problem described below but it could take a lot of time and a lot of computation. Because it is so simple, you may have difficulty weaning some students away from guess and check. As problems get more difficult, other strategies become more important and more effective. However, sometimes when students are completely stuck, guessing and checking will provide a useful way to start to explore a problem. Hopefully that exploration will lead to a more efficient strategy and then to a solution.
- Guess and improve is slightly more sophisticated than guess and check. The idea is that you use your first incorrect guess to make an improved next guess. You can see it in action in the Farmyard problem. In relatively straightforward problems like that, it is often fairly easy to see how to improve the last guess. In some problems though, where there are more variables, it may not be clear at first which way to change the guessing.
- Young students especially, enjoy using Act it Out . Students themselves take the role of things in the problem. In the Farmyard problem, the students might take the role of the animals though it is unlikely that you would have 87 students in your class! But if there are not enough students you might be able to include a teddy or two. This is an effective strategy for demonstration purposes in front of the whole class. On the other hand, it can also be cumbersome when used by groups, especially if a largish number of students is involved. Sometimes the students acting out the problem may get less out of the exercise than the students watching. This is because the participants are so engrossed in the mechanics of what they are doing that they don’t see the underlying mathematics.
- Use Equipment is a strategy related to Act it Out. Generally speaking, any object that can be used in some way to represent the situation the students are trying to solve, is equipment. One of the difficulties with using equipment is keeping track of the solution. The students need to be encouraged to keep track of their working as they manipulate the equipment. Some students need to be encouraged and helped to use equipment. Many students seem to prefer to draw. This may be because it gives them a better representation of the problem in hand. Since there are problems where using equipment is a better strategy than drawing, you should encourage students' use of equipment by modelling its use yourself from time to time.
- It is fairly clear that a picture has to be used in the strategy Draw a Picture . But the picture need not be too elaborate. It should only contain enough detail to help solve the problem. Hence a rough circle with two marks is quite sufficient for chickens and a blob plus four marks will do a pig. All students should be encouraged to use this strategy at some point because it helps them ‘see’ the problem and it can develop into quite a sophisticated strategy later.
- It’s hard to know where Drawing a Picture ends and Drawing a Diagram begins. You might think of a diagram as anything that you can draw which isn’t a picture. But where do you draw the line between a picture and a diagram? As you can see with the chickens and pigs, discussed above, regular picture drawing develops into drawing a diagram. Venn diagrams and tree diagrams are particular types of diagrams that we use so often they have been given names in their own right.
- There are a number of ways of using Make a Table . These range from tables of numbers to help solve problems like the Farmyard, to the sort of tables with ticks and crosses that are often used in logic problems. Tables can also be an efficient way of finding number patterns.
- When an Organised List is being used, it should be arranged in such a way that there is some natural order implicit in its construction. For example, shopping lists are generally not organised. They usually grow haphazardly as you think of each item. A little thought might make them organised. Putting all the meat together, all the vegetables together, and all the drinks together, could do this for you. Even more organisation could be forced by putting all the meat items in alphabetical order, and so on. Someone we know lists the items on her list in the order that they appear on her route through the supermarket.
- Being systematic may mean making a table or an organised list but it can also mean keeping your working in some order so that it is easy to follow when you have to go back over it. It means that you should work logically as you go along and make sure you don’t miss any steps in an argument. And it also means following an idea for a while to see where it leads, rather than jumping about all over the place chasing lots of possible ideas.
- It is very important to keep track of your work. We have seen several groups of students acting out a problem and having trouble at the end simply because they had not kept track of what they were doing. So keeping track is particularly important with Act it Out and Using Equipment. But it is important in many other situations too. Students have to know where they have been and where they are going or they will get hopelessly muddled. This begins to be more significant as the problems get more difficult and involve more and more steps.
- In many ways looking for patterns is what mathematics is all about. We want to know how things are connected and how things work and this is made easier if we can find patterns. Patterns make things easier because they tell us how a group of objects acts in the same way. Once we see a pattern we have much more control over what we are doing.
- Using symmetry helps us to reduce the difficulty level of a problem. Playing Noughts and crosses, for instance, you will have realised that there are three and not nine ways to put the first symbol down. This immediately reduces the number of possibilities for the game and makes it easier to analyse. This sort of argument comes up all the time and should be grabbed with glee when you see it.
- Finally working backwards is a standard strategy that only seems to have restricted use. However, it’s a powerful tool when it can be used. In the kind of problems we will be using in this web-site, it will be most often of value when we are looking at games. It frequently turns out to be worth looking at what happens at the end of a game and then work backward to the beginning, in order to see what moves are best.
- Then we come to use known skills . This isn't usually listed in most lists of problem solving strategies but as we have gone through the problems in this web site, we have found it to be quite common. The trick here is to see which skills that you know can be applied to the problem in hand. One example of this type is Fertiliser (Measurement, level 4). In this problem, the problem solver has to know the formula for the area of a rectangle to be able to use the data of the problem. This strategy is related to the first step of problem solving when the problem solver thinks 'have I seen a problem like this before?' Being able to relate a word problem to some previously acquired skill is not easy but it is extremely important.
Uses of strategies
Different strategies have different uses. We’ll illustrate this by means of a problem.
The Farmyard Problem : In the farmyard there are some pigs and some chickens. In fact there are 87 animals and 266 legs. How many pigs are there in the farmyard?
Some strategies help you to understand a problem. Let’s kick off with one of those. Guess and check . Let’s guess that there are 80 pigs. If there are they will account for 320 legs. Clearly we’ve over-guessed the number of pigs. So maybe there are only 60 pigs. Now 60 pigs would have 240 legs. That would leave us with 16 legs to be found from the chickens. It takes 8 chickens to produce 16 legs. But 60 pigs plus 8 chickens is only 68 animals so we have landed nearly 20 animals short.
Obviously we haven’t solved the problem yet but we have now come to grips with some of the important aspects of the problem. We know that there are 87 animals and so the number of pigs plus the number of chickens must add up to 87. We also know that we have to use the fact that pigs have four legs and chickens two, and that there have to be 266 legs altogether.
Some strategies are methods of solution in themselves. For instance, take Guess and improve . Supposed we guessed 60 pigs for a total of 240 legs. Now 60 pigs imply 27 chickens, and that gives another 54 legs. Altogether then we’d have 294 legs at this point.
Unfortunately we know that there are only 266 legs. So we’ve guessed too high. As pigs have more legs than hens, we need to reduce the guess of 60 pigs. How about reducing the number of pigs to 50? That means 37 chickens and so 200 + 74 = 274 legs.
We’re still too high. Now 40 pigs and 47 hens gives 160 + 94 = 254 legs. We’ve now got too few legs so we need to guess more pigs.
You should be able to see now how to oscillate backwards and forwards until you hit on the right number of pigs. So guess and improve is a method of solution that you can use on a number of problems.
Some strategies can give you an idea of how you might tackle a problem. Making a table illustrates this point. We’ll put a few values in and see what happens.
From the table we can see that every time we change the number of pigs by one, we change the number of legs by two. This means that in our last guess in the table, we are five pigs away from the right answer. Then there have to be 46 pigs.
Some strategies help us to see general patterns so that we can make conjectures. Some strategies help us to see how to justify conjectures. And some strategies do other jobs. We’ll develop these ideas on the uses of strategies as this web-site grows.
What strategies can be used at what levels?
In the work we have done over the last few years, it seems that students are able to tackle and use more strategies as they continue with problem solving. They are also able to use them to a deeper level. We have observed the following strategies being used in the stated Levels.
Levels 1 and 2
- Draw a picture
- Use equipment
- Guess and check
Levels 3 and 4
- Draw a diagram
- Guess and improve
- Make a table
- Make an organised list
It is important to say here that the research has not been exhaustive. Possibly younger students can effectively use other strategies. However, we feel confident that most students at a given Curriculum Level can use the strategies listed at that Level above. As problem solving becomes more common in primary schools, we would expect some of the more difficult strategies to come into use at lower Levels.
Strategies can develop in at least two ways. First students' ability to use strategies develops with experience and practice. We mentioned that above. Second, strategies themselves can become more abstract and complex. It’s this development that we want to discuss here with a few examples.
Not all students may follow this development precisely. Some students may skip various stages. Further, when a completely novel problem presents itself, students may revert to an earlier stage of a strategy during the solution of the problem.
Draw: Earlier on we talked about drawing a picture and drawing a diagram. Students often start out by giving a very precise representation of the problem in hand. As they see that it is not necessary to add all the detail or colour, their pictures become more symbolic and only the essential features are retained. Hence we get a blob for a pig’s body and four short lines for its legs. Then students seem to realise that relationships between objects can be demonstrated by line drawings. The objects may be reduced to dots or letters. More precise diagrams may be required in geometrical problems but diagrams are useful in a great many problems with no geometrical content.
The simple "draw a picture" eventually develops into a wide variety of drawings that enable students, and adults, to solve a vast array of problems.
Guess: Moving from guess and check to guess and improve, is an obvious development of a simple strategy. Guess and check may work well in some problems but guess and improve is a simple development of guess and check.
But guess and check can develop into a sophisticated procedure that 5-year-old students couldn’t begin to recognise. At a higher level, but still in the primary school, students are able to guess patterns from data they have been given or they produce themselves. If they are to be sure that their guess is correct, then they have to justify the pattern in some way. This is just another way of checking.
All research mathematicians use guess and check. Their guesses are called "conjectures". Their checks are "proofs". A checked guess becomes a "theorem". Problem solving is very close to mathematical research. The way that research mathematicians work is precisely the Pólya four stage method ( What is Problem Solving? ). The only difference between problem solving and research is that in school, someone (the teacher) knows the solution to the problem. In research no one knows the solution, so checking solutions becomes more important.
So you see that a very simple strategy like guess and check can develop to a very deep level.
IMAGES
VIDEO
COMMENTS
Problem Solving. Draw Diagram. In mathematics, diagrams are often a useful way of organising information and help us to see relationships. A diagram can be a rough sketch, a number line, a tree diagram or two-way table, a Venn diagram, or any other drawing which helps us to tackle a problem. Labels (e.g. letters for vertices of a polygon) are ...
DRAW A PICTURE/DIAGRAM/MODEL Drawing a picture/diagram/model is the most common problem-solving strategy. Very often, students need to draw a picture/diagram/model just to understand the problem. The picture/diagram/model represents the problem in a way students can "see" it, understand it, and think about it while they look for the next step.
These word problems could be used with grades 2-4 and include a page that specifically states, "Draw a picture…" and then another page of problems were it would be useful to draw a picture, but it is not explicitly stated. The goal is to get students used to organizing the information in a meaningful way to help them better think about ...
The draw a picture strategy is a problem-solving technique in which students make a visual representation of the problem. For example, the following problem could be solved by drawing a picture: A frog is at the bottom of a 10-meter well. Each day he climbs up 3 meters. Each night he slides down 1 meter. On what day will he reach the top of the ...
Getting ready to draw. When you're ready to start solving word problems with pictures, follow Jan Rowe's steps: Read the entire problem: Get all the facts and underline keywords. Answer the question: What am I looking for? Draw a picture or diagram: Visualize as a real-world situation. Solve the problem: Set up the equation and solve.
Within this download, we are offering you a range of word problems for practice. Each page provided contains a single problem solving word problem. Below each story problem you will find a set of four steps for students to follow when finding the answer. This set will focus on the draw a picture strategy for math problem solving.
Elementary Math Problem Solving - Draw a pictureIn this video, we explore one of eight problem-solving strategies for the primary math student. Students are ...
Problem solving strategies and drawing a diagram to visualize a confusing problem. The steps to use a strategy. Visualizing negatives and positives.#1.8If yo...
1. Create a Diagram/draw a picture. Creating a diagram helps students visualize the problem and reach the solution. A diagram can be a picture with labels, or a representation of the problem with objects that can be manipulated. Role-playing and acting out the problem like a story can help get to the solution. Example.
Problem Solving in mathematics generally explores how to approach a question that is totally new to you and does not automatically lend itself to a formula o...
Using logic is a strong approach to solving math problems! This tutorial goes through an example of using logical reasoning to find the answer to a word problem. Virtual Nerd's patent-pending tutorial system provides in-context information, hints, and links to supporting tutorials, synchronized with videos, each 3 to 7 minutes long. In this non ...
Have students draw diagrams of married relations and devise their own interesting questions for their classmates. For example, this picture: makes me think of the questions … At a party, three-quarters of the attendees are married and two people were not. If each married person came with his or her spouse, what is the smallest possible number of
Make problem solving easier for students be teaching multiple strategies. Here is an explanation of how and why to encourage students to draw pictures for solving math word problems. Teaching students to draw pictures illustrating the details has many benefits. Draw Pictures Strategy - Problem Solving No matter what grade, drawing pictures can make solving problems a go-to strategy.
To perform a cause-and-effect analysis, follow these steps. 1. Start with a problem statement. The problem statement is usually placed in a box or another shape at the far right of your page. Draw a horizontal line, called a "spine" or "backbone," along the center of the page pointing to your problem statement. 2.
Drawing a digram is a powerful problem solving technique. The right diagram can reveal hidden relationships that lie hidden behind facts and figures. Try these five simple visualizations for everyday decision making. ... You may want to do this in a notebook where you can draw out the model on the pages and flip between them. Alternatively, you ...
In conclusion, drawing diagrams in math is a valuable tool that can improve your understanding, problem-solving skills, and overall engagement with the subject. Embrace the joy of creating diagrams for geometric figures and unlock the visual beauty of math in your mathematical journey. So grab your ruler, pencil, and paper, and start exploring ...
Drawing strip diagrams is a process that actually begins in Kindergarten and 1st grade when students should be drawing pictures to represent word problems. Students should understand that the numbers in a problem represent something—pizzas, soccer players, apples, money saved—and their drawings should include labels identifying what the ...
This problem solving unit covering "Draw a Picture or Diagram" is one of 9 units focusing on 8 problem solving strategies plus a series of Mixed Problems in which students decide on the most appropriate strategy to solve each problem. ... a Worked Example and 6 colorful, motivational problems in which students are encouraged to apply the ...
Examples of using a diagram to reason a solution Problem. There are twenty people at a party and they each shake hands once. How many handshakes will there be? Diagram Handshakes between people represented as a diagram. This diagram was drawn by a Year 8 student solving the handshake problem above. The teacher asked the student to draw the ...
A fishbone diagram is a problem-solving approach that uses a fish-shaped diagram to model possible root causes of problems and troubleshoot possible solutions. It is also called an Ishikawa diagram, after its creator, Kaoru Ishikawa, as well as a herringbone diagram or cause-and-effect diagram. Fishbone diagrams are often used in root cause ...
Abstract. Uncovering the interplay between drawings, mental representations, and arithmetic problem-solving strategies in children and adults. There is an ongoing debate in the scientific community regarding the nature and role of the mental representations involved in solving arithmetic word problems. In this study, we took a closer look at ...
What are problem solving strategies? ... Here we discuss both Drawing a Picture and Drawing a Diagram. ... The trick here is to see which skills that you know can be applied to the problem in hand. One example of this type is Fertiliser (Measurement, level 4). In this problem, the problem solver has to know the formula for the area of a ...
About Press Copyright Contact us Creators Advertise Developers Terms Privacy Policy & Safety How YouTube works Test new features NFL Sunday Ticket Press Copyright ...