Protein Synthesis and Codons Practice

Protein synthesis is the process where a sequence of DNA is used to build a protein from individual amino acids. The first step in this process is called TRANSCRIPTION , where a coding region of DNA is converted to messenger RNA (mRNA). During transcription, mRNA is made from the DNA sequence following the base pair rule, except RNA does not contain the base T hymine, but instead has U racil. The mRNA then leaves the nucleus and goes to a ribosome in the cell's cytoplasm. The ribosome reads the message three bases at a time, called a CODON . Each codon will specify a single amino acid. The amino acids are joined together and folded into a protein, a process called TRANSLATION
- DNA is used to make a copy of mRNA (Transcription)
- mRNA leaves the nucleus and goes to ribosomes
- 3 bases = codon
- 1 codon = a single amino acid
- A chain of amino acids = a protein
- Protein synthesis is also called Translation
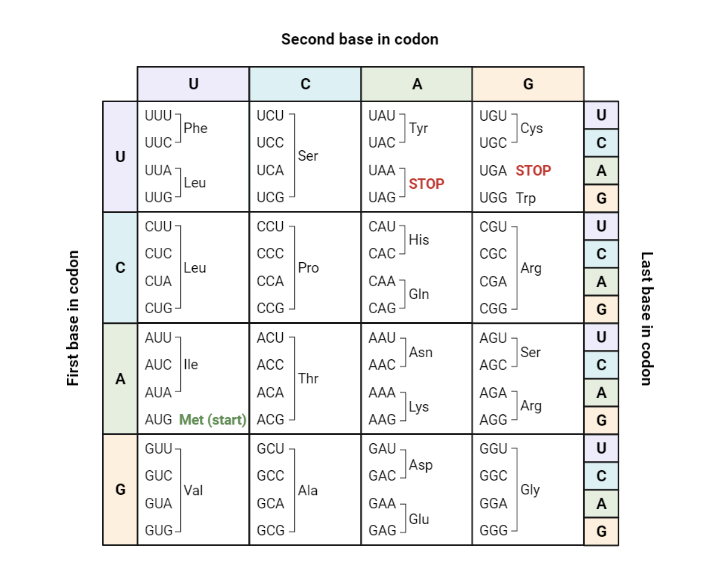
Biologists use a codon chart or a codon wheel to determine the amino acids. Amino acids are usually abbreviated on these charts as three letter words, like Cys and Ser.

1. Use the codon chart to write the amino acid that corresponds to each codon found in mRNA:
C C C ______________________ A G U ______________________ C A G ______________________ U A C ______________________ G A A ______________________ C G U ______________________ U U U ______________________ C C A ______________________
2. Write the CODON that corresponds with each amino acid. There may be more than one. The full names are written, but the codon chart only shows the first three letters.
pro line ______________________ gly cine ______________________ val ine ______________________ phe nylalanine ______________________ his tidine ______________________ arg inine ______________________
3. A single codon is used to signal the beginning of protein synthesis. It is commonly called the START CODON.
Locate the start codon on the chart. What are the three bases of this codon? ________
4. There are three codons that signal the end of synthesis, these are called STOP codons.
What are the three stop codons? ________________________________
5. For each sequence of DNA is shown. Write the complementary RNA sequence underneath the letters, then use the codon chart to determine the amino acid sequence:
DNA → T A C C A T G G A A G T A C T RNA →
Amino Acids →
DNA → T T C A A T G G T C T A G G G RNA →
DNA → A C A T T T C A G A C C G T C RNA →

Related Activities
Mutations in DNA and Proteins – explore how mutations can affect the gene for human insulin
DNA, Proteins, and Sickle Cell – explore how a single change (mutation) in DNA can result in a blood disorder
Coloring DNA – basic image of DNA and RNA for students to color following directions; includes questions and analysis
DNA Crossword – puzzle to practice basic terms related to DNA
DNA Detectives: The Case of the Radioactive Phosphorous – a short story about the Hershey Chase experiment with questions.
BIOLOGY JUNCTION
Test And Quizzes for Biology, Pre-AP, Or AP Biology For Teachers And Students
Protein Synthesis Worksheet: Definition, Examples & Practice

Meta: Need to learn how protein synthesis works? We’ve got your complete guide to the process on our protein synthesis worksheet, including the difference between DNA and RNA, important misconceptions about mutations, and an explanation of the central dogma of biology. Plus, get practice exercises and quiz questions.
What is Protein Synthesis?
Protein synthesis is the construction of proteins within living cells. The process consists of two parts; transcription and translation.
Proteins are an important organic compound that exists in every living organism. They are an essential part of the majority of cell functions. Specific proteins are needed for particular functions. Proteins are made up of long chains of amino acids which can be arranged in either a linear pattern or can be folded to form a more complex structure.
Proteins can be complex in structure and so are filtered into four categories – primary secondary, tertiary and quaternary.
Protein synthesis is a biological procedure which living cells perform to create new proteins. When studied in detail, the chemical synthesis of proteins process is extremely complex. The process begins with the production of new and different amino acids, some of which are collected from food sources.
The process requires ribonucleic acid (RNA), deoxyribonucleic acid (DNA), and a specific set of enzymes. All the different types of ribonucleic acids are needed for protein synthesis to work effectively. These are messenger ribonucleic acid (mRNA), transfer ribonucleic acid (tRNA), and ribosomal ribonucleic acid (rRNA).
Protein Synthesis: Definition, Examples, and Practice
Let’s check out a couple of important definitions to better understand protein synthesis.
Most protein synthesis worksheets will require a working understanding of the following definitions:
Central Dogma of Biology
A polypeptide encoded in a gene is expressed in a directional relationship called the central dogma of biology . It recognizes that information moves from the DNA to the RNA to the protein.
Deoxyribonucleic acid (otherwise known as DNA), is the carrier of genetic info found in almost every found living organism to date. It is present in the nucleus of cells and is self-replicating, meaning it’s integral to protein synthesis.
RNA is ribonucleic acid, and it’s present in every living cell discovered to date. It is a messenger and vitally involved in translating genetic code from DNA to the ribosomes so that amino acids can be created.
There are three kinds of RNA: messenger RNA (mRNA) transfers the genetic code from the DNA in the nucleus out to the ribosomes in the cytoplasm. Ribosomal RNA (rRNA) provides the structure for the ribosomes. Finally, transfer RNA (tRNA) works during translation to bring the amino acids to the ribosome so that a polypeptide (an amino acid chain) can be built.
Transcription
Transcription is the stage of manufacturing in which the DNA gene sequence is copied so that an RNA molecule can be made. We’ll explain more shortly.
Translation
The second stage of protein synthesis is translation. At this point in the process, a mRNA (messenger RNA) molecule is “read” and the information is used by the ribosome to build a polypeptide.
Polypeptide
A polypeptide is a chain made up of amino acids.
Three nucleotides form a codon. This codon is then used to create amino acids.
RNA vs. DNA
It’s tempting to confuse RNA with DNA, but they’re very different, and it’s important to understand these differences. They are both made up of nucleotides, which are the basic units of nucleic acids (like DNA and RNA). These nucleotides contain a phosphate group, a nitrogenous base, and a 5-carbon sugar ribose.
Instead of DNA’s ribose, however, RNA uses deoxyribose, a different kind of sugar. Also, RNA is most often a single strand, while DNA is famously double-stranded. Finally, DNA contains thymine, while RNA uses uracil instead.
Chromosomes
DNA is found by the meter inside even minuscule cells. During replication, the masses of coiled DNA called chromatin (shaped thanks to proteins called histones) organize into what are called chromosomes.
Different types of cells (eukaryotes) have chromosomes in varying amounts. Humans, as you probably know, have 46 chromosomes, while dogs, for example, have 78.
Transcription and Translation
To best understand your protein synthesis worksheet, let’s cover the complete protein synthesis process. It starts with transcription. Special enzymes in the nucleus arrive to gently pull apart the DNA code needed, and RNA begins to transcribe or rewrite the genetic material.
During translation, the mRNA connects with the ribosome and its information is decoded again so that the correct sequence of amino acids will connect to form a polypeptide. It’s important to note here that the ribosome doesn’t make protein nor does it make amino acids. It simply instructs already-made amino acids to form the correct sequence.
The amino acids’ sequence determines its protein’s shape, function, and properties and it can do so thanks to the RNA’s four bases (all of which are nucleotides): adenine (A), cytosine (C), guanine (G), and uracil (U). A codon, as we explained earlier, is a combination of three of these bases in a specific order: UUC, for example.
Some codons tell the ribosome to start or stop (UAA, UAG, and UGA indicate stop) and the rest indicate specific amino acids.
Understanding the Codon Table

Image Source: sabal.uscb.edu
The heart of protein synthesis (and what you’ll most likely see on a protein synthesis worksheet) is the codon table. It helps us work through translation to understand the amino acids the mRNA is prescribing. For example, if you want to know what the codon CAA translates to, you’ll use the first letter of the codon (C) to locate the corresponding row on the left side of the chart.
Next, use the second letter of the codon (A) to identify the corresponding column on the top of the chart. The box indicated includes four codons that began with C and A; if you’d like, you can simply identify your codon there, or you can use the right side of the chart to identify the corresponding order of the third letter in the codon (A).
Either way, the single amino acid for CAA is Gln (glutamine).
Mutations sound scary, but don’t worry–we’re not talking about superheroes with latent power and plans for world domination. Instead, we’re talking about what happens when there’s a mistake in the transcription or translation process.
Mutations come in three forms: silent, missense, and nonsense. A mutation that is silent means that the amino acid will not be impacted during translation. Missense mutations mean that the single amino acid has been changed and a nonsense mutation ends prematurely.
How are Mutations Caused?
There are several different reasons a mutation may occur. If at least one base is added to a DNA sequence, this is referred to as an insertion. A deletion, however, occurs when at least one base has been removed from the DNA sequence.
Similarly, when a change is made to the codons so that the reading frame of the sequence is changed, the resulting mutation is called a frameshift mutation. For example, a mRNA codon that reads AUG-AUA-CGG-AAU might experience an insertion of a T in the DNA sequence.
This frameshift mutation leads to a new codon: AUG-UAC-GGA-AU.
If we utilize the codon chart, we find that the polypeptide mutates from Met-Ile-Arg-Asn to Met-Tyr-Gly.
Common Misconceptions About Mutations
Something important to note is that sometimes the DNA sequence experiences an insertion or deletion of three nucleotides in a row. This doesn’t cause a frameshift mutation. Instead, it will just impact whether or not the deleted or inserted amino acids are added or not.
This can cause a dramatic change in the outcome of the polypeptide.
Another common misconception is that a mutation is always dramatic. While this is sometimes the case, mutations are common and provide the genetic variation we so appreciate in life. Many mutations have little to no impact on life, and some mutations even create good changes.
It’s a very limited number of mutations that survive to be problematic.
What Exactly Are Genes?
A gene is a short section of DNA that acts as an instruction manual for our bodies. DNA is found inside almost every cell in the body.
Genes contain the instructions that tell cells to create new proteins via protein synthesis. Every gene carries certain instructions which make up who you are such as eye color, height, and hair color. Genes come in many different types and versions for each feature. For example, one variant of a gene may contain instructions for blue eyes whereas another contains instructions for brown eyes. Genes are so small that there are around 20,000 inside each cell in the body. The entire sequence of your genes is named the genome.
How Do Genes Work?
Genes are responsible for telling each of your cells what to do and when to do it. They do this by making proteins. Why are proteins important? Well, our bodies are made up of proteins. Around 50% of a cell is some form of protein. Proteins are also responsible for many bodily functions such as digestion, immunity, circulation, motion, and communication between cells. These are made possible by the estimated 100,000 different proteins that are produced in the body.
Genes within your DNA don’t make proteins directly. Instead, enzymes read and copy the DNA code. The section of DNA that is to be copied gets unzipped by an enzyme which then uses that segment of DNA as a template to build a single-stranded molecule of ribonucleic acid. This ribonucleic acid then leaves the nucleus of the cell and enters the cytoplasm where ribosomes then translate the code to create the specific protein.
In certain genes, not all of the DNA sequence is used to make a protein. The section of DNA that is non-coding is known as introns. The coding sections of DNA are called exons.
The Structure of DNA
DNA is made up of pairs of nucleotides on a phosphate and sugar backbone. There are four different nucleotides: thymine, cytosine, guanine, and adenine. Each of the types of nucleotides only pairs with one other type. Hydrogen bonds connect to those nucleotide pairs. The sugar and phosphate backbone, along with the nucleotide pairs form a ladder-like structure that twists to form the double helix structure of DNA. Each side of this ladder shape is known as a strand of DNA.
Nucleotides consist of a base, a phosphate group, and five carbon atoms. Each of the different types of nucleotide has a base with a different structure, however, all the bases contain nitrogen. The four bases can be split into two groups. These are pyrimidine bases and purine bases. Pyrimidine bases are small and have one six-atom ring. Purine bases are larger and are made up of a six-atom ring plus a five-atom ring which are joined by two shared atoms. Thymine and cytosine are pyrimidine bases and adenine and guanine are purine bases.
Pyrimidine bases bond to purine bases because the shapes of these bases allow hydrogen bonds to form between them. The base pairing rules states that guanine pairs only with cytosine and adenine pairs only with thymine. This rule is known as complementary base pairing. Three hydrogen bonds form between a guanine and cytosine pair whereas only two hydrogen bonds form between an adenine and thymine base pair.
Protein Synthesis Worksheet Practice
It’s helpful to utilize practice protein synthesis worksheets . To help you, here’s a list of questions–and their answers–that you’re likely to find on tests, worksheets, and protein synthesis projects:
- During translation, which RNA carries amino acids to the ribosome? (transfer RNA or tRNA)
- Is DNA made with uracil or thymine? (thymine)
- In which part of the cell does transcription happen? (in the nucleus)
- Which RNA carries the genetic code to the ribosomes from the DNA? (messenger RNA or mRNA)
- What is the central dogma of biology? (DNA → RNA → protein)
- What are the building blocks of proteins? (amino acids)
- What are the three causes of mutations? (insertion, deletion, and frameshift)
- What is a codon? (three nucleotides)
- What are the three differences between DNA and RNA? (RNA uses deoxyribose instead of ribose, is single-stranded instead of double-stranded, and contains uracil instead of thymine)
- In what phase is tRNA molecules used? (translation)
- Does protein synthesis build protein? (no; protein synthesis builds amino acids)
- What are polypeptides? (chains of amino acids)
- What do codons do? (indicate the specific amino acid and in what order, and indicate when to stop and start the amino acid chain)
- Which leaves the nucleus: DNA or RNA? (RNA)
- What are the three kinds of mutations? (silent, missense, and nonsense)
- Which codons indicate stop? (refer to the codon chart for the answer; UAA, UAG, and UGA)
- What does chromatin organize into during replication? (chromosomes)
Practice with the Codon Chart
Another great way to increase your knowledge of protein synthesis and better prepare for protein synthesis worksheets is to practice with the codon chart . You can find the solutions in parenthesis after the example:
- CUU-CGU-AAU-UGG-AAG (leu-arg-asn-trp-lys)
- ACU-ACA-AGU-UGC-UUU (thr-thr-ser-cys-phe)
- AAC-AAG-GUC-GUC-AGG (asn-lys-val-ile-arg)
Protein synthesis is a complex, highly tuned process that enables life to flourish. Understanding it, from the DNA to the RNA to the amino acids, gives us a better appreciation for life itself. Use our protein synthesis worksheet practice questions to help you learn the ins and outs of protein synthesis and remember the informaion.
Leave a Reply Cancel reply
Your email address will not be published. Required fields are marked *


More Protein Synthesis Practice
Loading ad...

Dana Lawdenski
More practice with protein synthesis processes of transcription and translation, including reading a codon chart.
- Google Classroom
- Microsoft Teams
- Download PDF

Protein Synthesis Practice Worksheet
- DNA is used to make a copy of mRNA (transcription)
- mRNA leaves the nucleus and goes to ribosomes
- 3 bases = codon
- 1 codon = a single amino acid
- A chain of amino acids = a protein
- Protein synthesis is also called translation
- Open access
- Published: 07 May 2024
Effects of improved amino acid balance diet on lysine mammary utilization, whole body protein turnover and muscle protein breakdown on lactating sows
- Sai Zhang 1 , 2 ,
- Juan C. Marini 3 ,
- Vengai Mavangira 4 ,
- Andrew Claude 4 ,
- Julie Moore 1 ,
- Mahmoud A. Mohammad 3 &
- Nathalie L. Trottier 1 , 5
Journal of Animal Science and Biotechnology volume 15 , Article number: 65 ( 2024 ) Cite this article
225 Accesses
Metrics details
The study objective was to test the hypothesis that low crude protein (CP) diet with crystalline amino acids (CAA) supplementation improves Lys utilization efficiency for milk production and reduces protein turnover and muscle protein breakdown. Eighteen lactating multiparous Yorkshire sows were allotted to 1 of 2 isocaloric diets (10.80 MJ/kg net energy): control (CON; 19.24% CP) and reduced CP with “optimal” AA profile (OPT; 14.00% CP). Sow body weight and backfat were recorded on d 1 and 21 of lactation and piglets were weighed on d 1, 14, 18, and 21 of lactation. Between d 14 and 18, a subset of 9 sows (CON = 4, OPT = 5) was infused with a mixed solution of 3-[methyl- 2 H 3 ]histidine (bolus injection) and [ 13 C]bicarbonate (priming dose) first, then a constant 2-h [ 13 C]bicarbonate infusion followed by a 6-h primed constant [1- 13 C]lysine infusion. Serial blood and milk sampling were performed to determine plasma and milk Lys enrichment, Lys oxidation rate, whole body protein turnover, and muscle protein breakdown.
Over the 21-d lactation period, compared to CON, sows fed OPT had greater litter growth rate ( P < 0.05). Compared to CON, sows fed OPT had greater efficiency of Lys ( P < 0.05), Lys mammary flux ( P < 0.01) and whole-body protein turnover efficiency ( P < 0.05). Compared to CON, sows fed OPT tended to have lower whole body protein breakdown rate ( P = 0.069). Muscle protein breakdown rate did not differ between OPT and CON ( P = 0.197).
Feeding an improved AA balance diet increased efficiency of Lys and reduced whole-body protein turnover and protein breakdown. These results imply that the lower maternal N retention observed in lactating sows fed improved AA balance diets in previous studies may be a result of greater partitioning of AA towards milk rather than greater body protein breakdown.
The increasing availability of crystalline amino acid (CAA) at competitive costs relative to protein ingredients allows for reduction of excessive dietary nitrogen (N) and improving AA balance [ 1 ]. Several studies have shown that improving dietary AA balance in lactating sows leads to greater milk casein yield [ 2 , 3 ] and utilization efficiency of N and essential amino acid (EAA) [ 4 , 5 ] while dramatically mitigating N losses and ammonia emissions to the environment [ 2 ]. Lysine efficiency values previously reported [ 4 , 5 , 6 ] were estimated based on lean mass change during lactation. This approach yielded similar efficiency estimates for Val based on isotopic method [ 7 ]. Lysine utilization efficiency values in lactation using an isotopic approach have not been reported.
The increased apparent AA efficiency may be at the expense of sow body weight (BW) loss and reduced maternal N retention whereby partitioning of dietary AA and energy towards the mammary glands appears to be favoured [ 3 , 5 , 8 ]. Preserving maternal N pool during the lactation period is important since maternal body protein and lipid loss can affect subsequent production performance. Loss in performances may include delayed estrus [ 9 ], reduction of piglet birth weight and litter uniformity [ 10 , 11 ], and prolonged interval from weaning to successful pregnancy [ 12 ], thus compromising the overall life span production efficiency. It is unknown whether the reduced maternal N retention previously reported [ 3 , 5 ] in sows fed an improved AA balance diet was a result of greater maternal body protein breakdown. In addition, whole body and muscle protein breakdown rates in lactating sows are unknown and such values are critical to assess at a mechanistic level the impact of improved dietary AA balance on body protein dynamic. Isotope technique allows for better mechanistic understanding of protein dynamics, including protein turnover rate, AA flux and muscle protein breakdown in humans [ 13 ] and animals [ 14 ].
We hypothesized that low CP diet with improved AA balance would increase milk yield through improving efficiency of Lys for milk and increasing maternal body and muscle protein breakdown. The objectives were to (1) measure whole body protein dynamics and (2) estimate Lys utilization efficiency for milk synthesis.
Materials and methods
Dietary treatments.
The NRC model [ 6 ] was used to estimate requirements for AA, net energy (NE), calcium (Ca) and phosphorus (P). The requirements were predicted based on the following parameters: sow BW of 210 kg after parturition, parity number of 2 and above, average daily intake of 6 kg/d, litter size of 10, piglet average daily gain (ADG) of 280 g/d over a 21-d lactation period, and an ambient temperature of 20 °C. The model predicted a minimum sow BW loss of 7.5 kg and the protein to lipid ratio in the model was adjusted to the minimum allowable value of near zero. The model predicted SID Lys requirement of 0.90% and NE requirement of 2,580 kcal/kg.
A control diet (CON) was formulated using corn and soybean meal as the only sources of Lys to meet the SID Lys requirement (0.90%) and consequently contained 19.24% CP and a SID Val concentration 0.77% which was near the NRC (2012) requirement of 0.79%. All other EAA SID contents were in excess relative to NRC (2012). The SID AA values of feed ingredients were referred to NRC (2012). A second diet was formulated to improve AA balance [ 5 ], and referred to as optimal diet (OPT) throughout the manuscript. Fermentable fiber was high in CON due to high content of soybean meal with 24.88% fermentable fiber [ 6 ]. Thus, the same fiber source (soy hulls) was supplemented in OPT, and levels of fermentable fiber were consistent between CON and OPT. Ingredients and calculated nutrient composition of CON and OPT diets are presented in Table 1 . Analyzed total (hydrolysate) and free AA concentrations are presented in Table 2 , in order to verify the precision of diet formulation. The analyzed N concentration corresponded to a CP% of 18.44 compared to a calculated value of 19.24% CP. Therefore, the analyzed CP concentration value is used in the heading for the remainder of tables.
Animals and feeding
The study was conducted at the Michigan State University Swine Teaching and Research Center. A total of 18 purebred multiparous (parity 2+) Yorkshire sows were moved to conventional farrowing crates between d 105 and 107 of gestation, grouped by parity, and randomly assigned to 1 of 2 dietary treatments within parity groups (CON, n = 9; OPT, n = 9). The study was conducted over 3 blocks of time, with 6, 6, and 5 sows in each block, respectively. One sow in CON from block 3 was removed due to poor feed intake that was deemed unrelated to the dietary treatments. Sows were adapted to the experimental diets (2.2 kg/d) 4 to 6 d before the expected farrowing date. Following farrowing, sows feed allowance progressively increased from 1.88 kg/d on d 1 to 7.44 kg/d at d 21, according to the NRC model [ 6 ], with a targeted ADFI of 6.0 kg/d over the 21-d lactation period. Feed was provided daily in 3 equal meals (0700, 1300, and 1900) with feed intake and refusal recorded daily before the morning meal. On infusion days (between d 14 and 18), the 0700 and 1300 meals were divided into 6 aliquots fed every 2 h from 0700 to 1700. Water was freely accessible to sows and piglets. Litters were aimed to be standardized to 11 piglets within the first 24 h after farrowing with the objective of weaning 10 piglets per sow. Injection of iron and surgical castration of male were conducted on d 1 and 7, respectively, according to the institutional research farm protocol. No creep feed was supplied to the piglets. Body weight and backfat thickness [ 5 ] of sows were recorded on d 1 and 21, and litter weights were recorded on d 1, 14, 18 and 21. Milk yield was estimated for peak lactation (between d 14 and 18) [ 5 ]. Prediction equation for milk yield during peak lactation is as follows [ 15 ]: \(\mathrm{Daily}\;\mathrm{milk}\;\mathrm{yield}\;(\text{g}/\text{d})=\mathrm{littersize}\times(582+1.168\times\text{ADG}+0.00425\times\text{ADG}^2)\)
Bilateral ear vein catheterization
A subset of 10 sows (5 sows per treatment) was used for the catheterization and infusion protocol. An ear vein catheter was placed in each ear, with one ear serving as the infusion line and the other as the sampling line. For the length of the catheterization procedure, piglets were removed and transferred to an empty adjacent stall with a heat lamp. The sows were restrained with a rope snare and remained in their farrowing stall where sedation was induced. For sedation, Telazol was reconstituted with 2.5 mL of 100 mg/mL ketamine and 2.5 mL of 100 mg/mL xylazine to a volume of 5 mL. This sedative mixture was administered i.m. in the brachiocephalicus muscle approximately 6 cm caudal to the ear, at a dosage of 0.1 mL/4.537 kg body weight. Sows were carefully assisted to facilitate laying in ventral recumbence. Sedation lasted for 45 to 60 min. The depth of anesthesia was monitored by the degree of muscle relaxation and respiration rate (i.e., 10 to 25 breaths/min).
The entire dorsal surface of both ears was prepared for aseptic placement of the ear vein catheters. The skin was scrubbed gently with 10% betadine solution followed with 70% isopropyl alcohol. The hair covering the skin area caudal to the ear and dorsal to the neck was clipped using a professional clipper to ensure a good adhesion of veterinary adhesive tape to the skin (described below).
A pre-cut 61-cm, round tip, medical grade microbore intravascular tubing (1.65 mm o.d., 1.02 mm i.d.) with hydromer coating (Access Technology Corp., Skokie, IL, USA) was prefilled at the time of catheterization with heparinized saline (30 IU/mL) before insertion. A hand tourniquet was applied at the base of the ear to distend the medial and lateral branches of the auricular vein. Either vein was used for catheterization. A short-term stylet catheter (14G, 5.08 cm, Safety IV catheter; B. Braun Melsungen AG, Germany) was inserted into the vein with the needle bevel facing up. Upon appearance of blood, the vein was gently occluded, and the needle rotated 180° to angle the bevel facing down. While holding the needle in place, the stylet catheter was gently pushed into the vein through the needle. Once the stylet was in place, the needle was removed, and the intravascular tubing was inserted through the stylet and pushed for approximately 30 cm caudally to reach the external jugular vein, and the catheter verified for patency at this point. Small sections of tape (5.1 cm wide, ZONAS® porous tape, Johnson & Johnson Consumer Companies, Inc., Skillman, NJ, USA) were affixed to the remaining section of intravascular tubing and sutured to the skin to secure the tubing in place. The stylet catheter was also sutured (Monocryl, CP-1, 36 mm, 1/2c; Ethicon Inc., USA) to the skin at the point of entry. Gauze was placed over each sutured sites and held in position by wrapping the ear with elastic adhesive tape. A connector was used to join the intravascular tubing to a long tubing extension (approximately 120 cm). A blunt-end needle adapter with an adaptor injection cap and a male luer lock was placed onto the distal end of the tubing extension. The same vein catheterization procedure was done on the other ear. A final layer of elastic adhesive tape (7.5 cm wide, 3M veterinary adhesive tape) was used to wrap each ear into a gently folded cone shape and to affix extension tubing directly onto the clipped skin surface. The extension tubing ran from the ears to the dorsal region of the neck, caudally to the ears and cranial to the shoulders and the free end (approximately 100 cm) rolled up and placed in a handmade denim protective pouch mounted on 4.0-cm thick foam material. The pouch was kept in place by gluing the foam directly onto the skin with Livestock ID Tag Cement (W.J. Ruscoe Company, Akron, OH, USA). Catheters were verified for patency once more and the lines were filled with sterile saline, coiled, and placed in the pouch until used for infusion and blood sampling. The entire procedure was done following sterile techniques and lasted 45 to 90 min per sow. As soon as sows were able to stand, 15-cm wide elastic bandage (Novation ® , Hartmann USA, Inc., Rock Hill, SC, USA) was wrapped over the pouch and around the neck and thorax in at least 3 layers in the shape of a life vest (crisscross) to protect the pouch. Thereafter, the catheters were verified for patency and flushed with sterilized heparinized saline (30 IU/mL) twice per day.
Catheters were removed after all infusions and blood sampling were completed (blood sampling lasted for 3 d for 3MH; Fig. 1 ). The elastic bandaging was removed, and the elastic adhesive tape was carefully pulled to expose the sutures. The sutures were cut with small surgical scissors, the catheters were gently pulled out of the ear veins, and pressure was applied over the insertion sites to accelerate coagulation. The remaining adhesive tape was then carefully removed, and the pouch was freed from the foam which remained on the sow. Rectal temperature was recorded from the day of catheterization and for 3 d following removal of catheters.

Plasma isotopic enrichment of 3-[methyl- 2 H 3 ]histidine following 3-[methyl- 2 H 3 ]histidine bolus infusion during peak lactation (between d 14 and 18) for sows fed control (CON; 18.4% CP; n = 4) and optimal (OPT; 14.0% CP; n = 4) diets. Plasma isotopic enrichment of 3-[methyl- 2 H 3 ]histidine differed between diets ( P < 0.001) and time points ( P < 0.001), with no interaction between diet and time ( P = 0.894). Standard error of the mean (SEM) = 0.214
Preparation of isotope solutions
Tracers were weighed, dissolved in saline and the solution sterilized by filtration through Millipore Steriflip filters (0.22 μm). For each sow, the following stock solutions were prepared: 3-[methyl- 2 H 3 ]histidine (183 μmol in 20 mL saline for bolus injection), [ 13 C]bicarbonate (368 μmol in 20 mL saline for prime and 736 μmol in 30 mL saline for 2-h infusion), and [1- 13 C]lysine (1.28 mmol in 30 mL saline for prime and 9.00 mmol in 60 mL saline for 6-h infusion). The bolus dose of 3-[methyl- 2 H 3 ]histidine (3MH) was calculated based on 20% pool size of 3MH in sows [ 16 , 17 ]. The infusion rate of [1- 13 C]lysine was calculated based on average flux of lysine (25 mmol/h) in lactating sows [ 7 ] with the aim of 2% enrichment. The priming dose of [1- 13 C]lysine was aiming for 1.5 mmol (1 h of infusion), and 1.28 mmol was the actual amount according to weight balance.
The solution of [ 13 C]bicarbonate was freshly prepared to minimize loss of 13 CO 2 . Specifically, [ 13 C]bicarbonate was weighed and dissolved in 20-mL 3-[methyl- 2 H 3 ]histidine solution in the morning of infusion day (Fig. 2 ). The 3-[methyl- 2 H 3 ]histidine (3MH) was used to estimate muscle protein breakdown, and the [ 13 C]bicarbonate was used to prime the CO 2 pool to accelerate the estimation of lysine oxidation rate. The primed-constant infusion of [1- 13 C]lysine was used to estimate lysine utilization by the mammary gland and the lysine flux in the whole body.

Timeline of isotope infusion and sampling (infusion day was within d 18–21)
Infusion protocol
The timeline for infusion is presented in Fig. 2 . Actual infusion day varied between d 14 and 18 due to real time patency of catheter. For lysine balance (Table 3 ) and body protein kinetics (Table 6 ), the actual infusion days were 17.0 ± 1.0 for CON and 17.0 ± 1.4 for OPT. For 3MH kinetics, the actual infusion days were 17.3 ± 1.0 for CON and 16.8 ± 1.5 for OPT. Pumps (Genie Touch TM , Kent Scientific Corp, Torrington, CT, USA) and syringes were placed on a large and stable plastic board laid above the farrowing stall. Following the priming dose, the infusion line was immediately attached to the syringe mounted to the pump to begin the constant infusion. The sampling line was coiled and stored in the pouch until used for blood sampling.
The mixed 20 mL saline solution containing 3-[methyl- 2 H 3 ]histidine (183 μmol) and [ 13 C]bicarbonate (368 μmol) was given through the infusion line as a bolus injection. The [ 13 C]bicarbonate in this infusate was used as a priming dose. After bolus injection, a constant 2-h infusion of [ 13 C]bicarbonate (368 μmol/h) began. The 2-h [ 13 C]bicarbonate infusion was followed by a 6-h primed constant [1- 13 C]lysine infusion (1.50 mmol/h) (Fig. 2 ).
Blood sampling
The timeline for blood sampling is presented in Fig. 2 . For analysis of plasma 3-[methyl- 2 H 3 ]histidine concentrations and estimation of muscle protein breakdown rate, blood samples were collected through the sampling line at 0 (immediately after termination of the bolus infusion), 5, 10, 15, 30 and 45 min and 1, 2, 3, 4, 5, 6, 7, 8, 24, 34, 48, 58 and 72 h post bolus infusion. Blood samples (0.5 mL) were transferred into 500-μL BD microtainer tubes (K 2 EDTA) and centrifuged (1,500 × g at 4 °C for 5 min). The plasma was extracted and stored in 1.5-mL microcentrifuge tubes at −20 °C until analysis.
For analysis of plasma [1- 13 C]lysine concentrations and estimation of whole-body Lys flux, blood samples (0.5 mL) were collected prior to infusion for background enrichment and at 1, 2, 3, 4, 5 and 6 h from the start of [1- 13 C]lysine infusion (Fig. 2 ).
For analysis of blood CO 2 concentrations, blood samples (2 mL) were collected prior to [ 13 C]bicarbonate-prime infusion for background, and at 1, 2, 3, 4, 5, 6, 7 and 8 h following the prime infusion. Blood samples were injected into evacuated vacutainer tubes (Becton Dickinson, Plymouth, UK) previously prepared with 2 mL of phosphoric acid, immediately mixed, and cooled to room temperature. The CO 2 was then transferred from evacuated vacutainers to Exetainer tubes (Labco Breath Tube, UK) by using pure nitrogen gas as medium until analysis.
Milk sampling protocol
The timeline for milk sampling is presented in Fig. 2 . Milk samples were taken between d 14 and 18 during the infusion protocol. Milk was sampled before infusion for background enrichment, and at 1, 2, 3, 4, 5 and 6 h of primed constant infusion of Lys.
For each milk sampling period, piglets were separated from the sows for 1 h in an empty adjacent farrowing crate with no access to water, and sows were administered 1 mL of oxytocin (20 IU/mL oxytocin, sodium chloride 0.9% w/v, and chlorobutanol 0.5% w/v, VetTek, Blue Springs, MO, USA) through the sampling catheter immediately after blood sampling. The catheter was rinsed with 2 mL of saline solution to ensure oxytocin reached the blood circulation. A total of 30-mL milk was manually collected across all glands and stored in 2 separate 15-mL tubes (polypropylene centrifuge tubes with screw cap, Denville Scientific, Swedesboro, NJ, USA). Piglets were immediately returned to sows to complete nursing and empty the mammary glands. Piglets were removed after nursing and kept separate from the sow until the next milk sampling time, 1 h later.
Isotope analysis
Plasma and milk [1- 13 C]lysine and 3-[methyl- 2 H 3 ]histidine (after acid hydrolysis) were determined as their dansyl derivatives by HESI LC-MS as previously described [ 18 ]. The following m/z transitions were monitored: 613→379 and 614→380 for [1- 13 C]lysine and 403→124 and 406→127 for 3-[methyl- 2 H 3 ]histidine. Determination of blood 13 CO 2 enrichment was performed by IRMS (Delta+XL IRMS coupled with GasBench-II peripheral device, Thermo-Quest Finnigan, Bremen, Germany) as previously described [ 19 ].
Nutrient analysis
Feed samples were analyzed for gross energy (GE) by bomb calorimetry (Parr Instrument Inc., Moline, IL, USA). Dry matter and N in feed samples were analyzed as previously described [ 5 ]. Dietary AA analysis [AOAC Official Method 982.30 E (a,b,c), 45.3.05, 2006] was performed by the Agricultural Experiment Station Chemical Laboratories (University of Missouri-Columbia, Columbia, MO, USA) as outlined in previous reports [ 5 ].
Calculations
The following assumptions were made during calculation:
Priming dose of isotope was assumed to mix with pool instantly.
The appearance of unlabeled bicarbonate was constant during the time of primed-constant infusion of bicarbonate (2 h) and that of [1- 13 C]lysine (6 h).
[1- 13 C]lysine cannot be synthesized once 1-carbon was lost to CO 2 , thus rate of lysine decarboxylation represented rate of lysine breakdown.
Kinetics of plasma lysine was an indicator of kinetics of whole body protein.
The indicator AA (lysine) was assumed to be oxidised for maintenance or incorporated into milk protein without other metabolic pathway.
Lysine oxidation
The enrichment of CO 2 during the period of primed-constant infusion of [ 13 C]bicarbonate was calculated as follows (Eq. 1 ):
Where “infusion \({\text{rate}}_{\text{H}{}^{13}\text{CO}_3^-}\) ” represents the infusion rate (368 μmol/h) of [ 13 C]bicarbonate, and “ \(\text{Ra}_{\text{HCO}_{3}^-}\) ” represents the rate of appearance of unlabeled bicarbonate (baseline) in the body.
The enrichment of CO 2 during the period of primed-constant infusion of [1- 13 C]lysine was calculated as follows (Eq. 2 ):
Where “ \({\text{Ra}}_{\text{H}{}^{13}\text{CO}_3^-}\) ” represents the rate of appearance of labeled bicarbonate from [1- 13 C]lysine oxidation, and “ \(\text{Ra}_{\text{HCO}_{3}^-}\) ” represents the rate of appearance of unlabeled bicarbonate (baseline) in the body as in Eq. 1 .
The enrichment of lysine during the period of primed-constant infusion of [1- 13 C]lysine was calculated as follows (Eq. 3 ):
Where Ra Lys represents the rate of appearance of unlabeled lysine in the body.
Lysine oxidation was estimated as follows (Eq. 4 ):
Whole body protein breakdown and synthesis
Whole body protein breakdown (PB) and synthesis (PS) were mirrored by Lys dynamics (Table 3 and Fig. 3 ).

Isotopic enrichment of [1- 13 C]lysine in plasma (panel a ) and milk (panel b ) over 6 h during peak lactation (d 14 to 18) for sows fed control (CON; 18.4% CP; n = 3) and optimal (OPT; 14.0% CP; n = 5) diets
The PB and PS were calculated as follows (Eqs. 5 and 6 ):
Where 146.19 g/mol is the molar weight of isotopic Lys, 6.74% is the average weight percentage of Lys in the sow’s body protein [ 6 ].
The average milk protein concentration of 5.16% was used [ 6 ]. Milk yield was estimated according to Theil et al. [ 15 ].
Muscle protein breakdown
Data was expressed as tracer to tracee ratio (TTR). Multiexponential models were fitted to the data (Eq. 10 and Fig. 1 ). Residual inspection and pseudo-R 2 were used to determine the most parsimonious model that best fitted the data from each individual sow. Area under the curve (AUC; TTR•h) was calculated using the parameters from the multiexponential equation (Eq. 11 and Table 4 ) and 3MH rate of appearance (Ra; μmol/kg/h) was calculated by dividing the dose administered (μmol/kg) by AUC (Eq. 12 and Table 4 ). Half-life (h) was determined using the rate constant corresponding to the tail of the curve (Eq. 13 , Table 4 , and Fig. 1 ).
Muscle protein breakdown rate (%/d) was calculated as follows (Eq. 14 ):
Where total protein bound 3MH pool = muscle protein mass (g) × 3.8742 μmol 3MH/g protein and muscle protein mass = 8.21% × sow BW (kg) [ 20 ].
Muscle protein breakdown (g/d), was calculated as follows (Eq. 15 ):
Efficiency of lysine for lactation
Lysine utilization efficiency for lactation was calculated as follows (Eq. 16 ):
Statistical analysis
Data were confirmed for homogeneity of residual variance and normality of residuals by Mixed Procedures and Univariate Procedures of SAS 9.4 (SAS Inst. Inc., Cary, NC, USA) before ANOVA analysis (Mixed model procedures).
For the lysine balance and protein kinetic estimation, two sows from CON were removed from the data set. In one case, both ear vein catheters lost patency at the time of infusion, and in the other case, one of the 2 ear vein catheters lost patency. The latter sow, however, was used for the estimation of muscle protein breakdown, which only required one catheter. Therefore, the number of sows for the lysine balance data and protein kinetic estimation were 5 and 3 for OPT and CON, respectively.
For the analysis of lysine enrichment in plasma and milk, the following model was used:
The Enrichment of lysine depended on the fixed effects of diet ( OPT vs. CON ) , and sampling hour, with hour included as repeated measurement. The random effects included block and individual sow . The interactive effect of diet × hour was also included .
For the analysis of lysine balance, body protein breakdown and synthesis, and muscle protein breakdown rate, identified as “Response”, the following model was used:
The Response depended on the fixed effects of diet ( OPT vs. CON ) . The random effects included block and individual sow .
Differences between treatments were declared at P < 0.05 and tendencies at P ≤ 0.1.
Lactation performance
Lactation performance during the 21-d period and milk yield and nutrient concentrations between d 14 and 18 are presented in Table 5 . Sow initial BW and ADFI did not differ between OPT and CON diets. Litter growth rate of sows fed OPT diet was greater than those fed CON diet ( P < 0.05).
Lysine balance and efficiency of utilization
Lysine balance values are presented in Table 3 . The SID Lys intake, Lys oxidation, flux and Lys associated with protein synthesis did not differ between OPT and CON diets (Table 3 ). Compared to sows fed CON, those fed OPT had greater efficiency of Lys (0.62 vs. 0.50; P < 0.05) and tended to have a lower ( P = 0.069) released Lys associated with protein breakdown.
Whole body protein synthesis, whole body protein breakdown and fractional muscle protein breakdown
Whole body protein breakdown rate and synthesis rate tended to be lower ( P = 0.069 and P = 0.109, respectively) and protein turnover efficiency (synthesis: breakdown) tended to be greater ( P = 0.060) in sows fed OPT compared to those fed CON (Table 6 ). Whole body protein net synthesis (i.e., whole body protein synthesis − whole body protein breakdown) did not differ between OPT and CON diets.
For estimation of muscle protein breakdown rate, an additional sow in OPT treatment lost patency of both catheters, therefore the number of sows was 4 in each of the treatment. A 3-exponential model best fitted the 3MH decaying curve (Fig. 1 ) and pseudo- R 2 were > 0.995. Muscle protein breakdown rate and fractional muscle protein breakdown rate (%) did not differ ( P = 0.197) between sows fed OPT and CON diets (4.84% and 5.59%, respectively) (Table 6 ).
Enrichment of lysine
Lysine enrichment in plasma (panel a) and milk (panel b) is presented in Fig. 3 . The lysine enrichment in plasma did not differ between diets and time. Lysine enrichment in milk was lower ( P < 0.01) in sows fed OPT compared to sows fed CON diets and differed over time ( P < 0.01). There was no interaction between diets and time.
fDynamics of 3-[methyl- 2 H 3 ]histidine
Plasma isotopic enrichment of 3-MH following 3-MH bolus infusion is presented in Fig. 1 , and relevant dynamic parameters are presented in Table 4 . Plasma isotopic enrichment of 3-MH of sows fed CON was lower ( P < 0.001) than that for OPT diet. Time effects of 3-MH were significant ( P < 0.001) in both treatments of CON and OPT, and no interaction effect between diet and time ( P = 0.894) was detected.
Previous studies showed that lactating sows fed low CP diets with CAA supplementation had greater milk casein yield [ 2 , 3 ], and utilization efficiency of N and EAA [ 4 , 5 ]. The improvement of milk yield however was at the expense of sow BW and maternal N retention [ 3 , 5 ]. Zhang et al. [ 8 ] suggested that feeding diets with improved AA balance triggered nutrient repartitioning to milk at the expense of maternal adipose tissue rather than protein tissue. Maternal body fat loss affects subsequent reproductive performance and compromises the overall production efficiency during the sow’s life span [ 21 ]. Therefore, commercial implementation of diets with aggressing reduction in CP with CAA supplementation to achieve improved AA balance will not only depend on their impact on lactation performance and production efficiency but also on ensuring that long-term maternal body protein and lipid reserves are not compromised.
The mechanisms behind the reduced maternal N retention in sows fed improved AA balance diets reported in earlier studies [ 4 , 5 ] are unclear. Reduced maternal body protein synthesis, greater body protein breakdown, or a combination of thereof can dictate maternal N balance during lactation. In this study however, BW and backfat change during lactation did not differ between OPT and CON sows. Of note, sows fed OPT had no change in BW with a small loss in backfat while sows fed CON gained 5.5 kg with no change in backfat. Body protein kinetics in this study (Table 6 ) dictated that whole body protein net synthesis (whole body protein synthesis − whole body protein breakdown) of sows fed CON and OPT were close (1,041.72 vs. 1,022.90 g/d), but note that whole body protein net synthesis of lactating sows included milk protein yield and maternal protein deposition. Milk protein yield was greater in OPT than CON as mirrored by litter growth rate (Table 5 ). Consequently, maternal protein deposition was greater in CON than OPT which aligns with the observation that body weight increased in sows fed CON while there was no change of body weight in sows fed OPT (Table 5 ). In addition, increased milk production in sows fed OPT suggest that OPT diet led sows to partition more dietary nutrient towards milk than maternal reserves, in other words, sows fed OPT were more motivated to produce milk even at the expense of maternal deposition.
This study used Lys as representative AA of body protein to analyze whole body protein turnover. In essence, Lys flux in the blood was contributed by dietary Lys intake and Lys released by body protein breakdown, and free Lys in the blood could be directed to either Lys oxidation or Lys incorporation into body protein (Fig. 4 ). Thus, body protein breakdown and synthesis could be estimated by measuring Lys flux in blood and Lys oxidation. The carbon dioxide released by Lys oxidation remains in the blood bicarbonate pool and mixed with carbon dioxide from other substrate oxidation (Fig. 5 ). By priming the bicarbonate pool, the baseline production rate of carbon dioxide can be estimated based on bicarbonate enrichment and constant infusion rate of labeled bicarbonate during prime-constant infusion of bicarbonate (Eq. 1 ). The release of labeled carbon dioxide due to labeled Lys oxidation was proportional to the baseline production rate of carbon dioxide according to enrichment of bicarbonate during prime-constant infusion of Lys (Eqs. 2 and 3 ).

Diagram of lysine balance in lactating sows at fed state

Representation of a two-pool model to estimate lysine oxidation
Milk protein synthesis represents the difference between whole body protein synthesis and breakdown, assuming that maternal protein retention is close to zero, since maternal tissue mobilization is majorly comprised of body fat rather than body protein [ 5 , 8 ]. According to this assumption, milk protein output rate measured by isotopic technique (Eq. 8 ) was 1,023 to 1,042 g/d, which aligns well with a previous study where 957 g/d milk protein synthesis was reported using a N balance approach [ 5 ]. When compared to traditional method where milk protein synthesis is the product of milk yield and milk protein concentration (645 to 675 g/d; Eq. 9 ), the isotopic-predicted milk protein synthesis (1,023 to 1,042 g/d) appears overestimated. Guan et al. [ 7 ] reported milk protein synthesis of 575 g/d as the net balance between sow whole mammary protein synthesis (975 g/d) and breakdown rate (400 g/d), corroborating the values reported here (645–675 g/d) using the traditional method. Nitrogen balance techniques tend to overestimate actual nitrogen retention [ 22 , 23 ], as observed herein with the isotope technique (Eq. 8 ). Note that the estimated muscle protein breakdown rate according to 3MH method in this study was 960 to 1,261 g/d (Eq. 15 ), which was greater than the protein breakdown rate (650 to 1,051 g/d; Eq. 8 ) based on the Lys flux. On the other hand, milk protein synthesis rate per metabolic BW (BW 0.75 ) were 10.25 and 9.85 g/d/kg 0.75 for OPT and CON, respectively in this study, supporting a previously reported value of 11.57 g/d/kg 0.75 (using Val as representative AA) [ 24 ]. Thus, overestimation of milk protein synthesis (Eq. 8 ) was majorly attributed to an underestimation of protein breakdown rather than overestimation of protein synthesis. The underestimation of body protein breakdown according to Lys flux (Eq. 5 ) may be partially due to the tendency to overestimate feed intake [ 23 ], although feed waste was minimized in this study. Nevertheless, it is also important to note that estimated muscle protein breakdown (15.4 to 17.8 μmol/kg/d; Eq. 15 ; Table 6 ) and fractional breakdown (4.84–5.59%/d; Eq. 14 ; Table 6 ) in this study was greater than those reported for lactating gilt (3.4%/d, 12.0 μmol/kg/d) using the same 3MH method [ 17 ]. It is speculated that the multiparous lactating sow may mobilize body protein more readily compared to the lactating gilt.
In this study, milk protein yield of lactating sows fed OPT diet did not differ from those fed control diet neither when an isotopic method nor the traditional method were used. Although there was no difference between whole body protein synthesis and breakdown, the absolute values of protein synthesis and breakdown were both lower in sows fed OPT diet compared to CON diet, suggesting less whole-body protein turnover in sows fed the OPT diet. In support of this view, previous studies also showed a decreased protein breakdown rate reflected by lower urea nitrogen output when sows were fed reduced protein diets [ 3 , 5 ]. The biological process of protein turnover is energetically costly [ 1 , 25 ]. Zhang et al. [ 5 ] reported feeding sows with an improved AA balance diet was associated with higher energy efficiency, lending support to the current observation.
The Lys efficiency for sows fed different levels of dietary protein based on the NRC [ 6 ] approach was previously determined [ 4 , 5 ], with greater efficiency values (0.68 and 0.66, respectively) found during peak lactation (d 14–18) in sows fed low CP diets balanced with CAA. Herein, greater Lys utilization efficiency values, determined using a different approach, were also found in sows fed OPT (0.62) compared to CON (0.50). The estimation of Lys utilization efficiency was based on Lys balance parameters, i.e., Lys flux in blood, SID Lys intake and Lys oxidation (Fig. 4 ), and the assumption that net protein synthesis (protein synthesis − protein breakdown) represents milk protein synthesis, with negligible maternal body retention. The true Lys utilization efficiency is the ratio between “Lys in milk” and “Lys for milk”, thus Lys utilized for maintenance should be excluded in the denominator [ 6 ] as follows:
In this study, the whole-body Lys flux was corrected by excluding Lys oxidation (Eq. 16 ), which corresponds to the Lys requirement for maintenance. Guan et al. [ 7 ] reported that Lys flux partitioned to the mammary glands as percentage of whole-body Lys flux was 56% in sows fed a conventional diet, which is comparable to the Lys efficiency values of 50% to 62% observed in this study.
Feeding lactation sows with an improved AA balance diet did not affect milk protein yield and reduced whole-body protein turnover. The reduced whole-body protein turnover resulted from a decrease in both whole-body protein synthesis and breakdown rate, with a tendency for greater protein synthesis to protein breakdown ratio (2.65 vs. 2.02).
Efficiency of Lys was also greater during peak lactation, together suggesting higher efficiency of energy use. These results imply that the lower maternal N retention observed in lactating sows fed improved AA balance diets in previous studies may be a result of greater partitioning of AA towards milk rather than greater body protein breakdown.
Availability of data and materials
All data generated or analyzed during this study are available from the corresponding author on request.
Abbreviations
Average daily gain
Area under the curve
Body weight
Crystalline amino acid
Crude protein
Essential amino acid
Standard error of the mean
Standardized ileal digestibility
3-[methyl- 2 H 3 ]histidine
Zhang S, Trottier NL. Dietary protein reduction improves the energetic and amino acid efficiency in lactating sows. Anim Prod Sci. 2019;59:1980–90.
Article CAS Google Scholar
Chamberlin DP. Impacts of reducing dietary crude protein with crystalline amino acid supplementation on lactating sow performance, nitrogen utilization and heat production. East Lansing: MS Thesis, Michigan State University; 2017.
Google Scholar
Huber L, de Lange CFM, Krogh U, Chamberlin D, Trottier NL. Impact of feeding reduced crude protein diets to lactating sows on nitrogen utilization. J Anim Sci. 2015;93:5254–64.
Article CAS PubMed Google Scholar
Huber L, de Lange CFM, Ernst CW, Krogh U, Trottier NL. Impact of improving dietary amino acid balance for lactating sows on efficiency of dietary amino acid utilization and transcript abundance of genes encoding lysine transporters in mammary tissue. J Anim Sci. 2016;94:4654–65.
Zhang S, Qiao M, Trottier NL. Feeding a reduced protein diet with a near ideal amino acid profile improves amino acid efficiency and nitrogen utilization for milk production in sows. J Anim Sci. 2019;97:3882–97.
Article PubMed PubMed Central Google Scholar
NRC. Nutrient requirements of swine. 11th ed. Washington, DC: National Academy Press; 2012.
Guan X, Bequette BJ, Calder G, Ku PK, Ames KN, Trottier NL. Amino acid availability affects amino acid flux and protein metabolism in the porcine mammary gland. J Nutr. 2002;132:1224–34.
Zhang S, Johnson JS, Qiao M, Trottier NL. Reduced protein diet with near ideal amino acid profile improves energy efficiency and mitigate heat production associated with lactation in sows. J Anim Sci Biotechno. 2020;11:4.
Article Google Scholar
Quesnel H. Nutritional and lactational effects on follicular development in the pig. In: Rodriguez Martinez H, Vallet JL, Ziecik AJ, editors. Control of pig reproduction VIII. Nottingham: Notthingham University Press; 2009. p. 121–34.
Wientjes JGM, Soede NM, van den Brand H, Kemp B. Nutritionally induced relationships between insulin levels during the weaning-to-ovulation interval and reproductive characteristics in multiparous sows: I. Luteinizing hormone, follicle development, oestrus and ovulation. Reprod Domest Anim. 2012;47:53–61.
Wientjes JGM, Soede NM, van den Brand H, Kemp B. Nutritionally induced relationships between insulin levels during the weaning-to-ovulation interval and reproductive characteristics in multiparous sows: II. Luteal development, progesterone and conceptus development and uniformity. Reprod Domest Anim. 2012;47:62–8.
Wientjes JGM, Soede NM, Knol EF, van den Brand H, Kemp B. Piglet birth weight and litter uniformity: effects of weaning-to-pregnancy interval and body condition changes in sows of different parities and crossbred lines. J Anim Sci. 2013;91(5):2099–107.
Kim IY, Schutzler S, Schrader A, Spencer H, Kortebein P, Deutz NEP, et al. Quantity of dietary protein intake, but not pattern of intake, affects net protein balance primarily through differences in protein synthesis in older adults. Am J Physiol-Endoc M. 2015;308(1):E21.
CAS Google Scholar
Claydon AJ, Thom MD, Hurst JL, Beynon RJ. Protein turnover: measurement of proteome dynamics by whole animal metabolic labelling with stable isotope labelled amino acids. Proteomics. 2012;12(8):1194–206.
Theil PK, Nielsen TT, Kristensen NB, Labouriau R, Danielsen V, Lauridsen C, et al. Estimation of milk production in lactating sows by determination of deuterated water turnover in three piglets per litter. Acta Agric Scand. 2002;52:221–32.
Rathmacher JA, Link GA, Nissen SL. Measuring of 3-methylhistidine production in lambs by using compartmental-kinetic analysis. Br J Nutr. 1993;69:1.
Trottier NL. Protein metabolism in the lactating sow. Urbana-Champaign: PhD Dissertation, University of Illinois; 1995.
Marini JC. Quantitative analysis of 15 N-labeled positional isomers of glutamine and citrulline via electrospray ionization tandem mass spectrometry of their dansyl derivatives. Rapid Commun Mass Spectrom. 2011;25(9):1291–6.
Verbruggen S, Sy J, Gordon WE, Hsu J, Wu M, Chacko S, et al. Ontogeny of methionine utilization and splanchnic uptake in critically ill children. Am J Physiol Endocrinol Metab. 2009;297(5):E1046–55.
Article CAS PubMed PubMed Central Google Scholar
Rathmacher JA, Nissen SL, Paxton RE, Anderson DB. Estimation of 3-methylhistidine production in pigs by compartmental analysis. J Anim Sci. 1996;74(1):46–56.
De Rensis F, Gherpelli M, Superchi P, Kirkwood RN. Relationships between backfat depth and plasma leptin during lactation and sow reproductive performance after weaning. Anim Reprod Sci. 2005;90(1–2):95–100.
Article PubMed Google Scholar
Kopple JD. Uses and limitations of the balance technique. JPEN J Parenter Enteral Nutr. 1987;11(5 Suppl):79S–85S.
CAS PubMed Google Scholar
Spanghero M, Kowalski ZM. Updating analysis of nitrogen balance experiments in dairy cows. J Dairy Sci. 2021;104(7):7725–37.
Hanigan MD, France J, Mabjeesh SJ, McNabb WC, Bequette BJ. High rates of mammary tissue protein turnover in lactating goats are energetically costly. J Nutr. 2009;139(6):1118–27.
Wolfe RR. Radioactive and stable isotope tracers in biomedicine: principles and practice of kinetic analysis. Somerset, NJ: John Wiley & Sons Inc; 1992.
Download references
This work was financially supported by funds from the USDA-NIFA (award number 2014-67015-21832).
Author information
Authors and affiliations.
Department of Animal Science, Michigan State University, East Lansing, 48824, USA
Sai Zhang, Julie Moore & Nathalie L. Trottier
State Key Laboratory of Swine and Poultry Breeding Industry, Key Laboratory of Animal Nutrition and Feed Science in South China, Ministry of Agriculture and Rural Affairs, Guangdong Provincial Key Laboratory of Animal Breeding and Nutrition, Institute of Animal Science, Guangdong Academy of Agricultural Sciences, Guangzhou, 510640, PR China
USDA/ARS Children’s Nutrition Research Center and Pediatric Critical Care Medicine, Department of Pediatrics, Baylor College of Medicine, Houston, TX, 77030, USA
Juan C. Marini & Mahmoud A. Mohammad
Department of Large Animal Clinical Sciences, Michigan State University, East Lansing, MI, 48824, USA
Vengai Mavangira & Andrew Claude
Present address: Department of Animal Science, Cornell University, Frank Morrison Hall, 507 Tower Road, Ithaca, NY, 14853-4801, USA
Nathalie L. Trottier
You can also search for this author in PubMed Google Scholar
Contributions
Conceptualization, NLT and SZ; Methodology, NLT, SZ, JCM, VM, AC, JM, and MAM; Formal analysis, SZ and JCM; Writing, SZ and NLT; Supervision, NLT; Funding acquisition, NLT.
Corresponding author
Correspondence to Nathalie L. Trottier .
Ethics declarations
Ethics approval and consent to participate.
All procedures were approved by the Michigan State University Institutional Animal Care and Use Committee (AUF # 05/16-091-00) and followed the American Association for Laboratory Animal Science guidelines.
Consent for publication
Not applicable.
Competing interests
The authors declare that they have no competing interests.
Rights and permissions
Open Access This article is licensed under a Creative Commons Attribution 4.0 International License, which permits use, sharing, adaptation, distribution and reproduction in any medium or format, as long as you give appropriate credit to the original author(s) and the source, provide a link to the Creative Commons licence, and indicate if changes were made. The images or other third party material in this article are included in the article's Creative Commons licence, unless indicated otherwise in a credit line to the material. If material is not included in the article's Creative Commons licence and your intended use is not permitted by statutory regulation or exceeds the permitted use, you will need to obtain permission directly from the copyright holder. To view a copy of this licence, visit http://creativecommons.org/licenses/by/4.0/ . The Creative Commons Public Domain Dedication waiver ( http://creativecommons.org/publicdomain/zero/1.0/ ) applies to the data made available in this article, unless otherwise stated in a credit line to the data.
Reprints and permissions
About this article
Cite this article.
Zhang, S., Marini, J.C., Mavangira, V. et al. Effects of improved amino acid balance diet on lysine mammary utilization, whole body protein turnover and muscle protein breakdown on lactating sows. J Animal Sci Biotechnol 15 , 65 (2024). https://doi.org/10.1186/s40104-024-01020-9
Download citation
Received : 07 December 2023
Accepted : 05 March 2024
Published : 07 May 2024
DOI : https://doi.org/10.1186/s40104-024-01020-9
Share this article
Anyone you share the following link with will be able to read this content:
Sorry, a shareable link is not currently available for this article.
Provided by the Springer Nature SharedIt content-sharing initiative
- Lactating sows
- Protein breakdown
- Protein turnover
- Reduced protein diet
Journal of Animal Science and Biotechnology
ISSN: 2049-1891
- Submission enquiries: Access here and click Contact Us
- General enquiries: [email protected]
IMAGES
VIDEO
COMMENTS
Key Points. DNA is used to make a copy of mRNA (Transcription) mRNA leaves the nucleus and goes to ribosomes. 3 bases = codon. 1 codon = a single amino acid. A chain of amino acids = a protein. Protein synthesis is also called Translation. Biologists use a codon chart or a codon wheel to determine the amino acids.
Protein synthesis is a complex, highly tuned process that enables life to flourish. Understanding it, from the DNA to the RNA to the amino acids, gives us a better appreciation for life itself. Use our protein synthesis worksheet practice questions to help you learn the ins and outs of protein synthesis and remember the informaion.
Protein Practice HS-LS1-1 Protein Synthesis Practice I can statements for the HS-LS1-1 Unit: I can model the structure of DNA and describe the importance of it within our cells. I can construct an explanation of how genes code for proteins. (____ points) 1. Here is one half of a DNA strand. Complete the other half by writing the complementary
PROTEIN SYNTHESIS WORKSHEET. PART A. Read the following: Protein synthesis is the process used by the body to make proteins. The first step of protein synthesis is called Transcription. It occurs in the nucleus. During transcription, mRNA transcribes (copies) DNA. DNA is "unzipped" and the mRNA strand copies a strand of DNA. Once it does ...
A bunch of amino acids attached together is called? polypeptide. Use your Codon chart to determine the amino acid sequence. 1. DNA>>> CCT CTT TAC ACA CGG AGG GTA CGC TAT TCT ATG ATT ACA CGG TTG CGA TCC ATA ATC. mRNA>>>. protein>>>. 2. DNA>>> AGA ACA TAA TAC CTC TTA ACA CTC TAA AGA CCA GCA CTC CGA TGA ACT GGA GCA.
Having studied the process by which DNA directs the synthesis of proteins, you should be ready to decode some DNA "secret" messages. To do this, you must follow the procedure of protein synthesis as this is taking place right now in your cells; no short cuts! Practice these steps by following and finishing the partially solved message below.
Lesson 2: RNA and protein synthesis. Molecular structure of RNA. DNA replication and RNA transcription and translation. Intro to gene expression (central dogma) The genetic code. Impact of mutations on translation into amino acids. RNA and protein synthesis review. Transcription and translation. Codons and mutations.
PROTEIN SYNTHESIS WORKSHEET. Protein synthesis is the process used by the body to make proteins. The first step of protein synthesis is called Transcription. It occurs in the nucleus. During transcription, mRNA transcribes (copies) DNA. DNA is "unzipped" and the mRNA strand copies a strand of DNA. Once it does this, mRNA leaves the nucleus ...
A. Transcription. Protein synthesis begins with DNA in the nucleus. Transcription takes place in the nucleus of the cell. During transcription messenger RNA (mRNA) reads and copies DNA's nucleotide sequence in the form of a complimentary RNA strand. Then the mRNA carries the DNA's information in the form of codons to the ribosome.
Level: 9-12. Language: English (en) ID: 1936327. 14/03/2022. Country code: US. Country: United States. School subject: Biology (1061845) Main content: Protein synthesis (2049684) A simple practice of the processes of transcription and translation within protein synthesis.
Created Date: 1/15/2014 2:47:20 PM
25/02/2022. Country code: US. Country: United States. School subject: Biology (1061845) Main content: Protein Synthesis (1998127) From worksheet author: Use this as a tool to test your knowledge of how proteins are made from a strand of DNA. You'll need a codon chart to help you determine the amino acids.
The purpose of this activity is to provide practice so that students can: 1. Know that in all organisms, DNA provides the instructions for specific characteristics. (HS10-LS1-1.1) 2. Describe the structure of DNA. ... Unit 9: DNA & Protein Synthesis Protein Synthesis Worksheet
A sequence of three nucleotides which together from a unit of genetic code in a DNA or RNA molecule. How many codons equal 1 amino acid? 3. How many nucleotides equals 1 amino acid? 3. What is an anti-codon? Where are they located? An anti-codon is a set of 3 nucleotides that is complimentary to an mRNA codon and they are located in tRNA.
Quiz & Worksheet Goals. We'll focus essentially on: The organic compound used to make protein. Which RNA carries the amino acids to the ribosome. Where the proteins come from. Protein that defends ...
Protein Synthesis and Codons Practice. Protein synthesis is the process where a sequence of DNA is used to build a protein from individual amino acids. The first step in this process is called TRANSCRIPTION , where a coding region of DNA is converted to messenger RNA (mRNA).
About This Quiz & Worksheet. The quiz will mainly test you on definitions of terms related to protein synthesis in the cell. The questions will each give you a definition. You will then need to ...
Protein synthesis is the process used by the body to make proteins. The first step of protein synthesis is called Transcription. It occurs in the nucleus. During transcription, mRNA transcribes (copies) DNA. DNA is "unzipped" and the mRNA strand copies a strand of DNA. Once it does this, mRNA leaves the nucleus and goes into the cytoplasm.
Proteins play a role in all cell processes. This quiz/worksheet will help you assess your comprehension of the functions of proteins and how proteins are synthesized in the body. Multiple-choice ...
22/03/2022. Country code: US. Country: United States. School subject: Biology (1061845) Main content: Protein synthesis (2049684) More practice with protein synthesis processes of transcription and translation, including reading a codon chart. Other contents: Translation, transcription.
Protein synthesis is the process where a sequence of DNA is used to build a protein from individual amino acids. The first step in this process is called TRANSCRIPTION, where a coding region of DNA is converted to messenger RNA (mRNA).During transcription, mRNA is made from the DNA sequence following the base pair rule, except RNA does not contain the base T hymine, but instead has U racil.
The study objective was to test the hypothesis that low crude protein (CP) diet with crystalline amino acids (CAA) supplementation improves Lys utilization efficiency for milk production and reduces protein turnover and muscle protein breakdown. Eighteen lactating multiparous Yorkshire sows were allotted to 1 of 2 isocaloric diets (10.80 MJ/kg net energy): control (CON; 19.24% CP) and reduced ...