Statistical Research Questions: Five Examples for Quantitative Analysis
Table of contents, introduction.
How are statistical research questions for quantitative analysis written? This article provides five examples of statistical research questions that will allow statistical analysis to take place.
In quantitative research projects, writing statistical research questions requires a good understanding and the ability to discern the type of data that you will analyze. This knowledge is elemental in framing research questions that shall guide you in identifying the appropriate statistical test to use in your research.
Thus, before writing your statistical research questions and reading the examples in this article, read first the article that enumerates the four types of measurement scales . Knowing the four types of measurement scales will enable you to appreciate the formulation or structuring of research questions.
Once you feel confident that you can correctly identify the nature of your data, the following examples of statistical research questions will strengthen your understanding. Asking these questions can help you unravel unexpected outcomes or discoveries particularly while doing exploratory data analysis .

Five Examples of Statistical Research Questions
In writing the statistical research questions, I provide a topic that shows the variables of the study, the study description, and a link to the original scientific article to give you a glimpse of the real-world examples.
Topic 1: Physical Fitness and Academic Achievement
A study was conducted to determine the relationship between physical fitness and academic achievement. The subjects of the study include school children in urban schools.
Statistical Research Question No. 1
Is there a significant relationship between physical fitness and academic achievement?
Notice that this study correlated two variables, namely 1) physical fitness, and 2) academic achievement.
To allow statistical analysis to take place, there is a need to define what is physical fitness, as well as academic achievement. The researchers measured physical fitness in terms of the number of physical fitness tests that the students passed during their physical education class. It’s simply counting the ‘number of PE tests passed.’
On the other hand, the researchers measured academic achievement in terms of a passing score in Mathematics and English. The variable is the number of passing scores in both Mathematics and English.
Both variables are ratio variables.
Given the statistical research question, the appropriate statistical test can be applied to determine the relationship. A Pearson correlation coefficient test will test the significance and degree of the relationship. But the more sophisticated higher level statistical test can be applied if there is a need to correlate with other variables.
In the particular study mentioned, the researchers used multivariate logistic regression analyses to assess the probability of passing the tests, controlling for students’ weight status, ethnicity, gender, grade, and socioeconomic status. For the novice researcher, this requires further study of multivariate (or many variables) statistical tests. You may study it on your own.
Most of what I discuss in the statistics articles I wrote came from self-study. It’s easier to understand concepts now as there are a lot of resource materials available online. Videos and ebooks from places like Youtube, Veoh, The Internet Archives, among others, provide free educational materials. Online education will be the norm of the future. I describe this situation in my post about Education 4.0 .
The following video sheds light on the frequently used statistical tests and their selection. It is an excellent resource for beginners. Just maintain an open mind to get rid of your dislike for numbers; that is, if you are one of those who have a hard time understanding mathematical concepts. My ebook on statistical tests and their selection provides many examples.
Source: Chomitz et al. (2009)
Topic 2: Climate Conditions and Consumption of Bottled Water
This study attempted to correlate climate conditions with the decision of people in Ecuador to consume bottled water, including the volume consumed. Specifically, the researchers investigated if the increase in average ambient temperature affects the consumption of bottled water.
Statistical Research Question No. 2
Is there a significant relationship between average temperature and amount of bottled water consumed?
In this instance, the variables measured include the average temperature in the areas studied and the volume of water consumed . Temperature is an interval variable, while volume is a ratio variable .
In this example, the variables include the average temperature and volume of bottled water . The first variable (average temperature) is an interval variable, and the latter (volume of water) is a ratio variable.
Now, it’s easy to identify the statistical test to analyze the relationship between the two variables. You may refer to my previous post titled Parametric Statistics: Four Widely Used Parametric Tests and When to Use Them . Using the figure supplied in that article, the appropriate test to use is, again, Pearson’s Correlation Coefficient.
Source: Zapata (2021)
Topic 3: Nursing Home Staff Size and Number of COVID-19 Cases

An investigation sought to determine if the size of nursing home staff and the number of COVID-19 cases are correlated. Specifically, they looked into the number of unique employees working daily, and the outcomes include weekly counts of confirmed COVID-19 cases among residents and staff and weekly COVID-19 deaths among residents.
Statistical Research Question No. 3
Is there a significant relationship between the number of unique employees working in skilled nursing homes and the following:
- number of weekly confirmed COVID-19 cases among residents and staff, and
- number of weekly COVID-19 deaths among residents.
Note that this study on COVID-19 looked into three variables, namely 1) number of unique employees working in skilled nursing homes, 2) number of weekly confirmed cases among residents and staff, and 3) number of weekly COVID-19 deaths among residents.
We call the variable number of unique employees the independent variable , and the other two variables ( number of weekly confirmed cases among residents and staff and number of weekly COVID-19 deaths among residents ) as the dependent variables .
This correlation study determined if the number of staff members in nursing homes influences the number of COVID-19 cases and deaths. It aims to understand if staffing has got to do with the transmission of the deadly coronavirus. Thus, the study’s outcome could inform policy on staffing in nursing homes during the pandemic.
A simple Pearson test may be used to correlate one variable with another variable. But the study used multiple variables. Hence, they produced regression models that show how multiple variables affect the outcome. Some of the variables in the study may be redundant, meaning, those variables may represent the same attribute of a population. Stepwise multiple regression models take care of those redundancies. Using this statistical test requires further study and experience.
Source: McGarry et al. (2021)
Topic 4: Surrounding Greenness, Stress, and Memory
Scientific evidence has shown that surrounding greenness has multiple health-related benefits. Health benefits include better cognitive functioning or better intellectual activity such as thinking, reasoning, or remembering things. These findings, however, are not well understood. A study, therefore, analyzed the relationship between surrounding greenness and memory performance, with stress as a mediating variable.
Statistical Research Question No. 4
Is there a significant relationship between exposure to and use of natural environments, stress, and memory performance?
As this article is behind a paywall and we cannot see the full article, we can content ourselves with the knowledge that three major variables were explored in this study. These are 1) exposure to and use of natural environments, 2) stress, and 3) memory performance.
Referring to the abstract of this study, exposure to and use of natural environments as a variable of the study may be measured in terms of the days spent by the respondent in green surroundings. That will be a ratio variable as we can count it and has an absolute zero point. Stress levels can be measured using standardized instruments like the Perceived Stress Scale . The third variable, i.e., memory performance in terms of short-term, working memory, and overall memory may be measured using a variety of memory assessment tools as described by Murray (2016) .
As you become more familiar and well-versed in identifying the variables you would like to investigate in your study, reading studies like this requires reading the method or methodology section. This section will tell you how the researchers measured the variables of their study. Knowing how those variables are quantified can help you design your research and formulate the appropriate statistical research questions.
Source: Lega et al. (2021)
Topic 5: Income and Happiness
This recent finding is an interesting read and is available online. Just click on the link I provide as the source below. The study sought to determine if income plays a role in people’s happiness across three age groups: young (18-30 years), middle (31-64 years), and old (65 or older). The literature review suggests that income has a positive effect on an individual’s sense of happiness. That’s because more money increases opportunities to fulfill dreams and buy more goods and services.
Reading the abstract, we can readily identify one of the variables used in the study, i.e., money. It’s easy to count that. But for happiness, that is a largely subjective matter. Happiness varies between individuals. So how did the researcher measured happiness? As previously mentioned, we need to see the methodology portion to find out why.
If you click on the link to the full text of the paper on pages 10 and 11, you will read that the researcher measured happiness using a 10-point scale. The scale was categorized into three namely, 1) unhappy, 2) happy, and 3) very happy.
An investigation was conducted to determine if the size of nursing home staff and the number of COVID-19 cases are correlated. Specifically, they looked into the number of unique employees working daily, and the outcomes include weekly counts of confirmed COVID-19 cases among residents and staff and weekly COVID-19 deaths among residents.
Statistical Research Question No. 5
Is there a significant relationship between income and happiness?
Source: Måseide (2021)
Now the statistical test used by the researcher is, honestly, beyond me. I may be able to understand it how to use it but doing so requires further study. Although I have initially did some readings on logit models, ordered logit model and generalized ordered logit model are way beyond my self-study in statistics.
Anyhow, those variables found with asterisk (***, **, and **) on page 24 tell us that there are significant relationships between income and happiness. You just have to look at the probability values and refer to the bottom of the table for the level of significance of those relationships.
I do hope that upon reaching this part of the article, you are now well familiar on how to write statistical research questions. Practice makes perfect.
References:
Chomitz, V. R., Slining, M. M., McGowan, R. J., Mitchell, S. E., Dawson, G. F., & Hacker, K. A. (2009). Is there a relationship between physical fitness and academic achievement? Positive results from public school children in the northeastern United States. Journal of School Health , 79 (1), 30-37.
Lega, C., Gidlow, C., Jones, M., Ellis, N., & Hurst, G. (2021). The relationship between surrounding greenness, stress and memory. Urban Forestry & Urban Greening , 59 , 126974.
Måseide, H. (2021). Income and Happiness: Does the relationship vary with age?
McGarry, B. E., Gandhi, A. D., Grabowski, D. C., & Barnett, M. L. (2021). Larger Nursing Home Staff Size Linked To Higher Number Of COVID-19 Cases In 2020: Study examines the relationship between staff size and COVID-19 cases in nursing homes and skilled nursing facilities. Health Affairs, 40(8), 1261-1269.
Zapata, O. (2021). The relationship between climate conditions and consumption of bottled water: A potential link between climate change and plastic pollution. Ecological Economics, 187, 107090.
© P. A. Regoniel 12 October 2021 | Updated 08 January 2024
Related Posts

Gnumeric 1.12.50: Free Spreadsheet Software Like Excel
Mango Pulp Weevil: A Pest Control Problem in Palawan Island
Writing a research article: how to paraphrase, about the author, patrick regoniel.
Dr. Regoniel, a faculty member of the graduate school, served as consultant to various environmental research and development projects covering issues and concerns on climate change, coral reef resources and management, economic valuation of environmental and natural resources, mining, and waste management and pollution. He has extensive experience on applied statistics, systems modelling and analysis, an avid practitioner of LaTeX, and a multidisciplinary web developer. He leverages pioneering AI-powered content creation tools to produce unique and comprehensive articles in this website.
SimplyEducate.Me Privacy Policy
Top 99+ Trending Statistics Research Topics for Students

Being a statistics student, finding the best statistics research topics is quite challenging. But not anymore; find the best statistics research topics now!!!
Statistics is one of the tough subjects because it consists of lots of formulas, equations and many more. Therefore the students need to spend their time to understand these concepts. And when it comes to finding the best statistics research project for their topics, statistics students are always looking for someone to help them.
In this blog, we will share with you the most interesting and trending statistics research topics in 2023. It will not just help you to stand out in your class but also help you to explore more about the world.
If you face any problem regarding statistics, then don’t worry. You can get the best statistics assignment help from one of our experts.
As you know, it is always suggested that you should work on interesting topics. That is why we have mentioned the most interesting research topics for college students and high school students. Here in this blog post, we will share with you the list of 99+ awesome statistics research topics.
Why Do We Need to Have Good Statistics Research Topics?
Table of Contents
Having a good research topic will not just help you score good grades, but it will also allow you to finish your project quickly. Because whenever we work on something interesting, our productivity automatically boosts. Thus, you need not invest lots of time and effort, and you can achieve the best with minimal effort and time.
What Are Some Interesting Research Topics?
If we talk about the interesting research topics in statistics, it can vary from student to student. But here are the key topics that are quite interesting for almost every student:-
- Literacy rate in a city.
- Abortion and pregnancy rate in the USA.
- Eating disorders in the citizens.
- Parent role in self-esteem and confidence of the student.
- Uses of AI in our daily life to business corporates.
Top 99+ Trending Statistics Research Topics For 2023
Here in this section, we will tell you more than 99 trending statistics research topics:
Sports Statistics Research Topics
- Statistical analysis for legs and head injuries in Football.
- Statistical analysis for shoulder and knee injuries in MotoGP.
- Deep statistical evaluation for the doping test in sports from the past decade.
- Statistical observation on the performance of athletes in the last Olympics.
- Role and effect of sports in the life of the student.
Psychology Research Topics for Statistics
- Deep statistical analysis of the effect of obesity on the student’s mental health in high school and college students.
- Statistical evolution to find out the suicide reason among students and adults.
- Statistics analysis to find out the effect of divorce on children in a country.
- Psychology affects women because of the gender gap in specific country areas.
- Statistics analysis to find out the cause of online bullying in students’ lives.
- In Psychology, PTSD and descriptive tendencies are discussed.
- The function of researchers in statistical testing and probability.
- Acceptable significance and probability thresholds in clinical Psychology.
- The utilization of hypothesis and the role of P 0.05 for improved comprehension.
- What types of statistical data are typically rejected in psychology?
- The application of basic statistical principles and reasoning in psychological analysis.
- The role of correlation is when several psychological concepts are at risk.
- Actual case study learning and modeling are used to generate statistical reports.
- In psychology, naturalistic observation is used as a research sample.
- How should descriptive statistics be used to represent behavioral data sets?
Applied Statistics Research Topics
- Does education have a deep impact on the financial success of an individual?
- The investment in digital technology is having a meaningful return for corporations?
- The gap of financial wealth between rich and poor in the USA.
- A statistical approach to identify the effects of high-frequency trading in financial markets.
- Statistics analysis to determine the impact of the multi-agent model in financial markets.
Personalized Medicine Statistics Research Topics
- Statistical analysis on the effect of methamphetamine on substance abusers.
- Deep research on the impact of the Corona vaccine on the Omnicrone variant.
- Find out the best cancer treatment approach between orthodox therapies and alternative therapies.
- Statistics analysis to identify the role of genes in the child’s overall immunity.
- What factors help the patients to survive from Coronavirus .
Experimental Design Statistics Research Topics
- Generic vs private education is one of the best for the students and has better financial return.
- Psychology vs physiology: which leads the person not to quit their addictions?
- Effect of breastmilk vs packed milk on the infant child overall development
- Which causes more accidents: male alcoholics vs female alcoholics.
- What causes the student not to reveal the cyberbullying in front of their parents in most cases.
Easy Statistics Research Topics
- Application of statistics in the world of data science
- Statistics for finance: how statistics is helping the company to grow their finance
- Advantages and disadvantages of Radar chart
- Minor marriages in south-east Asia and African countries.
- Discussion of ANOVA and correlation.
- What statistical methods are most effective for active sports?
- When measuring the correctness of college tests, a ranking statistical approach is used.
- Statistics play an important role in Data Mining operations.
- The practical application of heat estimation in engineering fields.
- In the field of speech recognition, statistical analysis is used.
- Estimating probiotics: how much time is necessary for an accurate statistical sample?
- How will the United States population grow in the next twenty years?
- The legislation and statistical reports deal with contentious issues.
- The application of empirical entropy approaches with online grammar checking.
- Transparency in statistical methodology and the reporting system of the United States Census Bureau.
Statistical Research Topics for High School
- Uses of statistics in chemometrics
- Statistics in business analytics and business intelligence
- Importance of statistics in physics.
- Deep discussion about multivariate statistics
- Uses of Statistics in machine learning
Survey Topics for Statistics
- Gather the data of the most qualified professionals in a specific area.
- Survey the time wasted by the students in watching Tvs or Netflix.
- Have a survey the fully vaccinated people in the USA
- Gather information on the effect of a government survey on the life of citizens
- Survey to identify the English speakers in the world.
Statistics Research Paper Topics for Graduates
- Have a deep decision of Bayes theorems
- Discuss the Bayesian hierarchical models
- Analysis of the process of Japanese restaurants.
- Deep analysis of Lévy’s continuity theorem
- Analysis of the principle of maximum entropy
AP Statistics Topics
- Discuss about the importance of econometrics
- Analyze the pros and cons of Probit Model
- Types of probability models and their uses
- Deep discussion of ortho stochastic matrix
- Find out the ways to get an adjacency matrix quickly
Good Statistics Research Topics
- National income and the regulation of cryptocurrency.
- The benefits and drawbacks of regression analysis.
- How can estimate methods be used to correct statistical differences?
- Mathematical prediction models vs observation tactics.
- In sociology research, there is bias in quantitative data analysis.
- Inferential analytical approaches vs. descriptive statistics.
- How reliable are AI-based methods in statistical analysis?
- The internet news reporting and the fluctuations: statistics reports.
- The importance of estimate in modeled statistics and artificial sampling.
Business Statistics Topics
- Role of statistics in business in 2023
- Importance of business statistics and analytics
- What is the role of central tendency and dispersion in statistics
- Best process of sampling business data.
- Importance of statistics in big data.
- The characteristics of business data sampling: benefits and cons of software solutions.
- How may two different business tasks be tackled concurrently using linear regression analysis?
- In economic data relations, index numbers, random probability, and correctness are all important.
- The advantages of a dataset approach to statistics in programming statistics.
- Commercial statistics: how should the data be prepared for maximum accuracy?
Statistical Research Topics for College Students
- Evaluate the role of John Tukey’s contribution to statistics.
- The role of statistics to improve ADHD treatment.
- The uses and timeline of probability in statistics.
- Deep analysis of Gertrude Cox’s experimental design in statistics.
- Discuss about Florence Nightingale in statistics.
- What sorts of music do college students prefer?
- The Main Effect of Different Subjects on Student Performance.
- The Importance of Analytics in Statistics Research.
- The Influence of a Better Student in Class.
- Do extracurricular activities help in the transformation of personalities?
- Backbenchers’ Impact on Class Performance.
- Medication’s Importance in Class Performance.
- Are e-books better than traditional books?
- Choosing aspects of a subject in college

How To Write Good Statistics Research Topics?
So, the main question that arises here is how you can write good statistics research topics. The trick is understanding the methodology that is used to collect and interpret statistical data. However, if you are trying to pick any topic for your statistics project, you must think about it before going any further.
As a result, it will teach you about the data types that will be researched because the sample will be chosen correctly. On the other hand, your basic outline for choosing the correct topics is as follows:
- Introduction of a problem
- Methodology explanation and choice.
- Statistical research itself is in the main part (Body Part).
- Samples deviations and variables.
- Lastly, statistical interpretation is your last part (conclusion).
Note: Always include the sources from which you obtained the statistics data.
Top 3 Tips to Choose Good Statistics Research Topics
It can be quite easy for some students to pick a good statistics research topic without the help of an essay writer. But we know that it is not a common scenario for every student. That is why we will mention some of the best tips that will help you choose good statistics research topics for your next project. Either you are in a hurry or have enough time to explore. These tips will help you in every scenario.
1. Narrow down your research topic
We all start with many topics as we are not sure about our specific interests or niche. The initial step to picking up a good research topic for college or school students is to narrow down the research topic.
For this, you need to categorize the matter first. And then pick a specific category as per your interest. After that, brainstorm about the topic’s content and how you can make the points catchy, focused, directional, clear, and specific.
2. Choose a topic that gives you curiosity
After categorizing the statistics research topics, it is time to pick one from the category. Don’t pick the most common topic because it will not help your grades and knowledge. Instead of it, please choose the best one, in which you have little information, or you are more likely to explore it.
In a statistics research paper, you always can explore something beyond your studies. By doing this, you will be more energetic to work on this project. And you will also feel glad to get them lots of information you were willing to have but didn’t get because of any reasons.
It will also make your professor happy to see your work. Ultimately it will affect your grades with a positive attitude.
3. Choose a manageable topic
Now you have decided on the topic, but you need to make sure that your research topic should be manageable. You will have limited time and resources to complete your project if you pick one of the deep statistics research topics with massive information.
Then you will struggle at the last moment and most probably not going to finish your project on time. Therefore, spend enough time exploring the topic and have a good idea about the time duration and resources you will use for the project.
Statistics research topics are massive in numbers. Because statistics operations can be performed on anything from our psychology to our fitness. Therefore there are lots more statistics research topics to explore. But if you are not finding it challenging, then you can take the help of our statistics experts . They will help you to pick the most interesting and trending statistics research topics for your projects.
With this help, you can also save your precious time to invest it in something else. You can also come up with a plethora of topics of your choice and we will help you to pick the best one among them. Apart from that, if you are working on a project and you are not sure whether that is the topic that excites you to work on it or not. Then we can also help you to clear all your doubts on the statistics research topic.
Frequently Asked Questions
Q1. what are some good topics for the statistics project.
Have a look at some good topics for statistics projects:- 1. Research the average height and physics of basketball players. 2. Birth and death rate in a specific city or country. 3. Study on the obesity rate of children and adults in the USA. 4. The growth rate of China in the past few years 5. Major causes of injury in Football
Q2. What are the topics in statistics?
Statistics has lots of topics. It is hard to cover all of them in a short answer. But here are the major ones: conditional probability, variance, random variable, probability distributions, common discrete, and many more.
Q3. What are the top 10 research topics?
Here are the top 10 research topics that you can try in 2023:
1. Plant Science 2. Mental health 3. Nutritional Immunology 4. Mood disorders 5. Aging brains 6. Infectious disease 7. Music therapy 8. Political misinformation 9. Canine Connection 10. Sustainable agriculture
Related Posts

How to Find the Best Online Statistics Homework Help

Why SPSS Homework Help Is An Important aspect for Students?
MATHEMATICS Quarter 4 – Module 5 Statistical Mini-Research
- MATHEMATICS Quarter 4 – Module 4 Solving Problems Involving Measures of Position
- MATHEMATICS Quarter 4 – Module 1 Illustrating The Measures of Position for Ungrouped Data
- MATHEMATICS Quarter 4 – Module 2 Calculating Measures of Position for Grouped Data
- MATHEMATICS Quarter 4 – Module 3 Interpreting Measures of Position
- MATHEMATICS Quarter 4 – Module 6 Measures of Position and Other Statistical Methods
Thank you for visiting nature.com. You are using a browser version with limited support for CSS. To obtain the best experience, we recommend you use a more up to date browser (or turn off compatibility mode in Internet Explorer). In the meantime, to ensure continued support, we are displaying the site without styles and JavaScript.
- View all journals
- My Account Login
- Explore content
- About the journal
- Publish with us
- Sign up for alerts
- Data Descriptor
- Open access
- Published: 03 May 2024
A dataset for measuring the impact of research data and their curation
- Libby Hemphill ORCID: orcid.org/0000-0002-3793-7281 1 , 2 ,
- Andrea Thomer 3 ,
- Sara Lafia 1 ,
- Lizhou Fan 2 ,
- David Bleckley ORCID: orcid.org/0000-0001-7715-4348 1 &
- Elizabeth Moss 1
Scientific Data volume 11 , Article number: 442 ( 2024 ) Cite this article
542 Accesses
8 Altmetric
Metrics details
- Research data
- Social sciences
Science funders, publishers, and data archives make decisions about how to responsibly allocate resources to maximize the reuse potential of research data. This paper introduces a dataset developed to measure the impact of archival and data curation decisions on data reuse. The dataset describes 10,605 social science research datasets, their curation histories, and reuse contexts in 94,755 publications that cover 59 years from 1963 to 2022. The dataset was constructed from study-level metadata, citing publications, and curation records available through the Inter-university Consortium for Political and Social Research (ICPSR) at the University of Michigan. The dataset includes information about study-level attributes (e.g., PIs, funders, subject terms); usage statistics (e.g., downloads, citations); archiving decisions (e.g., curation activities, data transformations); and bibliometric attributes (e.g., journals, authors) for citing publications. This dataset provides information on factors that contribute to long-term data reuse, which can inform the design of effective evidence-based recommendations to support high-impact research data curation decisions.
SciSciNet: A large-scale open data lake for the science of science research
Data, measurement and empirical methods in the science of science
Interdisciplinarity revisited: evidence for research impact and dynamism
Background & summary.
Recent policy changes in funding agencies and academic journals have increased data sharing among researchers and between researchers and the public. Data sharing advances science and provides the transparency necessary for evaluating, replicating, and verifying results. However, many data-sharing policies do not explain what constitutes an appropriate dataset for archiving or how to determine the value of datasets to secondary users 1 , 2 , 3 . Questions about how to allocate data-sharing resources efficiently and responsibly have gone unanswered 4 , 5 , 6 . For instance, data-sharing policies recognize that not all data should be curated and preserved, but they do not articulate metrics or guidelines for determining what data are most worthy of investment.
Despite the potential for innovation and advancement that data sharing holds, the best strategies to prioritize datasets for preparation and archiving are often unclear. Some datasets are likely to have more downstream potential than others, and data curation policies and workflows should prioritize high-value data instead of being one-size-fits-all. Though prior research in library and information science has shown that the “analytic potential” of a dataset is key to its reuse value 7 , work is needed to implement conceptual data reuse frameworks 8 , 9 , 10 , 11 , 12 , 13 , 14 . In addition, publishers and data archives need guidance to develop metrics and evaluation strategies to assess the impact of datasets.
Several existing resources have been compiled to study the relationship between the reuse of scholarly products, such as datasets (Table 1 ); however, none of these resources include explicit information on how curation processes are applied to data to increase their value, maximize their accessibility, and ensure their long-term preservation. The CCex (Curation Costs Exchange) provides models of curation services along with cost-related datasets shared by contributors but does not make explicit connections between them or include reuse information 15 . Analyses on platforms such as DataCite 16 have focused on metadata completeness and record usage, but have not included related curation-level information. Analyses of GenBank 17 and FigShare 18 , 19 citation networks do not include curation information. Related studies of Github repository reuse 20 and Softcite software citation 21 reveal significant factors that impact the reuse of secondary research products but do not focus on research data. RD-Switchboard 22 and DSKG 23 are scholarly knowledge graphs linking research data to articles, patents, and grants, but largely omit social science research data and do not include curation-level factors. To our knowledge, other studies of curation work in organizations similar to ICPSR – such as GESIS 24 , Dataverse 25 , and DANS 26 – have not made their underlying data available for analysis.
This paper describes a dataset 27 compiled for the MICA project (Measuring the Impact of Curation Actions) led by investigators at ICPSR, a large social science data archive at the University of Michigan. The dataset was originally developed to study the impacts of data curation and archiving on data reuse. The MICA dataset has supported several previous publications investigating the intensity of data curation actions 28 , the relationship between data curation actions and data reuse 29 , and the structures of research communities in a data citation network 30 . Collectively, these studies help explain the return on various types of curatorial investments. The dataset that we introduce in this paper, which we refer to as the MICA dataset, has the potential to address research questions in the areas of science (e.g., knowledge production), library and information science (e.g., scholarly communication), and data archiving (e.g., reproducible workflows).
We constructed the MICA dataset 27 using records available at ICPSR, a large social science data archive at the University of Michigan. Data set creation involved: collecting and enriching metadata for articles indexed in the ICPSR Bibliography of Data-related Literature against the Dimensions AI bibliometric database; gathering usage statistics for studies from ICPSR’s administrative database; processing data curation work logs from ICPSR’s project tracking platform, Jira; and linking data in social science studies and series to citing analysis papers (Fig. 1 ).
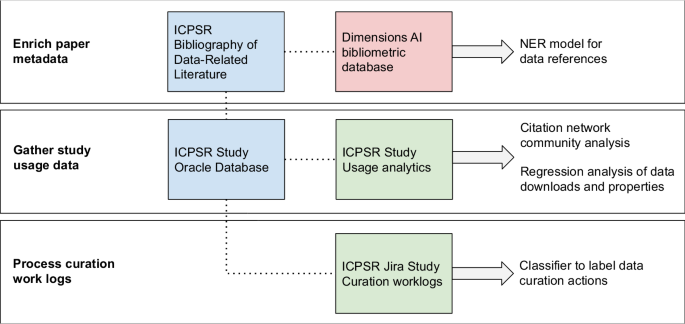
Steps to prepare MICA dataset for analysis - external sources are red, primary internal sources are blue, and internal linked sources are green.
Enrich paper metadata
The ICPSR Bibliography of Data-related Literature is a growing database of literature in which data from ICPSR studies have been used. Its creation was funded by the National Science Foundation (Award 9977984), and for the past 20 years it has been supported by ICPSR membership and multiple US federally-funded and foundation-funded topical archives at ICPSR. The Bibliography was originally launched in the year 2000 to aid in data discovery by providing a searchable database linking publications to the study data used in them. The Bibliography collects the universe of output based on the data shared in each study through, which is made available through each ICPSR study’s webpage. The Bibliography contains both peer-reviewed and grey literature, which provides evidence for measuring the impact of research data. For an item to be included in the ICPSR Bibliography, it must contain an analysis of data archived by ICPSR or contain a discussion or critique of the data collection process, study design, or methodology 31 . The Bibliography is manually curated by a team of librarians and information specialists at ICPSR who enter and validate entries. Some publications are supplied to the Bibliography by data depositors, and some citations are submitted to the Bibliography by authors who abide by ICPSR’s terms of use requiring them to submit citations to works in which they analyzed data retrieved from ICPSR. Most of the Bibliography is populated by Bibliography team members, who create custom queries for ICPSR studies performed across numerous sources, including Google Scholar, ProQuest, SSRN, and others. Each record in the Bibliography is one publication that has used one or more ICPSR studies. The version we used was captured on 2021-11-16 and included 94,755 publications.
To expand the coverage of the ICPSR Bibliography, we searched exhaustively for all ICPSR study names, unique numbers assigned to ICPSR studies, and DOIs 32 using a full-text index available through the Dimensions AI database 33 . We accessed Dimensions through a license agreement with the University of Michigan. ICPSR Bibliography librarians and information specialists manually reviewed and validated new entries that matched one or more search criteria. We then used Dimensions to gather enriched metadata and full-text links for items in the Bibliography with DOIs. We matched 43% of the items in the Bibliography to enriched Dimensions metadata including abstracts, field of research codes, concepts, and authors’ institutional information; we also obtained links to full text for 16% of Bibliography items. Based on licensing agreements, we included Dimensions identifiers and links to full text so that users with valid publisher and database access can construct an enriched publication dataset.
Gather study usage data
ICPSR maintains a relational administrative database, DBInfo, that organizes study-level metadata and information on data reuse across separate tables. Studies at ICPSR consist of one or more files collected at a single time or for a single purpose; studies in which the same variables are observed over time are grouped into series. Each study at ICPSR is assigned a DOI, and its metadata are stored in DBInfo. Study metadata follows the Data Documentation Initiative (DDI) Codebook 2.5 standard. DDI elements included in our dataset are title, ICPSR study identification number, DOI, authoring entities, description (abstract), funding agencies, subject terms assigned to the study during curation, and geographic coverage. We also created variables based on DDI elements: total variable count, the presence of survey question text in the metadata, the number of author entities, and whether an author entity was an institution. We gathered metadata for ICPSR’s 10,605 unrestricted public-use studies available as of 2021-11-16 ( https://www.icpsr.umich.edu/web/pages/membership/or/metadata/oai.html ).
To link study usage data with study-level metadata records, we joined study metadata from DBinfo on study usage information, which included total study downloads (data and documentation), individual data file downloads, and cumulative citations from the ICPSR Bibliography. We also gathered descriptive metadata for each study and its variables, which allowed us to summarize and append recoded fields onto the study-level metadata such as curation level, number and type of principle investigators, total variable count, and binary variables indicating whether the study data were made available for online analysis, whether survey question text was made searchable online, and whether the study variables were indexed for search. These characteristics describe aspects of the discoverability of the data to compare with other characteristics of the study. We used the study and series numbers included in the ICPSR Bibliography as unique identifiers to link papers to metadata and analyze the community structure of dataset co-citations in the ICPSR Bibliography 32 .
Process curation work logs
Researchers deposit data at ICPSR for curation and long-term preservation. Between 2016 and 2020, more than 3,000 research studies were deposited with ICPSR. Since 2017, ICPSR has organized curation work into a central unit that provides varied levels of curation that vary in the intensity and complexity of data enhancement that they provide. While the levels of curation are standardized as to effort (level one = less effort, level three = most effort), the specific curatorial actions undertaken for each dataset vary. The specific curation actions are captured in Jira, a work tracking program, which data curators at ICPSR use to collaborate and communicate their progress through tickets. We obtained access to a corpus of 669 completed Jira tickets corresponding to the curation of 566 unique studies between February 2017 and December 2019 28 .
To process the tickets, we focused only on their work log portions, which contained free text descriptions of work that data curators had performed on a deposited study, along with the curators’ identifiers, and timestamps. To protect the confidentiality of the data curators and the processing steps they performed, we collaborated with ICPSR’s curation unit to propose a classification scheme, which we used to train a Naive Bayes classifier and label curation actions in each work log sentence. The eight curation action labels we proposed 28 were: (1) initial review and planning, (2) data transformation, (3) metadata, (4) documentation, (5) quality checks, (6) communication, (7) other, and (8) non-curation work. We note that these categories of curation work are very specific to the curatorial processes and types of data stored at ICPSR, and may not match the curation activities at other repositories. After applying the classifier to the work log sentences, we obtained summary-level curation actions for a subset of all ICPSR studies (5%), along with the total number of hours spent on data curation for each study, and the proportion of time associated with each action during curation.
Data Records
The MICA dataset 27 connects records for each of ICPSR’s archived research studies to the research publications that use them and related curation activities available for a subset of studies (Fig. 2 ). Each of the three tables published in the dataset is available as a study archived at ICPSR. The data tables are distributed as statistical files available for use in SAS, SPSS, Stata, and R as well as delimited and ASCII text files. The dataset is organized around studies and papers as primary entities. The studies table lists ICPSR studies, their metadata attributes, and usage information; the papers table was constructed using the ICPSR Bibliography and Dimensions database; and the curation logs table summarizes the data curation steps performed on a subset of ICPSR studies.
Studies (“ICPSR_STUDIES”): 10,605 social science research datasets available through ICPSR up to 2021-11-16 with variables for ICPSR study number, digital object identifier, study name, series number, series title, authoring entities, full-text description, release date, funding agency, geographic coverage, subject terms, topical archive, curation level, single principal investigator (PI), institutional PI, the total number of PIs, total variables in data files, question text availability, study variable indexing, level of restriction, total unique users downloading study data files and codebooks, total unique users downloading data only, and total unique papers citing data through November 2021. Studies map to the papers and curation logs table through ICPSR study numbers as “STUDY”. However, not every study in this table will have records in the papers and curation logs tables.
Papers (“ICPSR_PAPERS”): 94,755 publications collected from 2000-08-11 to 2021-11-16 in the ICPSR Bibliography and enriched with metadata from the Dimensions database with variables for paper number, identifier, title, authors, publication venue, item type, publication date, input date, ICPSR series numbers used in the paper, ICPSR study numbers used in the paper, the Dimension identifier, and the Dimensions link to the publication’s full text. Papers map to the studies table through ICPSR study numbers in the “STUDY_NUMS” field. Each record represents a single publication, and because a researcher can use multiple datasets when creating a publication, each record may list multiple studies or series.
Curation logs (“ICPSR_CURATION_LOGS”): 649 curation logs for 563 ICPSR studies (although most studies in the subset had one curation log, some studies were associated with multiple logs, with a maximum of 10) curated between February 2017 and December 2019 with variables for study number, action labels assigned to work description sentences using a classifier trained on ICPSR curation logs, hours of work associated with a single log entry, and total hours of work logged for the curation ticket. Curation logs map to the study and paper tables through ICPSR study numbers as “STUDY”. Each record represents a single logged action, and future users may wish to aggregate actions to the study level before joining tables.
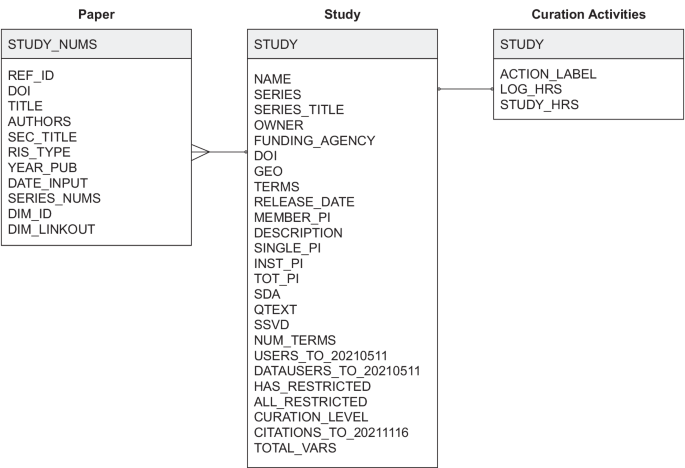
Entity-relation diagram.
Technical Validation
We report on the reliability of the dataset’s metadata in the following subsections. To support future reuse of the dataset, curation services provided through ICPSR improved data quality by checking for missing values, adding variable labels, and creating a codebook.
All 10,605 studies available through ICPSR have a DOI and a full-text description summarizing what the study is about, the purpose of the study, the main topics covered, and the questions the PIs attempted to answer when they conducted the study. Personal names (i.e., principal investigators) and organizational names (i.e., funding agencies) are standardized against an authority list maintained by ICPSR; geographic names and subject terms are also standardized and hierarchically indexed in the ICPSR Thesaurus 34 . Many of ICPSR’s studies (63%) are in a series and are distributed through the ICPSR General Archive (56%), a non-topical archive that accepts any social or behavioral science data. While study data have been available through ICPSR since 1962, the earliest digital release date recorded for a study was 1984-03-18, when ICPSR’s database was first employed, and the most recent date is 2021-10-28 when the dataset was collected.
Curation level information was recorded starting in 2017 and is available for 1,125 studies (11%); approximately 80% of studies with assigned curation levels received curation services, equally distributed between Levels 1 (least intensive), 2 (moderately intensive), and 3 (most intensive) (Fig. 3 ). Detailed descriptions of ICPSR’s curation levels are available online 35 . Additional metadata are available for a subset of 421 studies (4%), including information about whether the study has a single PI, an institutional PI, the total number of PIs involved, total variables recorded is available for online analysis, has searchable question text, has variables that are indexed for search, contains one or more restricted files, and whether the study is completely restricted. We provided additional metadata for this subset of ICPSR studies because they were released within the past five years and detailed curation and usage information were available for them. Usage statistics including total downloads and data file downloads are available for this subset of studies as well; citation statistics are available for 8,030 studies (76%). Most ICPSR studies have fewer than 500 users, as indicated by total downloads, or citations (Fig. 4 ).
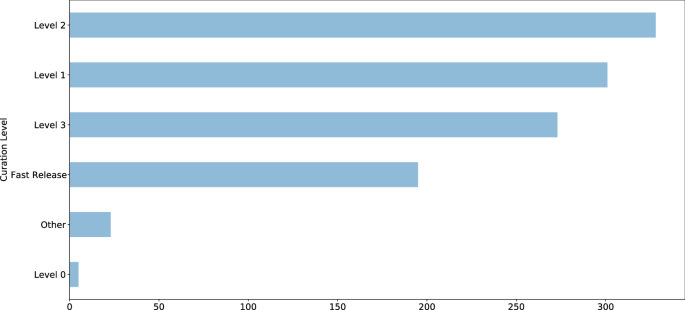
ICPSR study curation levels.
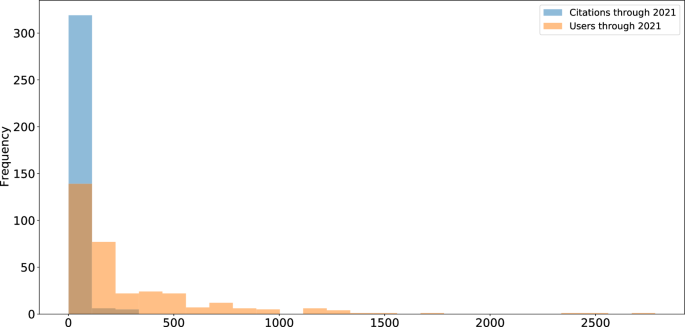
ICPSR study usage.
A subset of 43,102 publications (45%) available in the ICPSR Bibliography had a DOI. Author metadata were entered as free text, meaning that variations may exist and require additional normalization and pre-processing prior to analysis. While author information is standardized for each publication, individual names may appear in different sort orders (e.g., “Earls, Felton J.” and “Stephen W. Raudenbush”). Most of the items in the ICPSR Bibliography as of 2021-11-16 were journal articles (59%), reports (14%), conference presentations (9%), or theses (8%) (Fig. 5 ). The number of publications collected in the Bibliography has increased each decade since the inception of ICPSR in 1962 (Fig. 6 ). Most ICPSR studies (76%) have one or more citations in a publication.
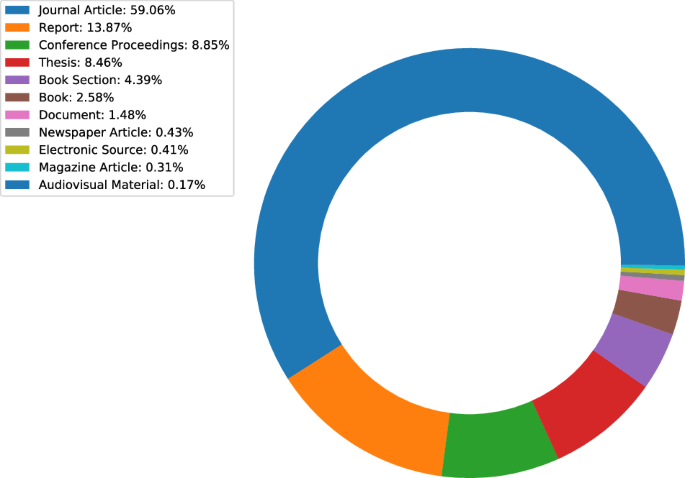
ICPSR Bibliography citation types.
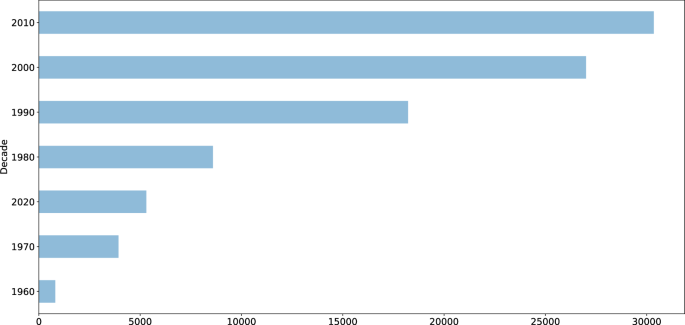
ICPSR citations by decade.
Usage Notes
The dataset consists of three tables that can be joined using the “STUDY” key as shown in Fig. 2 . The “ICPSR_PAPERS” table contains one row per paper with one or more cited studies in the “STUDY_NUMS” column. We manipulated and analyzed the tables as CSV files with the Pandas library 36 in Python and the Tidyverse packages 37 in R.
The present MICA dataset can be used independently to study the relationship between curation decisions and data reuse. Evidence of reuse for specific studies is available in several forms: usage information, including downloads and citation counts; and citation contexts within papers that cite data. Analysis may also be performed on the citation network formed between datasets and papers that use them. Finally, curation actions can be associated with properties of studies and usage histories.
This dataset has several limitations of which users should be aware. First, Jira tickets can only be used to represent the intensiveness of curation for activities undertaken since 2017, when ICPSR started using both Curation Levels and Jira. Studies published before 2017 were all curated, but documentation of the extent of that curation was not standardized and therefore could not be included in these analyses. Second, the measure of publications relies upon the authors’ clarity of data citation and the ICPSR Bibliography staff’s ability to discover citations with varying formality and clarity. Thus, there is always a chance that some secondary-data-citing publications have been left out of the bibliography. Finally, there may be some cases in which a paper in the ICSPSR bibliography did not actually obtain data from ICPSR. For example, PIs have often written about or even distributed their data prior to their archival in ICSPR. Therefore, those publications would not have cited ICPSR but they are still collected in the Bibliography as being directly related to the data that were eventually deposited at ICPSR.
In summary, the MICA dataset contains relationships between two main types of entities – papers and studies – which can be mined. The tables in the MICA dataset have supported network analysis (community structure and clique detection) 30 ; natural language processing (NER for dataset reference detection) 32 ; visualizing citation networks (to search for datasets) 38 ; and regression analysis (on curation decisions and data downloads) 29 . The data are currently being used to develop research metrics and recommendation systems for research data. Given that DOIs are provided for ICPSR studies and articles in the ICPSR Bibliography, the MICA dataset can also be used with other bibliometric databases, including DataCite, Crossref, OpenAlex, and related indexes. Subscription-based services, such as Dimensions AI, are also compatible with the MICA dataset. In some cases, these services provide abstracts or full text for papers from which data citation contexts can be extracted for semantic content analysis.
Code availability
The code 27 used to produce the MICA project dataset is available on GitHub at https://github.com/ICPSR/mica-data-descriptor and through Zenodo with the identifier https://doi.org/10.5281/zenodo.8432666 . Data manipulation and pre-processing were performed in Python. Data curation for distribution was performed in SPSS.
He, L. & Han, Z. Do usage counts of scientific data make sense? An investigation of the Dryad repository. Library Hi Tech 35 , 332–342 (2017).
Article Google Scholar
Brickley, D., Burgess, M. & Noy, N. Google dataset search: Building a search engine for datasets in an open web ecosystem. In The World Wide Web Conference - WWW ‘19 , 1365–1375 (ACM Press, San Francisco, CA, USA, 2019).
Buneman, P., Dosso, D., Lissandrini, M. & Silvello, G. Data citation and the citation graph. Quantitative Science Studies 2 , 1399–1422 (2022).
Chao, T. C. Disciplinary reach: Investigating the impact of dataset reuse in the earth sciences. Proceedings of the American Society for Information Science and Technology 48 , 1–8 (2011).
Article ADS Google Scholar
Parr, C. et al . A discussion of value metrics for data repositories in earth and environmental sciences. Data Science Journal 18 , 58 (2019).
Eschenfelder, K. R., Shankar, K. & Downey, G. The financial maintenance of social science data archives: Four case studies of long–term infrastructure work. J. Assoc. Inf. Sci. Technol. 73 , 1723–1740 (2022).
Palmer, C. L., Weber, N. M. & Cragin, M. H. The analytic potential of scientific data: Understanding re-use value. Proceedings of the American Society for Information Science and Technology 48 , 1–10 (2011).
Zimmerman, A. S. New knowledge from old data: The role of standards in the sharing and reuse of ecological data. Sci. Technol. Human Values 33 , 631–652 (2008).
Cragin, M. H., Palmer, C. L., Carlson, J. R. & Witt, M. Data sharing, small science and institutional repositories. Philosophical Transactions of the Royal Society A: Mathematical, Physical and Engineering Sciences 368 , 4023–4038 (2010).
Article ADS CAS Google Scholar
Fear, K. M. Measuring and Anticipating the Impact of Data Reuse . Ph.D. thesis, University of Michigan (2013).
Borgman, C. L., Van de Sompel, H., Scharnhorst, A., van den Berg, H. & Treloar, A. Who uses the digital data archive? An exploratory study of DANS. Proceedings of the Association for Information Science and Technology 52 , 1–4 (2015).
Pasquetto, I. V., Borgman, C. L. & Wofford, M. F. Uses and reuses of scientific data: The data creators’ advantage. Harvard Data Science Review 1 (2019).
Gregory, K., Groth, P., Scharnhorst, A. & Wyatt, S. Lost or found? Discovering data needed for research. Harvard Data Science Review (2020).
York, J. Seeking equilibrium in data reuse: A study of knowledge satisficing . Ph.D. thesis, University of Michigan (2022).
Kilbride, W. & Norris, S. Collaborating to clarify the cost of curation. New Review of Information Networking 19 , 44–48 (2014).
Robinson-Garcia, N., Mongeon, P., Jeng, W. & Costas, R. DataCite as a novel bibliometric source: Coverage, strengths and limitations. Journal of Informetrics 11 , 841–854 (2017).
Qin, J., Hemsley, J. & Bratt, S. E. The structural shift and collaboration capacity in GenBank networks: A longitudinal study. Quantitative Science Studies 3 , 174–193 (2022).
Article PubMed PubMed Central Google Scholar
Acuna, D. E., Yi, Z., Liang, L. & Zhuang, H. Predicting the usage of scientific datasets based on article, author, institution, and journal bibliometrics. In Smits, M. (ed.) Information for a Better World: Shaping the Global Future. iConference 2022 ., 42–52 (Springer International Publishing, Cham, 2022).
Zeng, T., Wu, L., Bratt, S. & Acuna, D. E. Assigning credit to scientific datasets using article citation networks. Journal of Informetrics 14 , 101013 (2020).
Koesten, L., Vougiouklis, P., Simperl, E. & Groth, P. Dataset reuse: Toward translating principles to practice. Patterns 1 , 100136 (2020).
Du, C., Cohoon, J., Lopez, P. & Howison, J. Softcite dataset: A dataset of software mentions in biomedical and economic research publications. J. Assoc. Inf. Sci. Technol. 72 , 870–884 (2021).
Aryani, A. et al . A research graph dataset for connecting research data repositories using RD-Switchboard. Sci Data 5 , 180099 (2018).
Färber, M. & Lamprecht, D. The data set knowledge graph: Creating a linked open data source for data sets. Quantitative Science Studies 2 , 1324–1355 (2021).
Perry, A. & Netscher, S. Measuring the time spent on data curation. Journal of Documentation 78 , 282–304 (2022).
Trisovic, A. et al . Advancing computational reproducibility in the Dataverse data repository platform. In Proceedings of the 3rd International Workshop on Practical Reproducible Evaluation of Computer Systems , P-RECS ‘20, 15–20, https://doi.org/10.1145/3391800.3398173 (Association for Computing Machinery, New York, NY, USA, 2020).
Borgman, C. L., Scharnhorst, A. & Golshan, M. S. Digital data archives as knowledge infrastructures: Mediating data sharing and reuse. Journal of the Association for Information Science and Technology 70 , 888–904, https://doi.org/10.1002/asi.24172 (2019).
Lafia, S. et al . MICA Data Descriptor. Zenodo https://doi.org/10.5281/zenodo.8432666 (2023).
Lafia, S., Thomer, A., Bleckley, D., Akmon, D. & Hemphill, L. Leveraging machine learning to detect data curation activities. In 2021 IEEE 17th International Conference on eScience (eScience) , 149–158, https://doi.org/10.1109/eScience51609.2021.00025 (2021).
Hemphill, L., Pienta, A., Lafia, S., Akmon, D. & Bleckley, D. How do properties of data, their curation, and their funding relate to reuse? J. Assoc. Inf. Sci. Technol. 73 , 1432–44, https://doi.org/10.1002/asi.24646 (2021).
Lafia, S., Fan, L., Thomer, A. & Hemphill, L. Subdivisions and crossroads: Identifying hidden community structures in a data archive’s citation network. Quantitative Science Studies 3 , 694–714, https://doi.org/10.1162/qss_a_00209 (2022).
ICPSR. ICPSR Bibliography of Data-related Literature: Collection Criteria. https://www.icpsr.umich.edu/web/pages/ICPSR/citations/collection-criteria.html (2023).
Lafia, S., Fan, L. & Hemphill, L. A natural language processing pipeline for detecting informal data references in academic literature. Proc. Assoc. Inf. Sci. Technol. 59 , 169–178, https://doi.org/10.1002/pra2.614 (2022).
Hook, D. W., Porter, S. J. & Herzog, C. Dimensions: Building context for search and evaluation. Frontiers in Research Metrics and Analytics 3 , 23, https://doi.org/10.3389/frma.2018.00023 (2018).
https://www.icpsr.umich.edu/web/ICPSR/thesaurus (2002). ICPSR. ICPSR Thesaurus.
https://www.icpsr.umich.edu/files/datamanagement/icpsr-curation-levels.pdf (2020). ICPSR. ICPSR Curation Levels.
McKinney, W. Data Structures for Statistical Computing in Python. In van der Walt, S. & Millman, J. (eds.) Proceedings of the 9th Python in Science Conference , 56–61 (2010).
Wickham, H. et al . Welcome to the Tidyverse. Journal of Open Source Software 4 , 1686 (2019).
Fan, L., Lafia, S., Li, L., Yang, F. & Hemphill, L. DataChat: Prototyping a conversational agent for dataset search and visualization. Proc. Assoc. Inf. Sci. Technol. 60 , 586–591 (2023).
Download references
Acknowledgements
We thank the ICPSR Bibliography staff, the ICPSR Data Curation Unit, and the ICPSR Data Stewardship Committee for their support of this research. This material is based upon work supported by the National Science Foundation under grant 1930645. This project was made possible in part by the Institute of Museum and Library Services LG-37-19-0134-19.
Author information
Authors and affiliations.
Inter-university Consortium for Political and Social Research, University of Michigan, Ann Arbor, MI, 48104, USA
Libby Hemphill, Sara Lafia, David Bleckley & Elizabeth Moss
School of Information, University of Michigan, Ann Arbor, MI, 48104, USA
Libby Hemphill & Lizhou Fan
School of Information, University of Arizona, Tucson, AZ, 85721, USA
Andrea Thomer
You can also search for this author in PubMed Google Scholar
Contributions
L.H. and A.T. conceptualized the study design, D.B., E.M., and S.L. prepared the data, S.L., L.F., and L.H. analyzed the data, and D.B. validated the data. All authors reviewed and edited the manuscript.
Corresponding author
Correspondence to Libby Hemphill .
Ethics declarations
Competing interests.
The authors declare no competing interests.
Additional information
Publisher’s note Springer Nature remains neutral with regard to jurisdictional claims in published maps and institutional affiliations.
Rights and permissions
Open Access This article is licensed under a Creative Commons Attribution 4.0 International License, which permits use, sharing, adaptation, distribution and reproduction in any medium or format, as long as you give appropriate credit to the original author(s) and the source, provide a link to the Creative Commons licence, and indicate if changes were made. The images or other third party material in this article are included in the article’s Creative Commons licence, unless indicated otherwise in a credit line to the material. If material is not included in the article’s Creative Commons licence and your intended use is not permitted by statutory regulation or exceeds the permitted use, you will need to obtain permission directly from the copyright holder. To view a copy of this licence, visit http://creativecommons.org/licenses/by/4.0/ .
Reprints and permissions
About this article
Cite this article.
Hemphill, L., Thomer, A., Lafia, S. et al. A dataset for measuring the impact of research data and their curation. Sci Data 11 , 442 (2024). https://doi.org/10.1038/s41597-024-03303-2
Download citation
Received : 16 November 2023
Accepted : 24 April 2024
Published : 03 May 2024
DOI : https://doi.org/10.1038/s41597-024-03303-2
Share this article
Anyone you share the following link with will be able to read this content:
Sorry, a shareable link is not currently available for this article.
Provided by the Springer Nature SharedIt content-sharing initiative
Quick links
- Explore articles by subject
- Guide to authors
- Editorial policies
Sign up for the Nature Briefing newsletter — what matters in science, free to your inbox daily.

IMAGES
VIDEO
COMMENTS
Please don't forget to subscribe, like and share, and click the notification bell to be updated on my next videos regarding lessons in Junior High School Mat...
statistical mini-research and write a statistical mini-research. What's In In Grade 7, you learned about the different methods of data gathering such as interview, questionnaire, database, observation, and experiment method. You also learned that Statistics is the science of collecting, organizing,
Table of contents. Step 1: Write your hypotheses and plan your research design. Step 2: Collect data from a sample. Step 3: Summarize your data with descriptive statistics. Step 4: Test hypotheses or make estimates with inferential statistics.
Learning Task 2Conduct a mini-research on students' performance in their third-quarter summative test in Mathematics. Apply the knowledge and skills you have...
ONDUCTING A STATISTICAL MINI-RESEARCH MATH 10 QUARTER 4 WEEK 5-6 LEARNING Task 2In this video, you will learn how to conduct a mini-research with given sampl...
Introduction. Five Examples of Statistical Research Questions. Topic 1: Physical Fitness and Academic Achievement. Statistical Research Question No. 1. Topic 2: Climate Conditions and Consumption of Bottled Water. Statistical Research Question No. 2. Topic 3: Nursing Home Staff Size and Number of COVID-19 Cases.
Contains terms, concepts and terminologies related to Statistical Mini-Research Learn with flashcards, games, and more — for free.
Abstract. Statistical methods involved in carrying out a study include planning, designing, collecting data, analysing, drawing meaningful interpretation and reporting of the research findings. The statistical analysis gives meaning to the meaningless numbers, thereby breathing life into a lifeless data. The results and inferences are precise ...
Formulating-Statistical-Mini-Research - Free download as Powerpoint Presentation (.ppt / .pptx), PDF File (.pdf), Text File (.txt) or view presentation slides online.
Conducting a Statistical Mini Research - Free download as Powerpoint Presentation (.ppt), PDF File (.pdf) or view presentation slides online. Scribd is the world's largest social reading and publishing site.
conduct statistical mini-research and apply the statistical methods. From the previous lessons you have already learned and identified the measures of position and the process of computing. Now that you have a deeper understanding of these concepts, in this lesson, you are going to apply the concepts you
Find the best statistics research topics for your project, paper or assignment. Explore the most interesting and trending topics in statistics for 2023, such as sports, psychology, applied, personalized medicine and more. Learn how to write good research topics with tips and examples.
CONDUCTING A STATISTICAL MINI-RESEARCH MATH 10 QUARTER 4 WEEK 5-6In this video, you will learn how to find find the values of quartiles, decile, percentiles ...
This document summarizes a mini-statistical research on the performance of grade 10 students in mathematics for the third quarter. It analyzes students' grades and survey responses. The research found that 88% of students scored below 92.25% with an average grade of 85.73%. Most students reported difficulties understanding mathematical processes. Nearly half found the topic of conditional ...
Center for Statistical Research and Methodology (CSRM) conducts research on statistical design, modeling, and analysis methods for the Census Bureau's data collection, analysis, and dissemination programs. Data obtained by the Census Bureau report on people's behavior and condition: Who they are. How they live.
55. To summarize, let us consider the following Five Steps in conducting statistical mini-research : • STEP 1- State the problem, concern, or issues you need to solve (You can formulate hypothesis.) • STEP 2- Design the Research (You can make the outline to have a meaningful result.) • STEP 3- Gather data (You can gather from records, websites, survey checklist/questionnaire, interview.)
MATHEMATICS Quarter 4 - Module 5 Statistical Mini-Research. Last updated on May 29, 2021 Grade 10. Math 10 4th Quarter. Related. MATHEMATICS Quarter 4 - Module 4 Solving Problems Involving Measures of Position; MATHEMATICS Quarter 4 - Module 1 Illustrating The Measures of Position for Ungrouped Data;
CONDUCTING A STATISTICAL MINI -RESEARCHLearning Task 2 : Based on Research Conduct a mini-research on students' performance in their third quarter summative ...
Study with Quizlet and memorize flashcards containing terms like Statistical Mini-Research, Appropriate Measures of Position ; Statistical Methods, Analyzing ; Interpreting and more. Fresh features from the #1 AI-enhanced learning platform.
A statistical mini-Research 10-Onyx. Submitted to: Mrs Cesumision -Math Teacher Mrs Arias- English Teacher. TITLE Dr. Arcadio Santos National High School Km 15 East Service Road Barangay SMDP Paranaque City The Impact of Newnormal Education to the Academic Performance of the Students in Dr.
A Mini Research for Math Grade 10(1) - Free download as Word Doc (.doc / .docx), PDF File (.pdf), Text File (.txt) or read online for free. Research
Science funders, publishers, and data archives make decisions about how to responsibly allocate resources to maximize the reuse potential of research data. This paper introduces a dataset ...