
Class 8 Geography Chapter 1 Resources Extra Questions
Class 8 Geography Chapter 1 Resources Extra Questions and Answers are provided here. These Extra Questions with solution are prepared by our team of expert teachers who are teaching in CBSE schools for years. Extra questions for Class 8 Geography Chapter 1 will help you to properly understand a particular concept of the chapter.
Resources Class 8 Geography Extra Questions and Answers
Very short answer type question.
1. What are non-renewable resources?
Answer: Non-renewable resources are those which have a limited stock.
2. What is a patent?
Answer: Patent means the exclusive right over any idea or invention.
3. What do you mean by stock of resource?
Answer: Stock of resource is the amount of resources available for use.
4. What is utility?
Answer: If a substance can be used in any way, it is said to have a utility.
5. How are resources classified based on their origin?
Answer: Based on the origin, resources can be classified as abiotic or biotic.
6. What makes a substance a resource? Or How does something become a resource?
Answer: Utility or usability is what makes an object or substance a resource.
7. Why is air a ubiquitous resource?
Answer: Air is a ubiquitous resource because air we breathe is found everywhere.
8. What are renewable resources?
Answer: Renewable resources are those which get renewed or replenished quickly.
9. How are resources classified according to their distribution?
Answer: On the basis of their distribution resources can be ubiquitous or localised.
10. How are resources classified broadly?
Answer: Resources are generally classified into natural, human made and human.
11. What is resource conservation?
Answer: Using resources carefully and giving them time to get renewed is called resource conservation.
12. What is technology?
Answer: Technology is the application of latest knowledge and skill in doing or making things.
13. Name some natural resources.
Answer: The air we breathe, the water in our rivers and lakes, the soils, minerals are all natural resources.
14. What are natural resources?
Answer: Resources that are drawn from nature and used without much modification are called natural resources.
15. What is sustainable development?
Answer: Balancing the need to use resources and also conserve them for the future is called sustainable development.
Short Type Answer Questions
1. What is a Human Resource?
Answer: Human Resource refers to the number (quantity) and abilities (mental and physical) of the people.
2. How natural resources are classified?
Answer: Natural resources are classified into different groups depending upon their level of development and use; origin; stock and distribution.
3. How are resources classified according to their development and use?
Answer: On the basis of their development and use resources can be classified into two groups, actual resources and potential resources.
4. What is human resource development?
Answer: Improving the quality of people’s skills so that they are able to create more resources is known as human resource development.
5. What are the physical factors that affect the distribution of natural resources?
Answer: The distribution of natural resources depends upon number of physical factors like terrain, climate and altitude.
6. Why are human resources important?
Answer: Human resources are important because people can make the best use of nature to create more resources by applying knowledge, skill and the technology.
7. Why are people considered as a resource?
Answer: People are considered a resource because people can make the best use of nature to create more resources when they have the knowledge, skill and the technology to do so.
8. Why are resources distributed unequally over the earth?
Answer: The distribution of natural resources depends upon number of physical factors like terrain, climate and altitude. The distribution of resources is unequal because these factors differ so much over the earth.
9. How potential resource can be actual resource?
Answer: High speed winds were a potential resource two hundred years ago. Today they are an actual resource and wind farms generate energy using windmills like in Netherlands, some in Nagercoil in Tamil Nadu and on the Gujarat coast.
10. Mention how stock of certain renewable resources may get affected by overuse. Or Why certain renewable resources need to be used judiciously?
Answer: Careless use of certain renewable resources like water, soil and forest can affect their stock. Water seems to be an unlimited renewable resource. But shortage and drying up of natural water sources is a major problem in many parts of the world today.
Long Type Answer Questions
1. Differentiate between abiotic and biotic resources. Answer:
2. Differentiate between ubiquitous and localised resources.
3. Mention our duty to maintain and preserve the life support system that nature provides us.
Answer: The future of our planet and its people is linked with our ability to maintain and preserve the life support system that nature provides. Therefore, it is our duty to ensure that.
- all uses of renewable resources are sustainable
- the diversity of life on the earth is conserved
- the damage to natural environmental system is minimised.
4. What is the significance of time and technology in making a substance a resource?
Answer: Time and technology are two important factors that can change substances into resources. Each discovery or invention leads to many others. The discovery of fire led to the practice of cooking and other processes while the invention of the wheel ultimately resulted in development of newer modes of transport. The technology to create hydroelectricity has turned energy in fast flowing water into an important resource.
5. Write the basic principles of sustainable development.
Answer: Some Principles of Sustainable Development
- Respect and care for all forms of life.
- Improve the quality of human life.
- Conserve the earth’s vitality and diversity.
- Minimise the depletion of natural resources.
- Change personal attitude and practices toward the environment.
- Enable communities to care for their own environment.
6. Differentiate between natural resources and human made resources.
7. Differentiate between potential and actual resources.

Resources Extra Questions Chapter 1 Class 8 Geography
Chapter 1 Resources Class 8 Geography Extra Questions provided here is very useful in increasing concentration among students and increasing marks. Extra Questions for Class 8 will help you in understanding the concepts of the chapter properly.

Chapter 1 Resources Very Short Answer Questions (VSAQs):
Chapter 1 resources short answer questions (saqs):, chapter 1 resources long answer questions (laqs):, contact form.
Geography - Class 8

Topic outline
Chapter 1 – resources - 1.
Q1. Fill in the blanks.
i. The types of resources on basis of stock are renewable and non-renewable resources.
ii. All resources have some value .
iii. Time and technology are two important factors that can change substances into resources.
iv. On the basis of distribution resources can be ubiquitous or l ocalised .
v. On the basis of origin, resources can be abiotic or biotic .
vi. On the basis of development and use resources can be classified into two groups, actual resources and potential resources .
Q2. True/False
i. Natural gas is a non-renewable resource. True
ii. High speed winds were a potential resource two hundred years ago. True
iii. Coal, petroleum and natural gas are some examples renewable resources. False
iv. All resources have same value. False
v. All natural sources of energy are renewable. False
vi. Value means worth. True
Q3. What are non-renewable resources?
Ans. Non-renewable resources are those which have a limited stock.
Q4. What is a patent?
Ans. Patent means the exclusive right over any idea or invention.
Q5. What do you mean by stock of resource?
Ans. Stock of resource is the amount of resources available for use.
Q6. What is utility?
Ans. If a substance can be used in any way, it is said to have a utility.
Q7. How are resources classified based on their origin?
Ans. Based on the origin, resources can be classified as abiotic or biotic.
Q8. What makes a substance a resource? Or How does something become a resource?
Ans. Utility or usability is what makes an object or substance a resource.
Q9. Why is air a ubiquitous resource?
Ans. Air is a ubiquitous resource because air we breathe is found everywhere.
Q10. What are renewable resources?
Ans. Renewable resources are those which get renewed or replenished quickly.
Q11. How are resources classified according to their distribution?
Ans. On the basis of their distribution resources can be ubiquitous or localised.
Q12. How are resources classified broadly?
Ans. Resources are generally classified into natural, human made and human.
Q13. What is resource conservation?
Ans. Using resources carefully and giving them time to get renewed is called resource conservation.
Q14. What is technology?
Ans. Technology is the application of latest knowledge and skill in doing or making things.
Q15. Name some natural resources.
Ans. The air we breathe, the water in our rivers and lakes, the soils, minerals are all natural resources.
Q16. What are natural resources?
Ans. Resources that are drawn from nature and used without much modification are called natural resources.
Q17. What is sustainable development?
Ans. Balancing the need to use resources and also conserve them for the future is called sustainable development.
Q18. What is a Human Resource?
Ans. Human Resource refers to the number (quantity) and abilities (mental and physical) of the people.
Q19. How natural resources are classified?
Ans. Natural resources are classified into different groups depending upon their level of development and use; origin; stock and distribution.
Download to practice offline.
- School Guide
- Class 8 Syllabus
- Maths Notes Class 8
- Science Notes Class 8
- History Notes Class 8
- Geography Notes Class 8
- Civics Notes Class 8
- NCERT Soln. Class 8 Maths
- RD Sharma Soln. Class 8
- Math Formulas Class 8
NCERT Solutions Class 8 Geography Chapter 1 Resources
- NCERT Solutions Class 8 Geography Chapter 5 Human Resources
- NCERT Solutions For Class 10 Geography Chapter 3 : Water Resources
- NCERT Geography Class-9 Chapter-Wise Solutions
- NCERT Solutions For Class 10 Geography Chapter 5 : Minerals and Energy Resources
- NCERT Solutions Class 8 Geography Chapter 3 Agriculture
- NCERT Solutions for Class 10 Science Chapter 8 Heredity
- NCERT Solutions Class 8 Geography Social Science Chapter 4 Industries
- NCERT Solutions Class 9 Geography Social Science Chapter 6: Population
- CBSE Class 10 Geography Notes Chapter 3 : Water Resources
- NCERT Solutions of Chapter 4: Judiciary For Class-8
- NCERT Solutions for Class 12 Chapter 2 Human Reproduction
- NCERT Solutions for Class 10 Maths Chapter 1 Real Numbers
- NCERT Solutions For Class 9 Geography Social Science Chapter 4: Climate
- NCERT Solutions Class 9 History Chapter 1 French Revolution
- NCERT Solutions for Class 10 Geography Social Science Chapter 1 : Resource and Development
- NCERT Solutions for Class 9 Geography Social Science Chapter 3: Drainage
- NCERT Solutions For Class 10 Geography Chapter 4 Agriculture
- NCERT Solutions for Class 9 Maths Chapter 8 Quadrilaterals
- NCERT Solutions for Class 12 Biology Chapter 3 Reproductive Health
NCERT Solutions For Class 8 Geography Chapter 1 Resources – This article includes free NCERT Solutions For Class 8 Geography Chapter 1 Resources to help students of Class 8 learn the solutions and ace their exams.
It has been developed by the subject matter experts at GFG, according to the latest CBSE Syllabus 2023-24 , and guidelines to help the students of Class 10 create a solid conceptual base for Class 8 Geography Chapter 1 Resources.
The solutions to all the exercises in Class 8 Geography Chapter 1 Resources of your NCERT textbook have been collectively covered in NCERT Solutions Class 8 Social Science.

NCERT Solutions for Class 8 Geography Chapter 1 Resources
The solutions for Chapter 1 Resources are provided below, and students can refer to NCERT Solutions for Class 8 for other subjects as well.
Exercise Page No 5
1. answer the following questions., (i) why are resources distributed unequally over the earth.
Resources such as water, minerals, and arable land are not evenly spread across the Earth. The unequal distribution of resources across the Earth is due to a combination of natural and human factors. Natural Factors Natural resources are distributed unevenly across the Earth due to physical factors like climate, terrain, and altitude. Climate: Climate affects the distribution of resources like water, fertile soil, and vegetation. Terrain: Terrain such as mountains, plains, and coastlines influence the distribution of resources like minerals, forests, and arable land. Altitude: It plays a role in resource distribution as it affect the temperature, precipitation, and vegetation patterns of the region. Human Factors Human activities, such as deforestation, mining, and agriculture, can alter the distribution of resources. Technology enables the extraction and utilization of resource. Political and economic factors, such as trade policies and globalization, can also contribute to the unequal distribution of resources.
(ii) What is resource conservation?
Resource conservation is the responsible use of natural resources to ensure their availability for future generations. It involves using resources wisely, reducing waste, and promoting sustainable practices. There are many ways to conserve resources. A few examples: Reduce, reuse, and recycle. Conserve water and energy. Use public transportation, walk, instead of driving. Buy products that are made from recycled materials. Resource conservation is important because it helps to ensure that we have enough resources to meet our needs in the future. It also helps to protect the environment from pollution and save money and energy.
(iii) Why are human resources important?
Human resources are defined as a resource that refers to the number of people and the mental/physical capacity of people who are willing to work.They are important because they are able to make the best use of nature to create more resources. People’s discoveries, inventions, knowledge, and ideas lead to the creation of more resources. Human resources include human skill, technology, thinking, and knowledge, all of which contribute to a nation’s power. Human resources are also important because they help in the overall development of the country which includes economic and social development.
(iv) What is sustainable development?
Sustainable development is a way of developing the economy without harming the environment for future generations. It’s defined as development that meets the needs of the present without compromising the ability of future generations to meet their own needs. Some Principles of Sustainable Development includes: Respect and care for all forms of life Improve the quality of human life Conserve the earth’s vitality and diversity Minimise the depletion of natural resources Change personal attitude and practices towards the environment Enable communities to care for their own environment Sustainable development is important because it helps us to use resources judiciously, maintain ecological balance, prevent environmental degradation, and prevent overexploitation of resources.
2. Tick the correct answer.
(i) which one of the following does not make substance a resource.
(a) Utility
(c) Quantity
(ii) Which one of the following is a human made resource?
(a) Medicines to treat cancer
(b) Spring water
(c) Tropical forests
(a) Medicine to treat cancer
(iii) Complete the statement.
Non-renewable resources are
(a) those which have limited stock
(b) made by human beings
(c) derived from non-living things
Chapter 1- Resources Summary
Chapter 1 of Resources and Development helps to deal with various types of resources which exist on earth. Students will learn about human-made resources and natural resources as well as the current state of resources. The students will read in details about following topics:
- Types of resources
- The need for the conservation of resources
- Human-made resources
Important Topics Discussed in the Chapter
- Resources and its Types
- Types Of Resources
- Exhaustible and Inexhaustible Natural Resources
- Difference Between Renewable And Non-Renewable Resources
- Conservation of Resources
- Sustainable Development
FAQs on NCERT Solutions for Class 8 Geography Chapter 1: Resources
Why are human resources important in geography class 8.
Human resources are important in geography class 8 because they are a building block for a country’s development. Human resources include a country’s population, educational qualities, skills and technology.
What is a resource?
A resource is a physical material that humans value and need, such as air, land, and water. Resources can be renewable or nonrenewable.
What are human resources class 8 geography chapter 1?
Human resources in geography chapter 1 of class 8 CBSE Social Science is about the number of people and their physical and mental abilities to work. It help in transfering the physical material into a valuable resource.
What are the three main types of resources Class 8?
The three main types of resources in Class 8 are natural, human-made, and human.
What are the factors affecting resources Class 8?
The distribution of resources is affected by many physical factors, including terrain, climate, and altitude.
Please Login to comment...
Similar reads.
- Chapterwise-Solutions-Class-8
- NCERT Solutions Class-8
- School Geography
- School Learning
- Social Science
Improve your Coding Skills with Practice
What kind of Experience do you want to share?

- Book Solutions
- State Boards
Assertion and Reason Questions Class 8 Geography Chapter 1 Resources
Hello Students are looking for Assertion and Reason Questions Class 8 Geography Chapter 1 Resources, If yes here we Net Explanations have given Assertion and Reason MCQ for 8th Class Geography Chapter 1.
Solved CBSE Class 8 Geography Chapter 1 Assertion and Reason Questions – Resources. Here we (Net Explanations) working very hard to providing you with the Important Assertion Reason Questions for this Chapter.
Assertion and Reason Questions – Resources
1.) Assertion (A)- Resources could become economically valuable.
Reason (R)- if resources are patented and sold by a medical firm tomorrow
i.) A is correct but R is wrong
ii.) Both A and R are true and R is the correct explanation of A.
iii.) Both A and R are true but R is not the correct explanation of A.
iv.) A is wrong but R is correct
Answer :- ii. Both A and R are true and R is the correct explanation of A.
2.) Assertion (A)- Things become resources
Reason (R)- Resources not having any demand
Answer :- A is correct but R is wrong
3.) Assertion (A)- We will give a few to every family we know
Reason (R)- “To save our resources and to keep our earth alive”.
Answer:- ii. Both A and R are true and R is the correct explanation of A.
4.) Assertion (A)- Time and technology are two important factors that can change substances into resources
Reason (R) – Time and technology are related to the needs of the people. People themselves are the most important resource
ii.) A is wrong but R is correct
iii.) Both A and R are true and R is the correct explanation of A.
iv.) Both A and R are true but R is not the correct explanation of A.
Answer :- iii. Both A and R are true and R is the correct explanation of A.
5.) Assertion (A)- People themselves are the most important resource
Reason (R)- People get ideas, knowledge, inventions and discoveries that lead to the creation of more resources.
Answer :- iii. Both A and R are true and R is the correct explanation of A
6.) Assertion (A)- Resources that are drawn from Nature and used without much modification are called Human made resources
Reason (R)-air we breathe, the water in our rivers and lakes, the soils, minerals resources are free gifts of nature and can be used directly.
Answer :- ii. A is wrong but R is correct
7.) Assertion (A)- In Human Made Resourcessometimes natural substances become resources
Reason (R)-when natural resources original form has been kept same ,natural substances become resources.
Answer :- ii. A is correct but R is wrong
8.) Assertion (A)- Improving the quality of people’s skills so that they are able to create more resources is known as human resource development
Reason (R)- Education and health help in making people a valuable resource and People are human resources
9.) Assertion (A)- People were suffering and roaming around desperately looking for food and shade.
Reason (R)-Mona had a nightmare. She dreamt that all the water on the earth had dried up and all the trees cut down.
10.) Assertion (A)- the children and their friends made packets and shopping bags out of old newspapers, discarded clothes and baskets from bamboo sticks and gave few to every family they know.
Reason (R)- to save the resources and to keep the earth alive
Also See: Class 8 Other Chapter assertion Based Questions
Very less questions
Leave a Reply Cancel reply
Your email address will not be published. Required fields are marked *
Save my name, email, and website in this browser for the next time I comment.
We have a strong team of experienced Teachers who are here to solve all your exam preparation doubts
2025 solved icse specimen paper class 10 english paper 1, sikkim scert class 4 evs chapter 2 games we play solution, sikkim scert class 4 evs chapter 1 changing families solution, assam scert class 8 geography and economics chapter 1 solutions.
Sign in to your account
Username or Email Address
Remember Me

30,000+ students realised their study abroad dream with us. Take the first step today
Here’s your new year gift, one app for all your, study abroad needs, start your journey, track your progress, grow with the community and so much more.

Verification Code
An OTP has been sent to your registered mobile no. Please verify

Thanks for your comment !
Our team will review it before it's shown to our readers.

- Social Sciences /
NCERT Class 8 Geography: Chapter 5 Human Resources Class (Free PDF)
- Updated on
- Nov 3, 2023

Human resources is the 5 th chapter in the social science NCERT book. It describes the components of human resources, their importance and other important concepts related to this important resource. In this blog, we will learn about the Human Resources Class 8 Chapter and the important notes related to it.
Download Social Science Class 8 Geography Chapter 5 Important Questions and Answers PDF
Important Notes in NCERT Class 8 Chapter 5
People are a nation’s greatest resource. It is people with their demands and abilities that turn nature’s bounty into ‘resources’. Hence healthy, educated and motivated people develop resources as per their requirements. Human resources like other resources are not equally distributed over the world and differ in their educational levels, age and sex. Their numbers and characteristics also keep changing. The Government of India has a Ministry of Human Resource Development which was created in 1985 with an aim to improve people’s skills. This just proves how important people are as a resource for the country.
📌Also Read:
NCERT Class 7 Geography: Chapter 1 Environment (Free PDF)
NCERT Class 7 Geography: Chapter 2 Inside Our Earth (Free PDF)
NCERT Class 7 Geography: Chapter 3 Our Changing Earth (Free PDF)
Distribution of Population
The way in which people are spread across the earth’s surface is known as the pattern of population distribution . More than 90% of the world’s population lives in about 30% of the land surface. The distribution of population in the world is extremely uneven since some areas are very crowded and some are sparsely populated. The crowded areas are south and southEast Asia, Europe and north eastern North America. Almost three-quarters of the world’s people live in two continents: Asia and Africa. 60 % of the world’s people stay in just 10 countries and all of them have more than a 100 million people.
Density of Population – Population density is the number of people living in a unit area of the earth’s surface. It is normally expressed as per square km. The average density of population in the whole world is 51 persons per square km. South Central Asia has the highest density of population followed by East and SouthEast Asia.
Factors Affecting Distribution of Population
Here are the major factors that affect distribution of population:
Geographical Factors
Topography – People always prefer to live on plains rather than mountains and plateaus because these areas are suitable for farming, manufacturing and service activities. The Ganga plains are the most densely populated areas of the world while mountains like Andes, Alps and Himalayas are sparsely populated.
Climate – People usually avoid extreme climates that are very hot or very cold like Sahara desert, polar regions of Russia, Canada and Antarctica.
Soil – Fertile soils provide suitable land for agriculture. Fertile plains such as Ganga and Brahmaputra in India, Hwang-He, Chang Jiang in China and the Nile in Egypt are densely populated.
Water – People prefer to live in the areas where freshwater is easily available. The river valleys of the world are densely populated while deserts have a spare population.
Minerals – Areas with mineral deposits are more populated. Diamond mines of South Africa and discovery of oil in the Middle East lead to settling of people in these areas.
Social, Cultural and Economic Factors
Social – Areas of better housing, education and health facilities are more densely populated for example Pune.
Cultural – Places with religion or cultural significance attract people. Varanasi, Jerusalem and Vatican City are some examples.
Economic – Industrial areas provide employment opportunities hence a large number of people are attracted to these areas. Osaka in Japan and Mumbai in India are two densely populated areas.
Population Change
In Human Resources Class 8, the population change refers to change in the number of people during a specific time. The world population has not been stable. For an extremely long period of human history until the 1800s the world’s population grew steadily but slowly. Large numbers of babies were born but they died early too because there were no proper health facilities. Farmers were not able to produce enough to meet the food requirements of all the people. As a result the total increase in population was very low.
- In 1804 the world’s population reached one billion .
- In 1959 the world’s population reached 3 billion and this is often called population explosion.
- In 1999 40 years later the population doubled to 6 billion . The main reason for this growth was that with better food supplies and medicine, deaths were reducing while the number of births still remained fairly high.
Birth rate – Births are usually measured using the birth rate which is the number of live births per 1,000 people.
Death rate – Deaths are usually measured using the death rate which is the number of deaths per 1,000 people.
Natural growth rate – Births and deaths are the natural causes of population change and the difference between the birth rate and the death rate of a country is called the natural growth rate. The population increase in the world is mainly due to rapid increase in natural growth rate.
Migration – It is the movement of people in and out of an area. It is another way by which population size changes. People may move within a country or between countries. Emigrants are people who leave a country. Immigrants are those who arrive in a country. Countries like the USA and Australia have gained in-numbers by in-migration or immigration. Sudan is an example of a country that has experienced a loss in population numbers due to out-migration or emigration. The general trend of international migrations is from the less developed nations to the more developed nations in search of better employment opportunities. Within countries, a large number of people may move from the rural to urban areas in search of employment, education and health facilities etc.
Patterns of Population Change
Rates of population growth vary across the world. Although the world’s total population is rising rapidly not all countries are experiencing this growth. Some countries like Kenya have high population growth rates. With improving health care death rates have fallen but birth rates still remain high leading to high growth rates. In other countries like the United Kingdom population growth is slowing because of both low death and low birth rates.
Population Composition
Population has little to do with its level of economic development. For example both Bangladesh and Japan are very densely populated but Japan is far more economically developed than Bangladesh. People vary greatly in their age, sex, literacy level, health condition, occupation and income level. It is essential to understand these characteristics of the people to understand them as resources.
Population composition refers to the structure of the population. The composition of the population helps us to know how many males or females there are, which age group they belong to, how educated they are and what type of occupations they are employed in, what their income levels and health conditions are.
Population pyramid – It is a way of studying the population composition of a country is by looking at the population pyramid also called an age-sex pyramid. A population pyramid shows
- The total population is divided into various age groups, for example 5 to 9 years, 10 to 14 years.
- The percentage of the total population subdivided into males and females in each of those groups.
The shape of the population pyramid tells the story of the people living in that particular country. The numbers of children (below 15 years) are shown at the bottom and reflect the level of births. The size of the top shows the numbers of aged people (above 65 years) and reflects the number of deaths.
The population pyramid also tells us how many dependents there are in a country. There are two groups of dependents — young dependents (aged below 15 years) and elderly dependents (aged over 65 years). Those of the working age are economically active.

Types of Population Pyramids
Some examples of types of pyramids are given below –
Kenya – The population pyramid of a country in which birth and death rates both are high is broad at the base and rapidly narrows towards the top because although many children are born a large percentage of them die in their infancy, relatively few become adults and there are very few old people. This situation is typified by the pyramid shown for Kenya.
India – In countries where death rates (especially amongst the very young) are decreasing the pyramid is broad in the younger age groups because more infants survive to adulthood. This can be seen in the pyramid for India. Such populations contain a relatively large number of young people and which means a strong and expanding labor force.
Japan – In countries like Japan low birth rates make the pyramid narrow at the base and decreased death rates allow numbers of people to reach old age. Skilled, spirited and hopeful young people endowed with a positive outlook are the future of any nation.
We in India are fortunate to have such a resource. They must be educated and provided with skills and opportunities to become able and productive.
Important Questions and Answers in NCERT Class 8 Chapter 5
1. Answer the following questions.
(i) Why are people considered a resource?
Ans: People are the greatest resource of a nation. All other resources of nature become significant only when people extract their usefulness. It is people with their demands and abilities that turn them into resources. Hence, human resources is the ultimate resource.
(ii) What are the causes for the uneven distribution of population in the world?
Ans: Population distribution in the world is uneven because of two factors, Geographical and Social.
Geographical factors include
- Topography: People prefer living on plains rather than mountains and plateaus because these areas are suitable for farming, manufacturing and service activities. The Ganga Plains are the most densely populated area in the world, while mountains like the Andes, Alps and Himalayas are sparsely populated.
- Water: People prefer living in areas where fresh water is easily available. The river valleys of the world are the densely populated regions, while deserts have a smaller population.
Social factors include
- Social: Areas of better housing, education and health facilities are more densely populated. (For example, Pune)
- Economic: Industrial areas provide employment opportunities. A large number of people are attracted to these areas. Osaka in Japan and Mumbai in India are two densely populated areas.
(iii) The world population has grown very rapidly. Why?
Ans: The world population has not been stable and has increased manifold due to advancements in science and technology. Science and technology have increased food production, and development in healthcare facilities has helped in reducing the death rate.
(iv) Discuss the role of any two factors influencing population change.
Ans: Two factors influencing the change in population are the birth rate and death rate. The birth rate is the number of births per 1,000 people, and the death rate is the number of deaths per 1,000 people. Birth and death are the natural causes of population change. When the birth rate is more than the death rate, it means that the population is increasing and vice-versa. The difference between the birth rate and the death rate of a country is called the natural growth rate.
(v) What is meant by population composition?
Ans: Population composition refers to the structure of the population. The composition of the population helps us know how many are males or females, which age group they belong to, how educated they are, what type of occupations they are employed in and what their income levels and health conditions are. An interesting way of studying the population composition of a country is by looking at the population pyramid, also called an age-sex pyramid.
(vi) What are population pyramids? How do they help in understanding the population of a country?
Ans: The graphical representation used to study the composition of a country’s population is called the population pyramid. It shows the total population divided into various age groups, the percentage of the total population subdivided into males and females and the number of dependents in a country. When the population of a country has high birth and death rates, the population pyramid is broad at the base and narrow towards the top.
2. Tick the correct answer.
(i) What does the term ‘population distribution’ refer to?
- How the population in a specified area changes over time.
- The number of people who die in relation to the number of people born in a specified area.
- The way in which people are spread across a given area. Correct
(ii) Which are the three main factors that cause population change?
(a) Births, deaths and marriage
(b) Births, deaths and migration Correct
(c) Births, deaths and life expectancy
(iii) In 1999, the world population reached
(a) 1 billion
(b) 3 billion
(c) 6 billion Correct
(iv) What is a population pyramid?
(a) A graphical presentation of the age-sex composition of a population. Correct
(b) When the population density of an area is so high that people live in tall buildings.
(c) Pattern of population distribution in large urban areas.
3. Complete the sentences below using some of the following words.
(sparsely, favourable, fallow, artificial, fertile, natural, extreme, densely) When people are attracted to an area, it becomes densely populated. Factors that influence this include a favourable climate, good supplies of natural resources and fertile land .
Check out Class 6 Geography Notes:
People, the size of the population of a country along with its efficiency, educational qualities, productivity, organizational abilities and farsightedness are the greatest resources of the nation and are called human resources. All other resources of nature become significant only when people are able to extract its usefulness. It is people with their demands and abilities that turn them into resources.
The Government of India has a Ministry of Human Resource Development was created in 1985 with an aim to improve people’s skills. This just proves how important people are as a resource for the country.
Population pyramid is a way of studying the population composition of a country and it is also called an age-sex pyramid. It is explained in detail above.
Emigration is known as the movement of people from one country to another.
We hope these Human Resources Class 8 notes helped you understand the chapter better and will also help you get better marks in exams. For help with other chapters and subjects like English , Maths , Science and others for class 8 please check out the blogs by Leverage Edu . If you are planning to study abroad, book your Free Consultant Call Today!
Team Leverage Edu
Leave a Reply Cancel reply
Save my name, email, and website in this browser for the next time I comment.
Contact no. *

Leaving already?
8 Universities with higher ROI than IITs and IIMs
Grab this one-time opportunity to download this ebook
Connect With Us
30,000+ students realised their study abroad dream with us. take the first step today..

Resend OTP in

Need help with?
Study abroad.
UK, Canada, US & More
IELTS, GRE, GMAT & More
Scholarship, Loans & Forex
Country Preference
New Zealand
Which English test are you planning to take?
Which academic test are you planning to take.
Not Sure yet
When are you planning to take the exam?
Already booked my exam slot
Within 2 Months
Want to learn about the test
Which Degree do you wish to pursue?
When do you want to start studying abroad.
September 2024
January 2025
What is your budget to study abroad?

How would you describe this article ?
Please rate this article
We would like to hear more.
Question and Answer forum for K12 Students
DAV Class 8 SST Chapter 1 Notes – Resources: Utilization and Development
These DAV Class 8 SST Notes and DAV Class 8 SST Chapter 1 Notes – Resources: Utilization and Development hold significant importance as study material for students.
Resources: Utilization and Development Class 8 DAV Notes
→ All the things on the earth necessary for our existence are resources, for example, soil, minerals, vegetation, wildlife, etc.
→ Human beings are also considered as a resource because it is only with the help of human skill that the other resources can be developed.
→ Utility and value of a resource varies from time to time and place to place. Resources become usable when they are processed in several ways.
→ Utilisation of resources depends upon various factors, such as availability of resources, skill of human beings, availability of capital, advancement of technology, availability of transport and communication facilities, availability of water, etc.
→ Earlier availability of resources played a very important role. But nowadays availability of capital and skilled labour have become necessary for the utilisation of resources.
→ Renewable resources can be renewed either naturally or by human efforts. Solar energy, water and air come under this category. However, the quality of these resources can be affected by improper usage.
→ Non-renewable resources cannot be renewed. Coal, petroleum etc. come under this category. Since these resources are limited on the earth’s surface, we should be careful about their usage.
→ The biotic resources provide a variety of useful products, for example, birds, animals, fish, etc. All biotic resources are renewable.
→ All non-living resources such as land, water, etc. are abiotic resources. These are not renewable except water which is inexhaustible.
→ Resources available from nature in the form of water, minerals, forests, etc., and used by human beings are natural resources.
→ Roads, buildings, machines, etc. are man-made resources. These resources are developed from natural resources.
→ Human resources is determined by the quality and the quantity of people of a country.
→ Resources are well-developed in Japan as people are skilled and technically developed.
→ Potential resources are those whose utility is not known at present or those which are not used despite having utility. They may be useful at some time in future.
→ Actual resources are those which have been thoroughly surveyed and their quantities are ascertained.
→ Resources should be utilised judiciously so that after fulfilling our present requirements, they are also preserved for the future generations.
→ There is a necessity to maintain proper balance between population and utilization of resources. They should be used judiciously otherwise mankind will have to face dire consequences.
→ We can contribute to sustainable development by recycling things and using them again, by switching off length when not needed and in many more ways.
→ Resource: All the things on the earth which are necessary for our existence are called resources.
→ Utility: A substance has utility if it can be used in any possible way to satisfy our needs.
→ Value: Worth of a substance assessed on the basis of utility.
→ Natural resource: Resources taken from nature.
→ Human resource: A human being who can contribute to his family, society or economy is called a human resource.
→ Renewable resource: Resources that can be used without any risk of their ending up because they exist in unlimited quantity.
→ Non-renewable resource: Resources that are available in limited quantity.
→ Biotic resources: Resources, which are obtained from biosphere and have life.
→ Abiotic resource: All non-living resources.
→ Potential resource: Resources whose utility is not known at present or which are not used despite having utility; instead they may be useful at some time in future.
→ Actual resource: Resources which are used currently and whose quantity is known.
→ Resource conservation: The concept of using resources carefully so that they do not end up quickly.
→ Sustainable development: The concept of using resources in a balanced way so that our purpose is solved, as well as they are also conserved for the future generations.


UFC Fight Night: Barboza vs. Murphy
Formula 1 Monaco Grand Prix Practice 1
SportsCenter

A-League All Stars Women vs. Arsenal Women (International Friendly)
Unsportsmanlike with Evan, Canty and Michelle Presented by Progressive
WTT Contender Taiyuan - Day 2 (Night Session)
UFC 284: Makhachev vs. Volkanovski
96th clyde littlefield texas relays presented by truist, latest clips, connor mcdavid scores in 2ot as oilers defeat stars in game 1, celtics rout pacers behind jaylen brown's 40, tyler seguin's 2nd goal of the game ties it late for stars, tyrese haliburton exits vs. celtics with apparent injury, orioles hang on after controversial call to end game, celtics-pacers exchange words after boxout attempt, jayson tatum drills identical jumpers on back-to-back touches, celtics rattle off a 20-0 first-half run, zach hyman capitalizes to give the oilers 2-0 lead, leon draisaitl makes it 1-0 oilers early in second period, obi toppin goes off the glass for a pacers bucket, jaylen brown drops the hammer for a baseline jam, the fallout continues from scottie scheffler's louisville arrest, mahomes to mcafee: 'i feel like i was the matchmaker' for kelce, swift, luke littler hits sensational 9-darter in premier league final, stephen a.: ant man messed up calling out kyrie, new footage released in scottie scheffler's arrest, judge slams solo shot into yankees' bullpen, stanton sends one 445 feet to straightaway center, tempers flare between managers after stetson defeats austin peay, officer disciplined for bodycam being off in scottie scheffler incident, miami left fielder wags his finger after game-sealing catch, why greeny sensed bickerstaff and mitchell were not a good match, woody: justin fields can't afford to be a backup qb, stephen a. digs at dak for claiming he doesn't play for money, mcafee and mahomes discuss chiefs' early schedule and bye week, kentucky cf comes up with sensational home run robbery, why stephen a. pegs tatum-brown as more important duo in ecf, why lakers' coaching decision should involve relationship with lebron.

TrendyDigests
Boosting U.S. Submarine Strength: HASC's Fiscal Year 2025 Defense Policy Bill
Posted: May 23, 2024 | Last updated: May 23, 2024

The House Armed Services Committee (HASC) has demonstrated a firm commitment to bolstering U.S. submarine capabilities by approving funding for an additional Virginia-class attack submarine in the Fiscal Year (FY) 2025 defense policy bill. This decision diverges from the administration’s budget request, which initially included funding for only one such vessel.

This strategic move underscores the critical importance of enhancing both national defense capabilities and supporting the submarine industrial base. The chairman’s mark of the bill allocates an additional $1 billion for the procurement of the second Virginia-class submarine, recognizing its vital role in maintaining the Navy’s fast attack capabilities.

To facilitate this action, the seapower and projection forces subcommittee’s mark grants the Navy incremental funding authority, aiming to counteract the sporadic funding patterns that have previously strained the submarine industrial base.

The committee’s documents express concerns over the Navy’s recent decision to request one attack submarine, as opposed to its earlier commitment to buying two attack boats alongside one Columbia-class ballistic missile submarine annually.

This shift is deemed to undermine the efforts to rev up the industrial base for heightened demand, including plans under the AUKUS agreement to supply submarines to the Royal Australian Navy.

The HASC seapower panel articulated this sentiment by stating, “To renege on that commitment in just the first year after achieving the needed enabling legislation sends an inconsistent message to our allies and a talking point for our adversaries’ propaganda.”

The industrial base’s current pace of producing approximately 1.3 attack boats per year is below the Navy’s stated need to construct 2.33 attack boats plus one boomer annually, particularly in light of the requirements to support Australian needs.

Navy officials had defended their leaner request by arguing that the backlog and delays in the Virginia program necessitated a concentrated influx of funds to stabilize suppliers ahead of projected demand increases.

Despite the Navy’s proposal for a $7.3 billion allocation for the Virginia-class program, encompassing one submarine and advance procurement for future purchases, lawmakers criticized this approach during posture hearings.

Representative Joe Courtney pointed out that not all companies contributing to the submarine supply chain benefit from advanced procurement dollars; consistent procurement ensures stability across the full spectrum of suppliers.

The HASC’s push for the second submarine has garnered broad legislative support, as evidenced by a letter penned by 120 House lawmakers to the House Appropriations defense subcommittee, advocating for the appropriation of funds for two Virginia-class submarines in FY 2025.

This underscores the bipartisan understanding of the strategic and economic imperatives tied to the submarine program.

The chairman’s mark also reflects a strategic reallocation of resources, as it cuts $1.17 billion from the Navy’s request for a Constellation-class frigate due to delays in the program. This rebalancing act underlines the HASC’s prioritization of assets deemed more immediately critical to national defense.

On the broader naval shipbuilding agenda, the mark generally aligns with the Navy’s aspirations, authorizing funds for two Arleigh Burke-class destroyers, one San Antonio-class amphibious transport dock, and one Medium Landing Ship. The total authorized shipbuilding budget of $31.6 billion is a slight reduction from the Navy’s $32.4 billion request, with additional provisions for advanced procurement funding for future aircraft carriers.

The NDAA, constrained by the $895 billion spending limit set by the Fiscal Responsibility Act, will be subject to further scrutiny and possible amendments during the HASC markup session.
Relevant articles: – HASC Chairman’s Mark Authorizes Second Virginia-class Submarine, Cuts $1B from Delayed Frigate Program , USNI, 05/14/2024 – 35s in $849.8 billion draft defense policy bill , Breaking Defense, 05/13/2024
More for You
16 Car Brands With Notoriously High Maintenance Costs—and 3 With the Lowest
Alan Hale Jr: 16 Facts About the Skipper from 'Gilligan's Island'
12 Baby Boomer Fads That Were Actually Dangerous
Glen Powell says Tom Cruise delaying Top Gun: Maverick for two years nearly left him broke
Is It Better to Take Social Security at Age 62 or 67? It Depends On These 3 Factors
Taylor Swift Had a Technical Malfunction While Performing Her Surprise Set on the ‘Eras’ Tour in Stockholm
Donald Trump Bronx Rally Sparks Fight Between Organizers
Kyrie Irving responds to Anthony Edwards' trash-talking after dominating him in Game 1
Asher HaVon Won 'The Voice' Season 25 and Nathan Chester Fans Have a Lot to Say
John Goodman: Anti-glamour 'Roseanne,' 'Conners' will be remembered for love, laughs
Millennials are 'quiet vacationing' rather than asking their boss for PTO: 'There's a giant workaround culture'
The Best Local Ice Cream Shop in Every State
“There’s nothing other than horses and cowboy hats”: Marvel Star Josh Brolin Disagrees That His Show is ‘Piggybacking’ on Taylor Sheridan’s Yellowstone
Fani Willis' New Move in Trump Case
Dwyane Wade Is 'So Damn Proud' of Daughter Zaya, 16, as They Launch a New Safe Space for Trans Youth (Exclusive)
10 Best Manhwa Power Systems, Ranked
I supercommute through 4 states to get to work. I love earning a 6-figure NYC salary but living a suburban life in Delaware.
The Only Major Actors Still Alive From All In The Family
“Don’t do it. It’s not worth it at all”: Don’t Expect Matt Damon to Go Shirtless in the Next Bourne Movie After Actor Regretted Returning to the Franchise
'Fighting for our lives': Tesla driver in LA says his car 'dies every day' and he's 'over it' — why the current state of EVs is pushing consumers over the edge
- NCERT Solutions
- NCERT Class 8
- NCERT Solutions for Class 8 Social Science
- Class 8 Geography
- Chapter 6 Human Resources
NCERT Solutions for Class 8 Geography Social Science Chapter 6 Human Resources
Ncert solutions class 8 geography chapter 6 human resources – download free pdf.
* According to the CBSE Syllabus 2023-24, this chapter has been renumbered as Chapter 5.
NCERT Solutions for Class 8 Geography Chapter 6 – Human Resources are provided here for students to study and excel in their board exams. The term human resources refers to the size of the population of a country along with its efficiency, educational qualities, productivity, organisational abilities and farsightedness. It is the ultimate resource, but not equally distributed over the world. NCERT Solutions for Class 8 Geography Chapter 6 – Human Resources discusses the solutions to the exercises given in the Geography book – Resources and Development .
Human Resources differ in their educational levels, age and sex. Their numbers and characteristics also keep changing. Chapter 6 of CBSE Class 8 Geography deals with this topic and related concepts. NCERT Solutions to these exercises are easy and accurate, helping school students align their preparation with the questions asked in the examinations. Experts, keeping in mind the understanding abilities of the students, have formulated the NCERT Solutions . Students can download the solutions PDF from the links given.
- Chapter 1 Resources
- Chapter 2 Land Soil Water Natural Vegetation and Wildlife Resources
- Chapter 3 Mineral and Power Resources
- Chapter 4 Agriculture
- Chapter 5 Industries
Students can download the NCERT Solutions for Class 8 Geography PDF below.
carouselExampleControls112

Previous Next
NCERT Solutions for Class 8 Geography (Resources and Development) Chapter 6 Human Resources
1. Answer the following questions.
(i) Why are people considered a resource?
Answer: People are the greatest resource of a nation. All other resources of nature become significant only when people extract their usefulness. It is people with their demands and abilities that turn them into resources. Hence, human resource is the ultimate resource.
(ii) What are the causes for the uneven distribution of population in the world?
Answer: Population distribution in the world is uneven because of two factors, Geographical and Social.
Geographical factors include
- Topography: People prefer living on plains rather than mountains and plateaus because these areas are suitable for farming, manufacturing and service activities. The Ganga Plains are the most densely populated area in the world, while mountains like the Andes, Alps and Himalayas are sparsely populated.
- Water: People prefer living in areas where fresh water is easily available. The river valleys of the world are the densely populated regions, while deserts have a less population.
Social factors include
- Social: Areas of better housing, education and health facilities are more densely populated. (For example, Pune)
- Economic: Industrial areas provide employment opportunities. A large number of people are attracted to these areas. Osaka in Japan and Mumbai in India are two densely populated areas.
(iii) The world population has grown very rapidly. Why?
Answer: The world population has not been stable and has increased manifold due to advancements in science and technology. Science and technology have increased food production, and development in healthcare facilities has helped in reducing the death rate.
(iv) Discuss the role of any two factors influencing population change.
Answer: Two factors influencing the change in population are the birth rate and death rate. The birth rate is the number of births per 1,000 people, and the death rate is the number of deaths per 1,000 people. Birth and death are the natural causes of population change. When the birth rate is more than the death rate, it means that the population is increasing and vice-versa. The difference between the birth rate and the death rate of a country is called the natural growth rate.
(v) What is meant by population composition?
Answer: Population composition refers to the structure of the population. The composition of the population helps us know how many are males or females, which age group they belong to, how educated they are, what type of occupations they are employed in and what their income levels and health conditions are. An interesting way of studying the population composition of a country is by looking at the population pyramid, also called an age-sex pyramid.
(vi) What are population pyramids? How do they help in understanding the population of a country?
Answer: The graphical representation used to study the composition of a country’s population is called the population pyramid. It shows the total population divided into various age groups, the percentage of the total population subdivided into males and females and the number of dependents in a country. When the population of a country has high birth and death rates, the population pyramid is broad at the base and narrow towards the top.
2. Tick the correct answer.
(i) What does the term ‘population distribution’ refer to?
- How the population in a specified area changes over time.
- The number of people who die in relation to the number of people born in a specified area.
- The way in which people are spread across a given area.
Answer (c) The way in which people are spread across a given area
(ii) Which are the three main factors that cause population change?
(a) Births, deaths and marriage
(b) Births, deaths and migration
(c) Births, deaths and life expectancy
Answer (b) Births, deaths and migration.
(iii) In 1999, the world population reached
(a) 1 billion
(b) 3 billion
(c) 6 billion
Answer (c) 6 billion
(iv) What is a population pyramid?
(a) A graphical presentation of the age-sex composition of a population.
(b) When the population density of an area is so high that people live in tall buildings.
(c) Pattern of population distribution in large urban areas.
Answer (a) A graphical presentation of the age-sex composition of a population
3. Complete the sentences below using some of the following words.
(sparsely, favourable, fallow, artificial, fertile, natural, extreme, densely)
When people are attracted to an area, it becomes ………………….. populated. Factors that influence this include ………………….. climate, good supplies of ………………….. resources and ………………….. land.
Answer: When people are attracted to an area, it becomes densely populated. Factors that influence this include favourable climate, good supplies of natural resources and fertile land.
Chapter 6 – Human Resources Summary
People, i.e., humans, are a nation’s greatest resource; it is one of the building blocks for a nation’s development. It is humans, with their skills and abilities, that can transform and extract or add value to other resources. Hence, human resources are the ultimate resource.
Like other resources, human resources are not equally distributed over the world. The more population a country has, the more it is considered to be rich in human resources.
Distribution of Population refers to the way in which people are spread across the earth’s surface.
The population distribution in the world is extremely uneven. Some areas are sparsely populated, while others are densely populated because of the various factors affecting the distribution of the population.
Population density refers to the number of people living in a unit area of the earth’s surface.
The density of India is 382 persons per sq km, which is one of the highest in the world.
You will also learn about the following:
- Factors Affecting the Distribution of Population, such as climate, soil, minerals, topography, water and other social, economic and cultural factors.
- Population Change and reasons for changes in population.
- Natural growth rate, birth rate, death rate and life expectancy.
- The pattern of Population Change.
- Population compositions and population pyramid.
‘Resources and Development’ is an important book for Class 8 Social Science subject. Apart from this chapter, the full set of NCERT Solutions for Class 8 Social Science is provided in the links. If students aim to score well in the exams, they must practise the solutions with utmost sincerity. They can download the NCERT Solutions for Class 8 Geography PDF from the given links.
Frequently Asked Questions on NCERT Solutions for Class 8 Geography Chapter 6
What are the causes for the uneven distribution of population in the world mentioned in chapter 6 of ncert solutions for class 8 geography, explain why the world population has grown rapidly, as discussed in chapter 6 of ncert solutions for class 8 geography., what will i learn in chapter 6 of ncert solutions for class 8 geography, leave a comment cancel reply.
Your Mobile number and Email id will not be published. Required fields are marked *
Request OTP on Voice Call
Post My Comment
Byju’s is the best
this is good link for student and me thanks
Byjus is the best
Register with BYJU'S & Download Free PDFs
Register with byju's & watch live videos.
Please enter your information to subscribe to the Microsoft Fabric Blog.
Microsoft fabric updates blog.
Microsoft Fabric May 2024 Update
- Monthly Update
Welcome to the May 2024 update.
Here are a few, select highlights of the many we have for Fabric. You can now ask Copilot questions about data in your model, Model Explorer and authoring calculation groups in Power BI desktop is now generally available, and Real-Time Intelligence provides a complete end-to-end solution for ingesting, processing, analyzing, visualizing, monitoring, and acting on events.
There is much more to explore, please continue to read on.
Microsoft Build Announcements
At Microsoft Build 2024, we are thrilled to announce a huge array of innovations coming to the Microsoft Fabric platform that will make Microsoft Fabric’s capabilities even more robust and even customizable to meet the unique needs of each organization. To learn more about these changes, read the “ Unlock real-time insights with AI-powered analytics in Microsoft Fabric ” announcement blog by Arun Ulag.
Fabric Roadmap Update
Last October at the Microsoft Power Platform Community Conference we announced the release of the Microsoft Fabric Roadmap . Today we have updated that roadmap to include the next semester of Fabric innovations. As promised, we have merged Power BI into this roadmap to give you a single, unified road map for all of Microsoft Fabric. You can find the Fabric Roadmap at https://aka.ms/FabricRoadmap .
We will be innovating our Roadmap over the coming year and would love to hear your recommendation ways that we can make this experience better for you. Please submit suggestions at https://aka.ms/FabricIdeas .
Earn a discount on your Microsoft Fabric certification exam!
We’d like to thank the thousands of you who completed the Fabric AI Skills Challenge and earned a free voucher for Exam DP-600 which leads to the Fabric Analytics Engineer Associate certification.
If you earned a free voucher, you can find redemption instructions in your email. We recommend that you schedule your exam now, before your discount voucher expires on June 24 th . All exams must be scheduled and completed by this date.
If you need a little more help with exam prep, visit the Fabric Career Hub which has expert-led training, exam crams, practice tests and more.
Missed the Fabric AI Skills Challenge? We have you covered. For a limited time , you could earn a 50% exam discount by taking the Fabric 30 Days to Learn It Challenge .
Modern Tooltip now on by Default
Matrix layouts, line updates, on-object interaction updates, publish to folders in public preview, you can now ask copilot questions about data in your model (preview), announcing general availability of dax query view, copilot to write and explain dax queries in dax query view public preview updates, new manage relationships dialog, refreshing calculated columns and calculated tables referencing directquery sources with single sign-on, announcing general availability of model explorer and authoring calculation groups in power bi desktop, microsoft entra id sso support for oracle database, certified connector updates, view reports in onedrive and sharepoint with live connected semantic models, storytelling in powerpoint – image mode in the power bi add-in for powerpoint, storytelling in powerpoint – data updated notification, git integration support for direct lake semantic models.
- Editor’s pick of the quarter
- New visuals in AppSource
- Financial Reporting Matrix by Profitbase
- Horizon Chart by Powerviz
Milestone Trend Analysis Chart by Nova Silva
- Sunburst Chart by Powerviz
- Stacked Bar Chart with Line by JTA
Fabric Automation
Streamlining fabric admin apis, microsoft fabric workload development kit, external data sharing, apis for onelake data access roles, shortcuts to on-premises and network-restricted data, copilot for data warehouse.
- Unlocking Insights through Time: Time travel in Data warehouse
Copy Into enhancements
Faster workspace resource assignment powered by just in time database attachment, runtime 1.3 (apache spark 3.5, delta lake 3.1, r 4.3.3, python 3.11) – public preview, native execution engine for fabric runtime 1.2 (apache spark 3.4) – public preview , spark run series analysis, comment @tagging in notebook, notebook ribbon upgrade, notebook metadata update notification, environment is ga now, rest api support for workspace data engineering/science settings, fabric user data functions (private preview), introducing api for graphql in microsoft fabric (preview), copilot will be enabled by default, the ai and copilot setting will be automatically delegated to capacity admins, abuse monitoring no longer stores your data, real-time hub, source from real-time hub in enhanced eventstream, use real-time hub to get data in kql database in eventhouse, get data from real-time hub within reflexes, eventstream edit and live modes, default and derived streams, route streams based on content in enhanced eventstream, eventhouse is now generally available, eventhouse onelake availability is now generally available, create a database shortcut to another kql database, support for ai anomaly detector, copilot for real-time intelligence, eventhouse tenant level private endpoint support, visualize data with real-time dashboards, new experience for data exploration, create triggers from real-time hub, set alert on real-time dashboards, taking action through fabric items, general availability of the power query sdk for vs code, refresh the refresh history dialog, introducing data workflows in data factory, introducing trusted workspace access in fabric data pipelines.
- Introducing Blob Storage Event Triggers for Data Pipelines
- Parent/child pipeline pattern monitoring improvements
Fabric Spark job definition activity now available
Hd insight activity now available, modern get data experience in data pipeline.
Power BI tooltips are embarking on an evolution to enhance their functionality. To lay the groundwork, we are introducing the modern tooltip as the new default , a feature that many users may already recognize from its previous preview status. This change is more than just an upgrade; it’s the first step in a series of remarkable improvements. These future developments promise to revolutionize tooltip management and customization, offering possibilities that were previously only imaginable. As we prepare for the general availability of the modern tooltip, this is an excellent opportunity for users to become familiar with its features and capabilities.
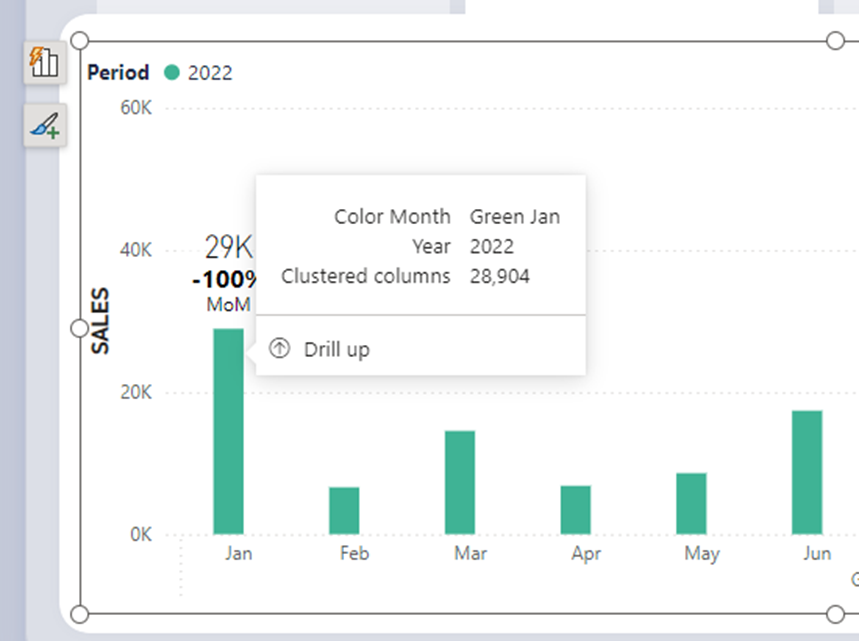
Discover the full potential of the new tooltip feature by visiting our dedicated blog . Dive into the details and explore the comprehensive vision we’ve crafted for tooltips, designed to enhance your Power BI experience.
We’ve listened to our community’s feedback on improving our tabular visuals (Table and Matrix), and we’re excited to initiate their transformation. Drawing inspiration from the familiar PivotTable in Excel , we aim to build new features and capabilities upon a stronger foundation. In our May update, we’re introducing ‘ Layouts for Matrix .’ Now, you can select from compact , outline , or tabular layouts to alter the arrangement of components in a manner akin to Excel.
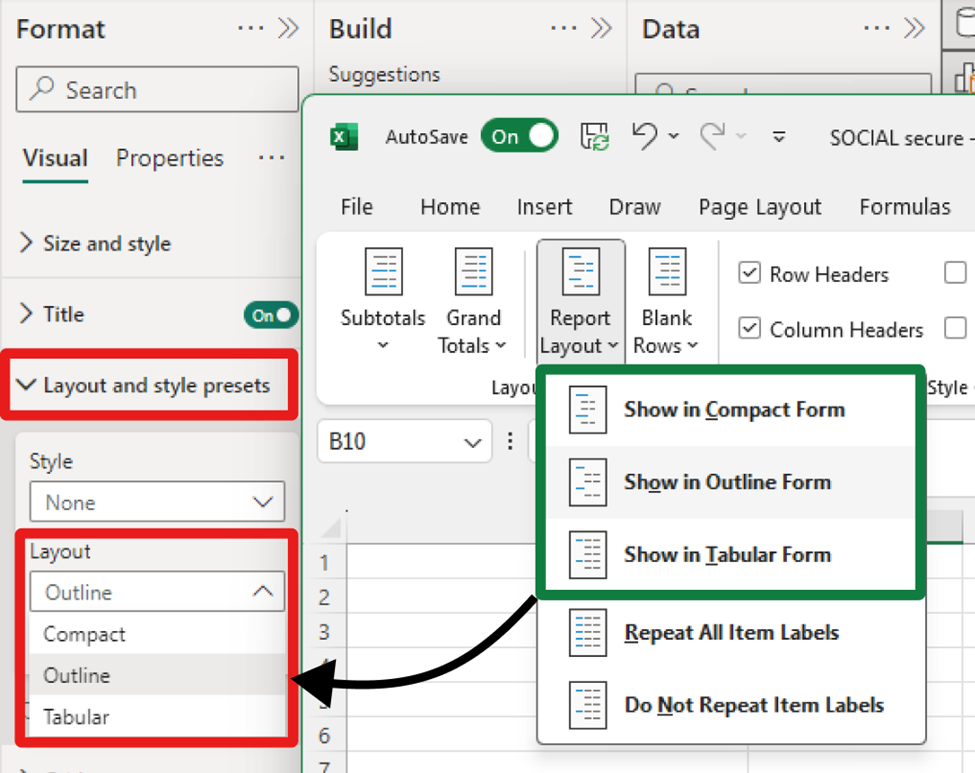
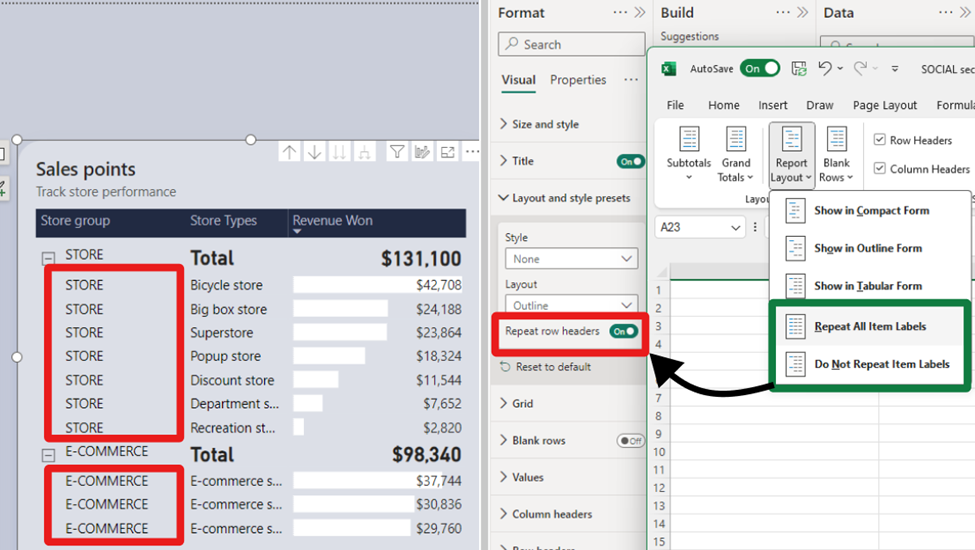
As an extension of the new layout options, report creators can now craft custom layout patterns by repeating row headers. This powerful control, inspired by Excel’s PivotTable layout, enables the creation of a matrix that closely resembles the look and feel of a table. This enhancement not only provides greater flexibility but also brings a touch of Excel’s intuitive design to Power BI’s matrix visuals. Only available for Outline and Tabular layouts.
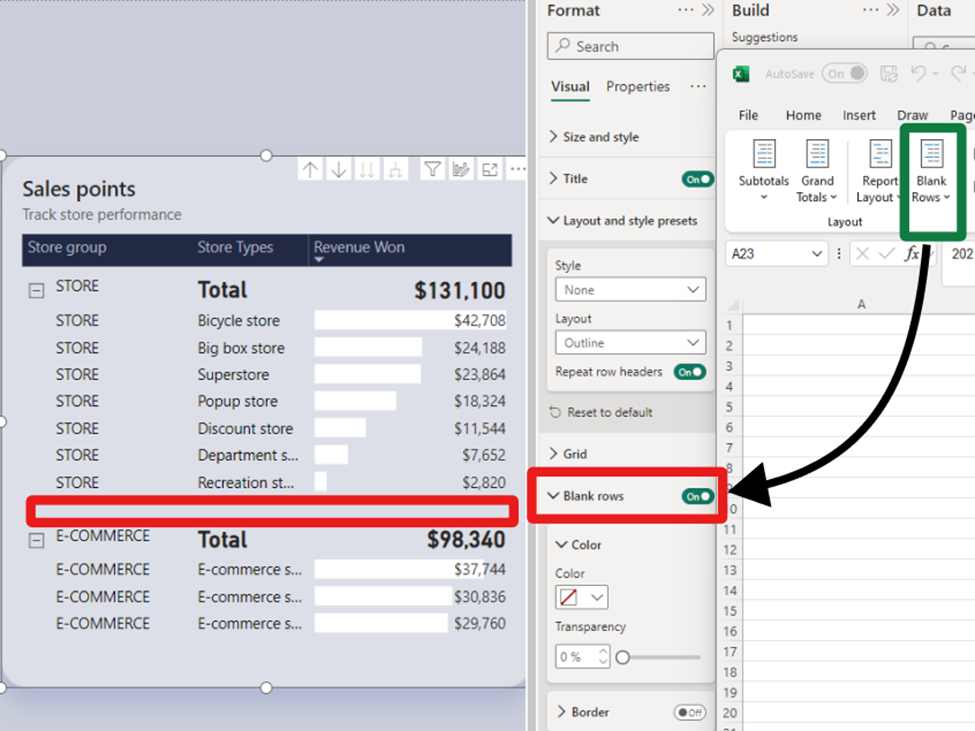
To further align with Excel’s functionality, report creators now have the option to insert blank rows within the matrix. This feature allows for the separation of higher-level row header categories, significantly enhancing the readability of the report. It’s a thoughtful addition that brings a new level of clarity and organization to Power BI’s matrix visuals and opens a path for future enhancements for totals/subtotals and rows/column headers.
We understand your eagerness to delve deeper into the matrix layouts and grasp how these enhancements fulfill the highly requested features by our community. Find out more and join the conversation in our dedicated blog , where we unravel the details and share the community-driven vision behind these improvements.
Following last month’s introduction of the initial line enhancements, May brings a groundbreaking set of line capabilities that are set to transform your Power BI experience:
- Hide/Show lines : Gain control over the visibility of your lines for a cleaner, more focused report.
- Customized line pattern : Tailor the pattern of your lines to match the style and context of your data.
- Auto-scaled line pattern : Ensure your line patterns scale perfectly with your data, maintaining consistency and clarity.
- Line dash cap : Customize the end caps of your customized dashed lines for a polished, professional look.
- Line upgrades across other line types : Experience improvements in reference lines, forecast lines, leader lines, small multiple gridlines, and the new card’s divider line.
These enhancements are not to be missed. We recommend visiting our dedicated blog for an in-depth exploration of all the new capabilities added to lines, keeping you informed and up to date.
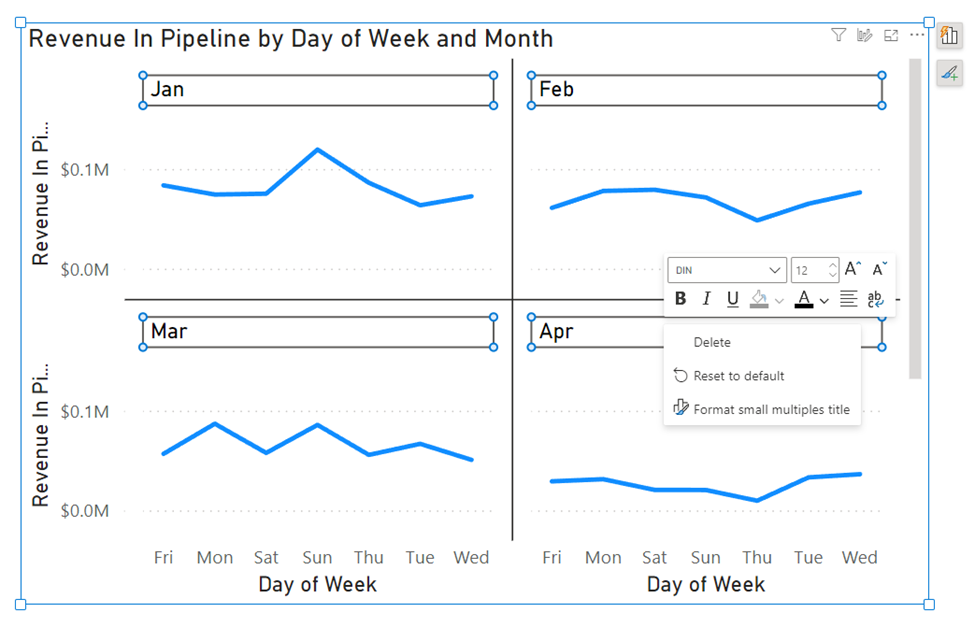
This May release, we’re excited to introduce on-object formatting support for Small multiples , Waterfall , and Matrix visuals. This new feature allows users to interact directly with these visuals for a more intuitive and efficient formatting experience. By double-clicking on any of these visuals, users can now right-click on the specific visual component they wish to format, bringing up a convenient mini-toolbar. This streamlined approach not only saves time but also enhances the user’s ability to customize and refine their reports with ease.
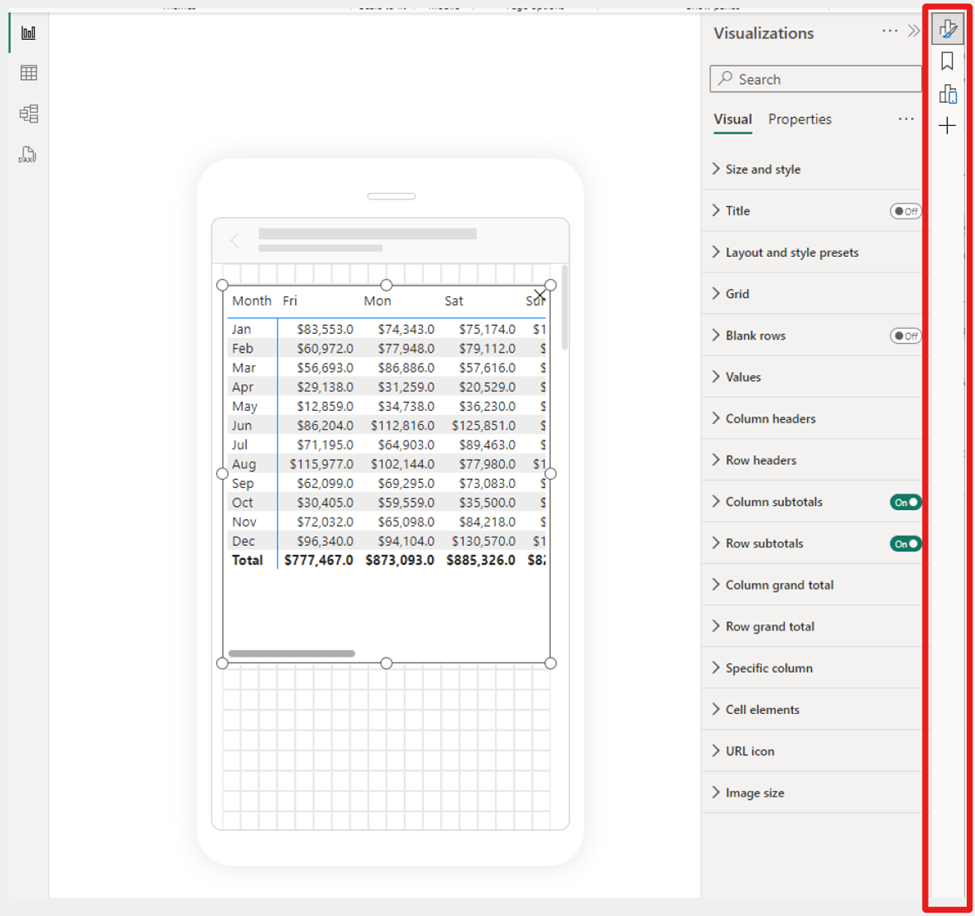
We’re also thrilled to announce a significant enhancement to the mobile reporting experience with the introduction of the pane manager for the mobile layout view. This innovative feature empowers users to effortlessly open and close panels via a dedicated menu, streamlining the design process of mobile reports.
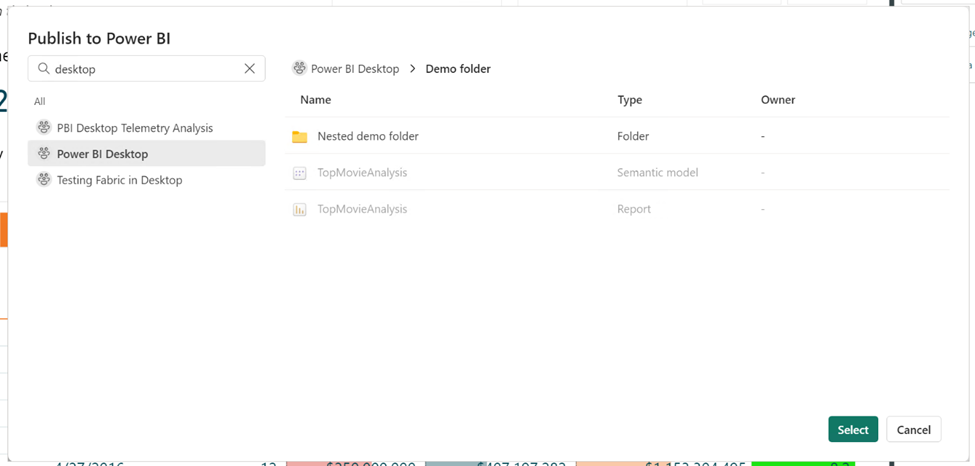
We recently announced a public preview for folders in workspaces, allowing you to create a hierarchical structure for organizing and managing your items. In the latest Desktop release, you can now publish your reports to specific folders in your workspace.
When you publish a report, you can choose the specific workspace and folder for your report. The interface is simplistic and easy to understand, making organizing your Power BI content from Desktop better than ever.
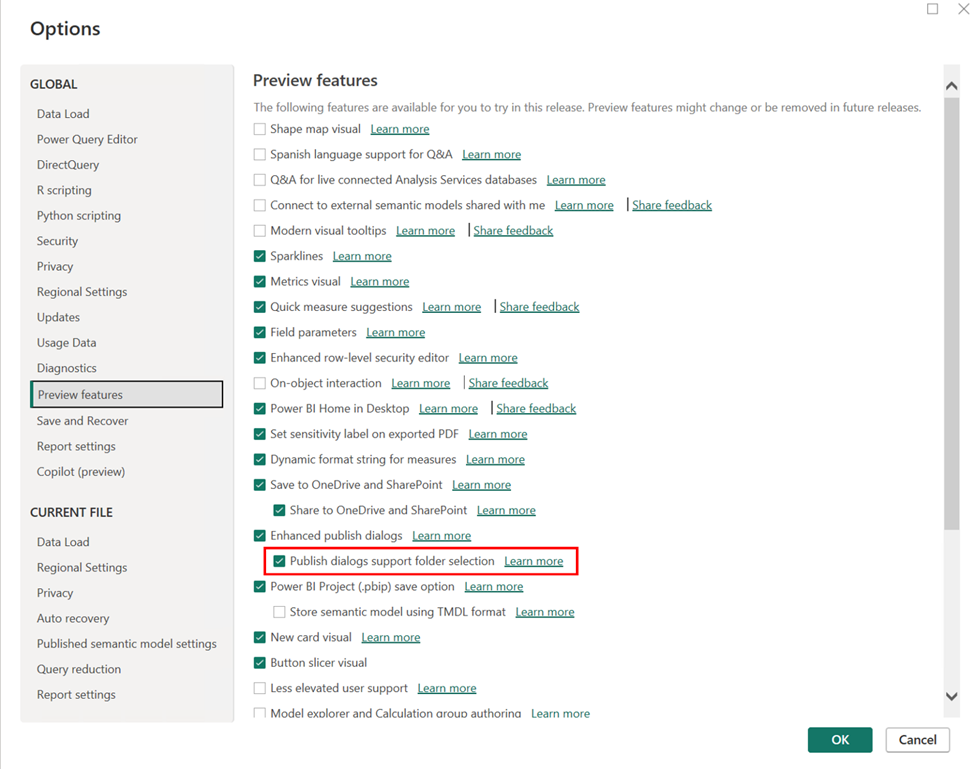
To publish reports to specific folders in the service, make sure the “Publish dialogs support folder selection” setting is enabled in the Preview features tab in the Options menu.
Learn more about folders in workspaces.
We’re excited to preview a new capability for Power BI Copilot allowing you to ask questions about the data in your model! You could already ask questions about the data present in the visuals on your report pages – and now you can go deeper by getting answers directly from the underlying model. Just ask questions about your data, and if the answer isn’t already on your report, Copilot will then query your model for the data instead and return the answer to your question in the form of a visual!
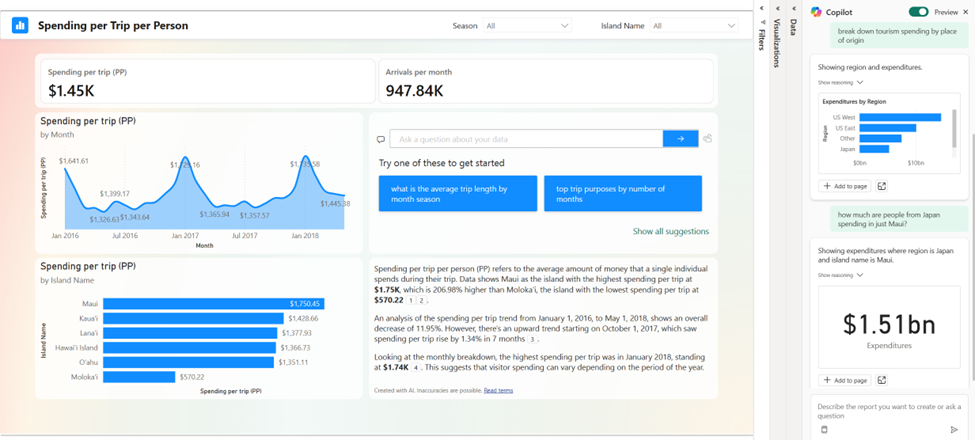
We’re starting this capability off in both Edit and View modes in Power BI Service. Because this is a preview feature, you’ll need to enable it via the preview toggle in the Copilot pane. You can learn more about all the details of the feature in our announcement post here! (will link to announcement post)
We are excited to announce the general availability of DAX query view. DAX query view is the fourth view in Power BI Desktop to run DAX queries on your semantic model.
DAX query view comes with several ways to help you be as productive as possible with DAX queries.
- Quick queries. Have the DAX query written for you from the context menu of tables, columns, or measures in the Data pane of DAX query view. Get the top 100 rows of a table, statistics of a column, or DAX formula of a measure to edit and validate in just a couple clicks!
- DirectQuery model authors can also use DAX query view. View the data in your tables whenever you want!
- Create and edit measures. Edit one or multiple measures at once. Make changes and see the change in action in a DA query. Then update the model when you are ready. All in DAX query view!
- See the DAX query of visuals. Investigate the visuals DAX query in DAX query view. Go to the Performance Analyzer pane and choose “Run in DAX query view”.
- Write DAX queries. You can create DAX queries with Intellisense, formatting, commenting/uncommenting, and syntax highlighting. And additional professional code editing experiences such as “Change all occurrences” and block folding to expand and collapse sections. Even expanded find and replace options with regex.
Learn more about DAX query view with these resources:
- Deep dive blog: https://powerbi.microsoft.com/blog/deep-dive-into-dax-query-view-and-writing-dax-queries/
- Learn more: https://learn.microsoft.com/power-bi/transform-model/dax-query-view
- Video: https://youtu.be/oPGGYLKhTOA?si=YKUp1j8GoHHsqdZo
DAX query view includes an inline Fabric Copilot to write and explain DAX queries, which remains in public preview. This month we have made the following updates.
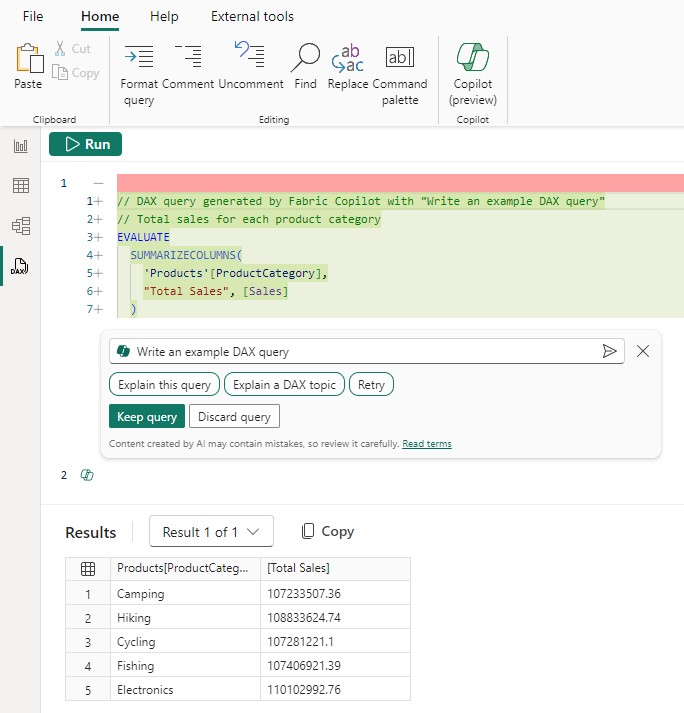
- Run the DAX query before you keep it . Previously the Run button was disabled until the generated DAX query was accepted or Copilot was closed. Now you can Run the DAX query then decide to Keep or Discard the DAX query.
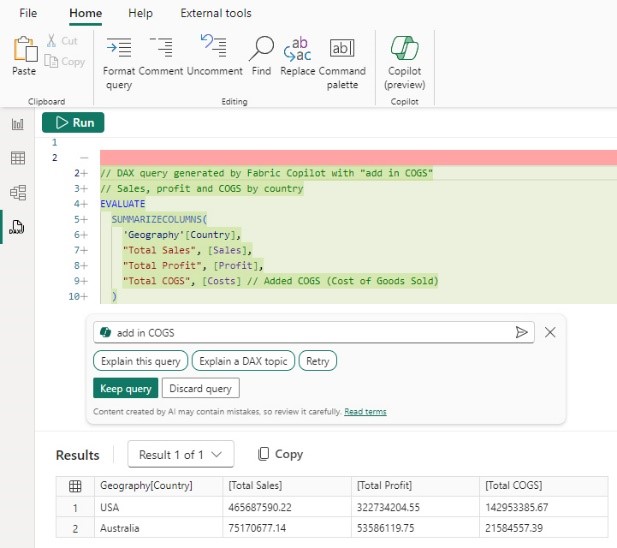
2. Conversationally build the DAX query. Previously the DAX query generated was not considered if you typed additional prompts and you had to keep the DAX query, select it again, then use Copilot again to adjust. Now you can simply adjust by typing in additional user prompts.
3. Syntax checks on the generated DAX query. Previously there was no syntax check before the generated DAX query was returned. Now the syntax is checked, and the prompt automatically retried once. If the retry is also invalid, the generated DAX query is returned with a note that there is an issue, giving you the option to rephrase your request or fix the generated DAX query.

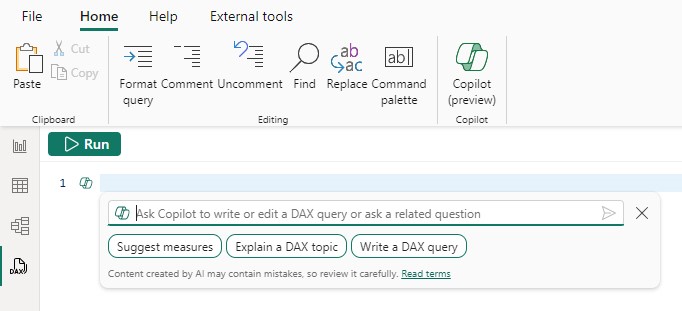
4. Inspire buttons to get you started with Copilot. Previously nothing happened until a prompt was entered. Now click any of these buttons to quickly see what you can do with Copilot!
Learn more about DAX queries with Copilot with these resources:
- Deep dive blog: https://powerbi.microsoft.com/en-us/blog/deep-dive-into-dax-query-view-with-copilot/
- Learn more: https://learn.microsoft.com/en-us/dax/dax-copilot
- Video: https://www.youtube.com/watch?v=0kE3TE34oLM
We are excited to introduce you to the redesigned ‘Manage relationships’ dialog in Power BI Desktop! To open this dialog simply select the ‘Manage relationships’ button in the modeling ribbon.

Once opened, you’ll find a comprehensive view of all your relationships, along with their key properties, all in one convenient location. From here you can create new relationships or edit an existing one.
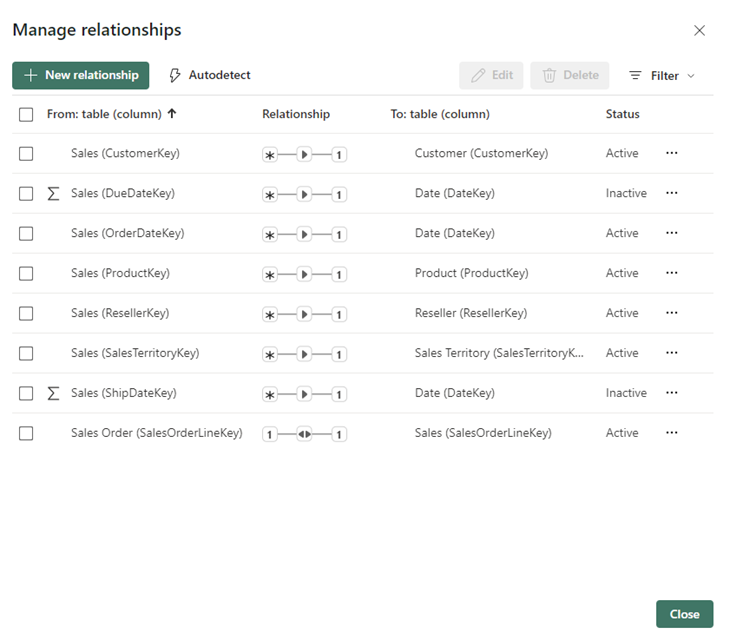
Additionally, you have the option to filter and focus on specific relationships in your model based on cardinality and cross filter direction.
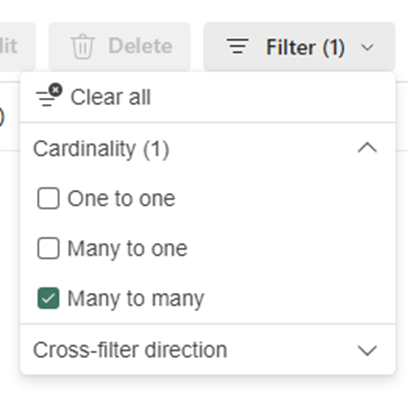
Learn more about creating and managing relationships in Power BI Desktop in our documentation .
Ever since we released composite models on Power BI semantic models and Analysis Services , you have been asking us to support the refresh of calculated columns and tables in the Service. This month, we have enabled the refresh of calculated columns and tables in Service for any DirectQuery source that uses single sign-on authentication. This includes the sources you use when working with composite models on Power BI semantic models and Analysis Services.
Previously, the refresh of a semantic model that uses a DirectQuery source with single-sign-on authentication failed with one of the following error messages: “Refresh is not supported for datasets with a calculated table or calculated column that depends on a table which references Analysis Services using DirectQuery.” or “Refresh over a dataset with a calculated table or a calculated column which references a Direct Query data source is not supported.”
Starting today, you can successfully refresh the calculated table and calculated columns in a semantic model in the Service using specific credentials as long as:
- You used a shareable cloud connection and assigned it and/or.
- Enabled granular access control for all data connection types.
Here’s how to do this:
- Create and publish your semantic model that uses a single sign-on DirectQuery source. This can be a composite model but doesn’t have to be.
- In the semantic model settings, under Gateway and cloud connections , map each single sign-on DirectQuery connection to a specific connection. If you don’t have a specific connection yet, select ‘Create a connection’ to create it:
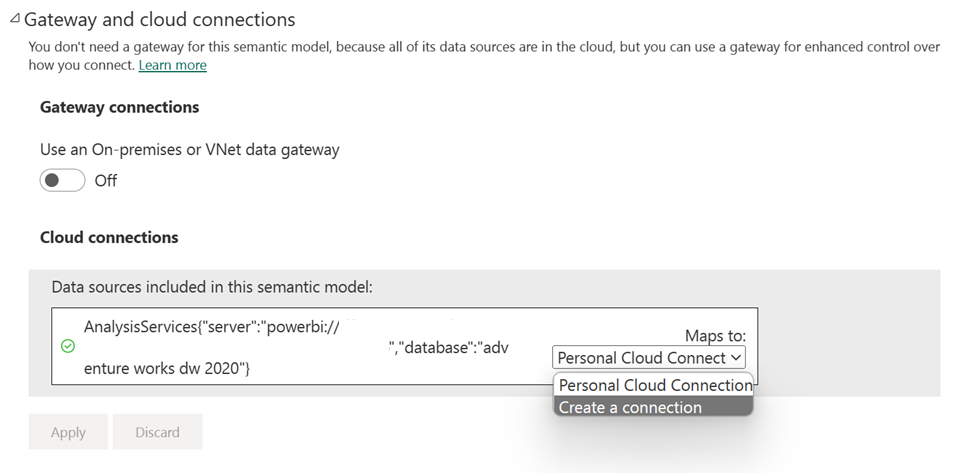
- If you are creating a new connection, fill out the connection details and click Create , making sure to select ‘Use SSO via Azure AD for DirectQuery queries:
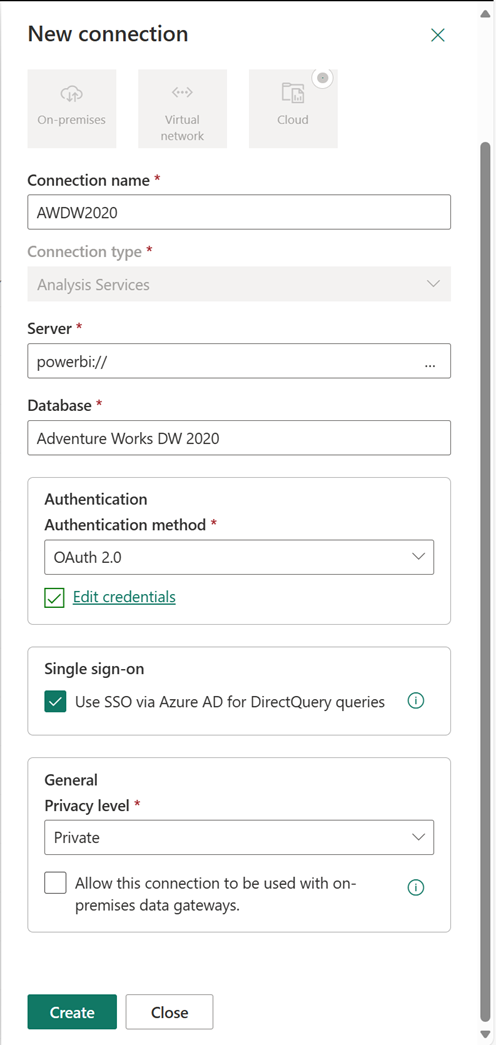
- Finally, select the connection for each single sign-on DirectQuery source and select Apply :

2. Either refresh the semantic model manually or plan a scheduled refresh to confirm the refresh now works successfully. Congratulations, you have successfully set up refresh for semantic models with a single sign-on DirectQuery connection that uses calculated columns or calculated tables!
We are excited to announce the general availability of Model Explorer in the Model view of Power BI, including the authoring of calculation groups. Semantic modeling is even easier with an at-a-glance tree view with item counts, search, and in context paths to edit the semantic model items with Model Explorer. Top level semantic model properties are also available as well as the option to quickly create relationships in the properties pane. Additionally, the styling for the Data pane is updated to Fluent UI also used in Office and Teams.
A popular community request from the Ideas forum, authoring calculation groups is also included in Model Explorer. Calculation groups significantly reduce the number of redundant measures by allowing you to define DAX formulas as calculation items that can be applied to existing measures. For example, define a year over year, prior month, conversion, or whatever your report needs in DAX formula once as a calculation item and reuse it with existing measures. This can reduce the number of measures you need to create and make the maintenance of the business logic simpler.
Available in both Power BI Desktop and when editing a semantic model in the workspace, take your semantic model authoring to the next level today!
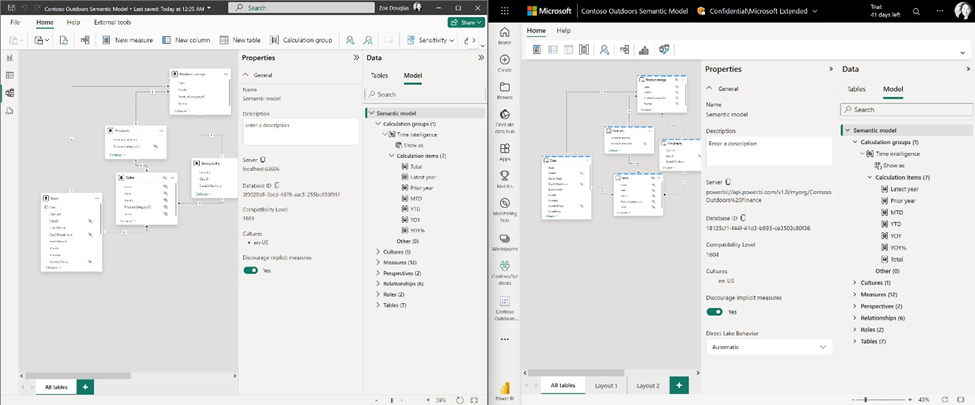
Learn more about Model Explorer and authoring calculation groups with these resources:
- Use Model explorer in Power BI (preview) – Power BI | Microsoft Learn
- Create calculation groups in Power BI (preview) – Power BI | Microsoft Learn
Data connectivity
We’re happy to announce that the Oracle database connector has been enhanced this month with the addition of Single Sign-On support in the Power BI service with Microsoft Entra ID authentication.
Microsoft Entra ID SSO enables single sign-on to access data sources that rely on Microsoft Entra ID based authentication. When you configure Microsoft Entra SSO for an applicable data source, queries run under the Microsoft Entra identity of the user that interacts with the Power BI report.
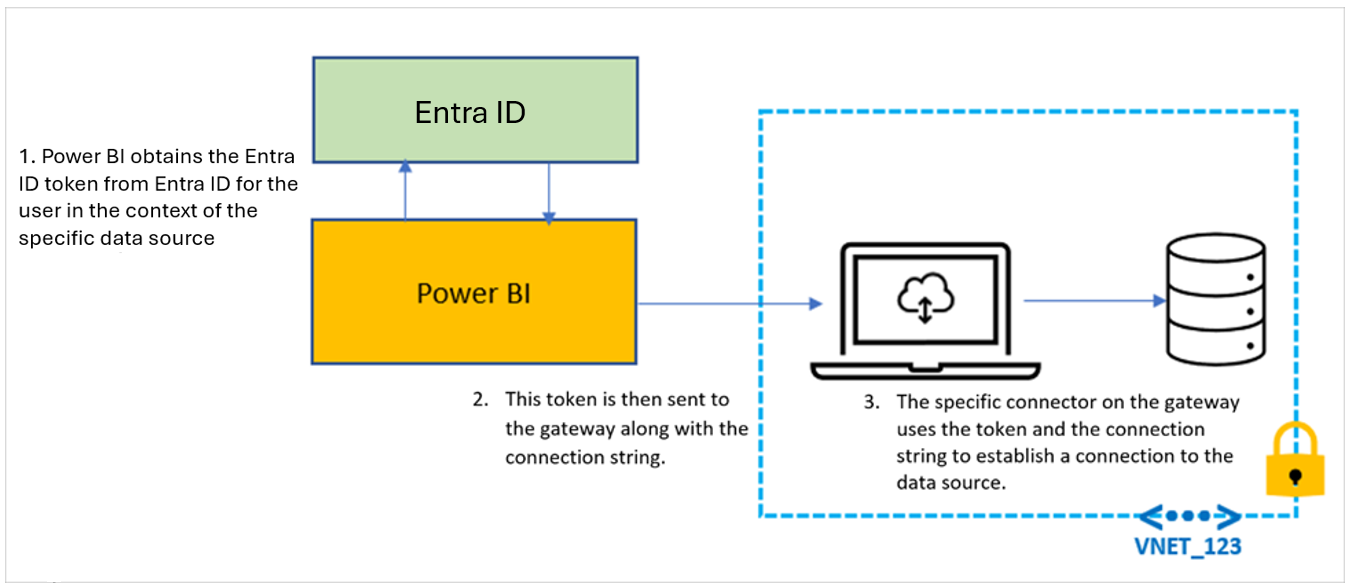
We’re pleased to announce the new and updated connectors in this release:
- [New] OneStream : The OneStream Power BI Connector enables you to seamlessly connect Power BI to your OneStream applications by simply logging in with your OneStream credentials. The connector uses your OneStream security, allowing you to access only the data you have based on your permissions within the OneStream application. Use the connector to pull cube and relational data along with metadata members, including all their properties. Visit OneStream Power BI Connector to learn more. Find this connector in the other category.
- [New] Zendesk Data : A new connector developed by the Zendesk team that aims to go beyond the functionality of the existing Zendesk legacy connector created by Microsoft. Learn more about what this new connector brings.
- [New] CCH Tagetik
- [Update] Azure Databricks
Are you interested in creating your own connector and publishing it for your customers? Learn more about the Power Query SDK and the Connector Certification program .
Last May, we announced the integration between Power BI and OneDrive and SharePoint. Previously, this capability was limited to only reports with data in import mode. We’re excited to announce that you can now seamlessly view Power BI reports with live connected data directly in OneDrive and SharePoint!
When working on Power BI Desktop with a report live connected to a semantic model in the service, you can easily share a link to collaborate with others on your team and allow them to quickly view the report in their browser. We’ve made it easier than ever to access the latest data updates without ever leaving your familiar OneDrive and SharePoint environments. This integration streamlines your workflows and allows you to access reports within the platforms you already use. With collaboration at the heart of this improvement, teams can work together more effectively to make informed decisions by leveraging live connected semantic models without being limited to data only in import mode.
Utilizing OneDrive and SharePoint allows you to take advantage of built-in version control, always have your files available in the cloud, and utilize familiar and simplistic sharing.
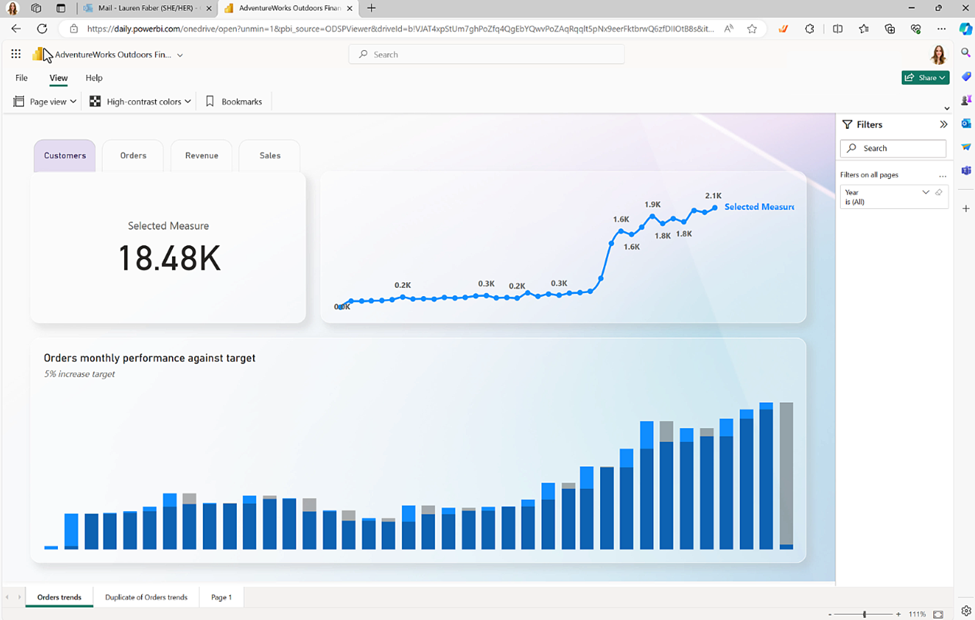
While you told us that you appreciate the ability to limit the image view to only those who have permission to view the report, you asked for changes for the “Public snapshot” mode.
To address some of the feedback we got from you, we have made a few more changes in this area.
- Add-ins that were saved as “Public snapshot” can be printed and will not require that you go over all the slides and load the add-ins for permission check before the public image is made visible.
- You can use the “Show as saved image” on add-ins that were saved as “Public snapshot”. This will replace the entire add-in with an image representation of it, so the load time might be faster when you are presenting your presentation.
Many of us keep presentations open for a long time, which might cause the data in the presentation to become outdated.
To make sure you have in your slides the data you need, we added a new notification that tells you if more up to date data exists in Power BI and offers you the option to refresh and get the latest data from Power BI.
Developers
Direct Lake semantic models are now supported in Fabric Git Integration , enabling streamlined version control, enhanced collaboration among developers, and the establishment of CI/CD pipelines for your semantic models using Direct Lake.
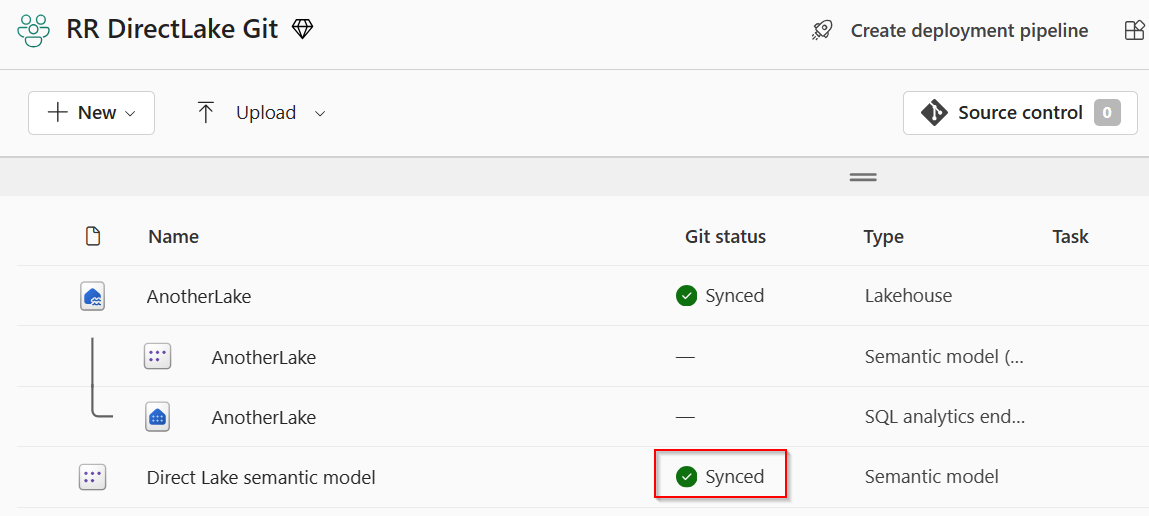
Learn more about version control, testing, and deployment of Power BI content in our Power BI implementation planning documentation: https://learn.microsoft.com/power-bi/guidance/powerbi-implementation-planning-content-lifecycle-management-overview
Visualizations
Editor’s pick of the quarter .
– Animator for Power BI Innofalls Charts SuperTables Sankey Diagram for Power BI by ChartExpo Dynamic KPI Card by Sereviso Shielded HTML Viewer Text search slicer
New visuals in AppSource
Mapa Polski – Województwa, Powiaty, Gminy Workstream Income Statement Table
Gas Detection Chart
Seasonality Chart PlanIn BI – Data Refresh Service
Chart Flare
PictoBar ProgBar
Counter Calendar Donut Chart image
Financial Reporting Matrix by Profitbase
Making financial statements with a proper layout has just become easier with the latest version of the Financial Reporting Matrix.
Users are now able to specify which rows should be classified as cost-rows, which will make it easier to get the conditional formatting of variances correctly:

Selecting a row, and ticking “is cost” will tag the row as cost. This can be used in conditional formatting to make sure that positive variances on expenses are a bad for the result, while a positive variance on an income row is good for the result.
The new version also includes more flexibility in measuring placement and column subtotals.
Measures can be placed either:
- Default (below column headers)
- Above column headers
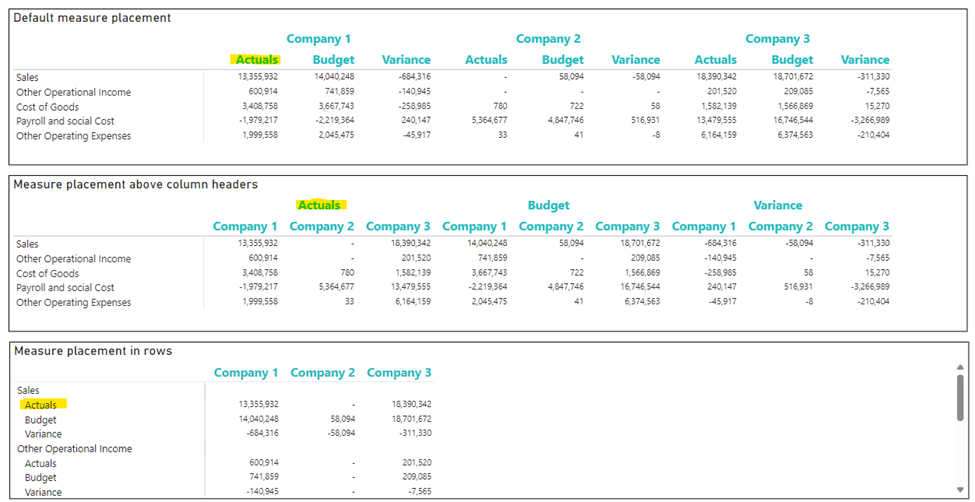
- Conditionally hide columns
- + much more
Highlighted new features:
- Measure placement – In rows
- Select Column Subtotals
- New Format Pane design
- Row Options
Get the visual from AppSource and find more videos here !
Horizon Chart by Powerviz
A Horizon Chart is an advanced visual, for time-series data, revealing trends and anomalies. It displays stacked data layers, allowing users to compare multiple categories while maintaining data clarity. Horizon Charts are particularly useful to monitor and analyze complex data over time, making this a valuable visual for data analysis and decision-making.
Key Features:
- Horizon Styles: Choose Natural, Linear, or Step with adjustable scaling.
- Layer: Layer data by range or custom criteria. Display positive and negative values together or separately on top.
- Reference Line : Highlight patterns with X-axis lines and labels.
- Colors: Apply 30+ color palettes and use FX rules for dynamic coloring.
- Ranking: Filter Top/Bottom N values, with “Others”.
- Gridline: Add gridlines to the X and Y axis.
- Custom Tooltip: Add highest, lowest, mean, and median points without additional DAX.
- Themes: Save designs and share seamlessly with JSON files.
Other features included are ranking, annotation, grid view, show condition, and accessibility support.
Business Use Cases: Time-Series Data Comparison, Environmental Monitoring, Anomaly Detection
🔗 Try Horizon Chart for FREE from AppSource
📊 Check out all features of the visual: Demo file
📃 Step-by-step instructions: Documentation
💡 YouTube Video: Video Link
📍 Learn more about visuals: https://powerviz.ai/
✅ Follow Powerviz : https://lnkd.in/gN_9Sa6U
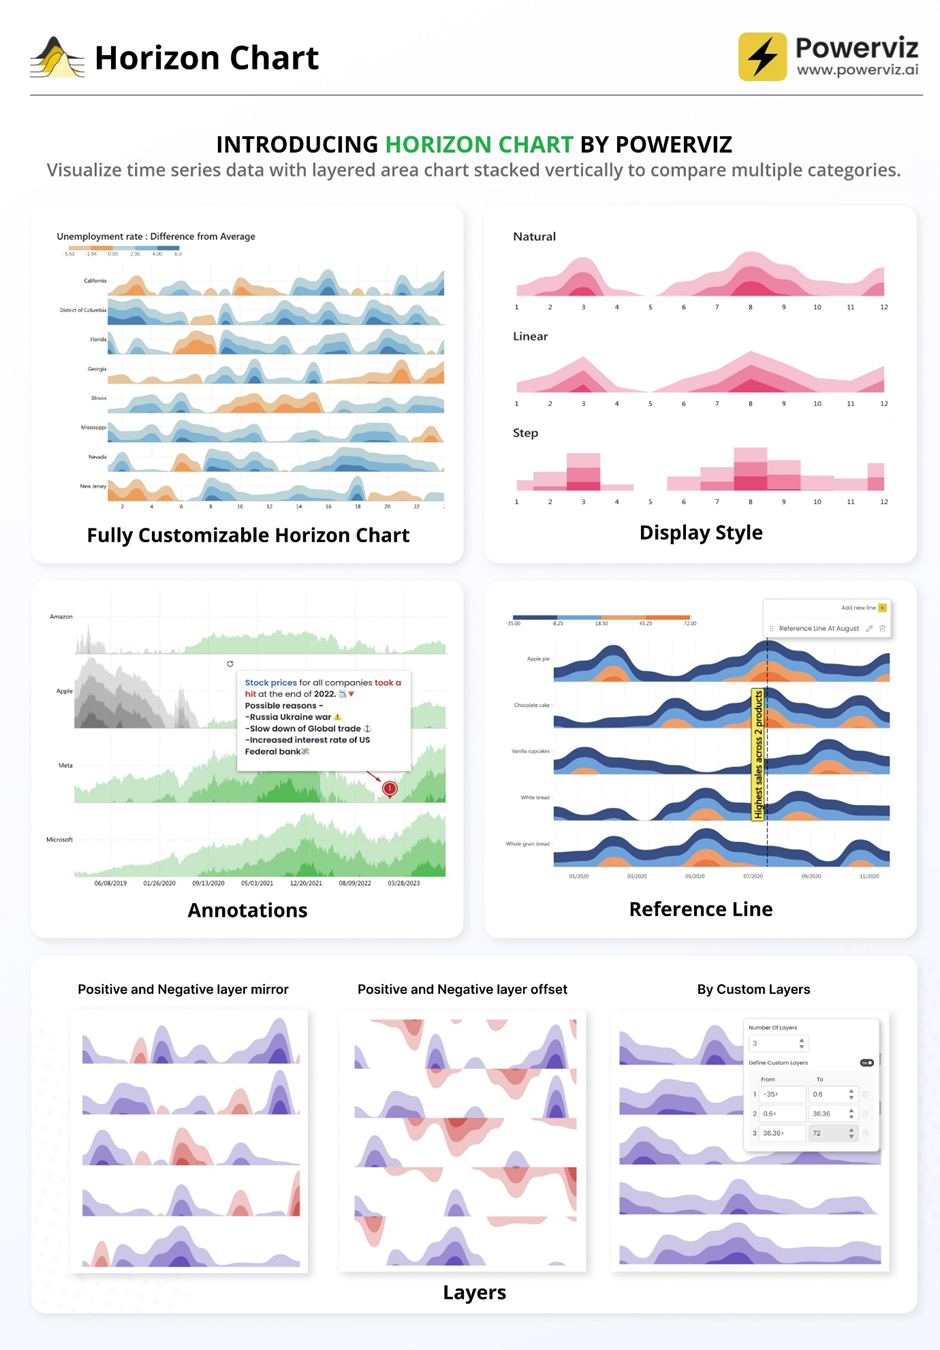
Exciting news! Thanks to your valuable feedback, we’ve enhanced our Milestone Trend Analysis Chart even further. We’re thrilled to announce that you can now switch between horizontal and vertical orientations, catering to your preferred visualization style.
The Milestone Trend Analysis (MTA) Chart remains your go-to tool for swiftly identifying deadline trends, empowering you to take timely corrective actions. With this update, we aim to enhance deadline awareness among project participants and stakeholders alike.
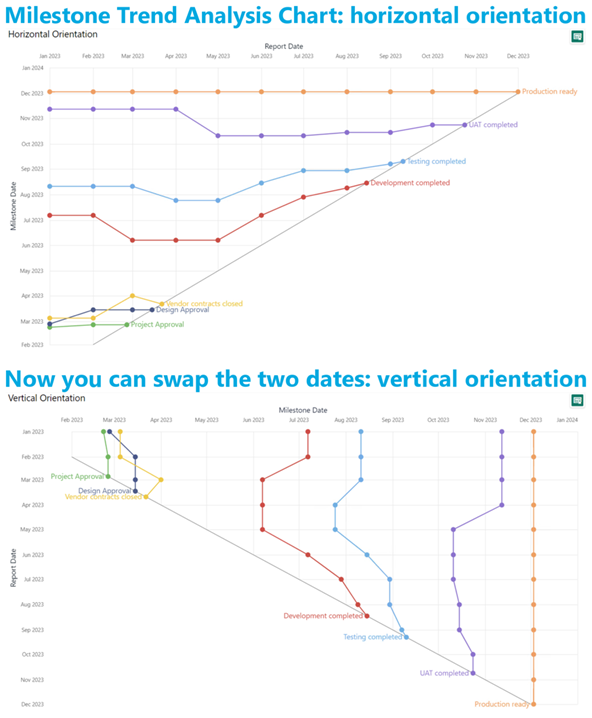
In our latest version, we seamlessly navigate between horizontal and vertical views within the familiar Power BI interface. No need to adapt to a new user interface – enjoy the same ease of use with added flexibility. Plus, it benefits from supported features like themes, interactive selection, and tooltips.
What’s more, ours is the only Microsoft Certified Milestone Trend Analysis Chart for Power BI, ensuring reliability and compatibility with the platform.
Ready to experience the enhanced Milestone Trend Analysis Chart? Download it from AppSource today and explore its capabilities with your own data – try for free!
We welcome any questions or feedback at our website: https://visuals.novasilva.com/ . Try it out and elevate your project management insights now!
Sunburst Chart by Powerviz
Powerviz’s Sunburst Chart is an interactive tool for hierarchical data visualization. With this chart, you can easily visualize multiple columns in a hierarchy and uncover valuable insights. The concentric circle design helps in displaying part-to-whole relationships.
- Arc Customization: Customize shapes and patterns.
- Color Scheme: Accessible palettes with 30+ options.
- Centre Circle: Design an inner circle with layers. Add text, measure, icons, and images.
- Conditional Formatting: Easily identify outliers based on measure or category rules.
- Labels: Smart data labels for readability.
- Image Labels: Add an image as an outer label.
- Interactivity: Zoom, drill down, cross-filtering, and tooltip features.
Other features included are annotation, grid view, show condition, and accessibility support.
Business Use Cases:
- Sales and Marketing: Market share analysis and customer segmentation.
- Finance : Department budgets and expenditures distribution.
- Operations : Supply chain management.
- Education : Course structure, curriculum creation.
- Human Resources : Organization structure, employee demographics.
🔗 Try Sunburst Chart for FREE from AppSource
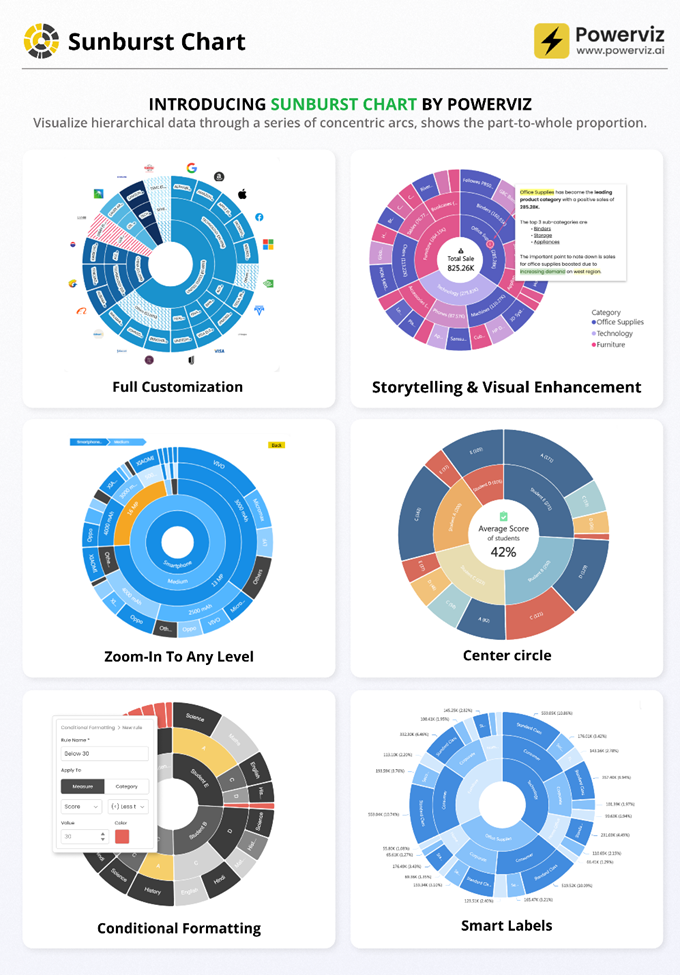
Stacked Bar Chart with Line by JTA
Clustered bar chart with the possibility to stack one of the bars
Stacked Bar Chart with Line by JTA seamlessly merges the simplicity of a traditional bar chart with the versatility of a stacked bar, revolutionizing the way you showcase multiple datasets in a single, cohesive display.
Unlocking a new dimension of insight, our visual features a dynamic line that provides a snapshot of data trends at a glance. Navigate through your data effortlessly with multiple configurations, gaining a swift and comprehensive understanding of your information.
Tailor your visual experience with an array of functionalities and customization options, enabling you to effortlessly compare a primary metric with the performance of an entire set. The flexibility to customize the visual according to your unique preferences empowers you to harness the full potential of your data.
Features of Stacked Bar Chart with Line:
- Stack the second bar
- Format the Axis and Gridlines
- Add a legend
- Format the colors and text
- Add a line chart
- Format the line
- Add marks to the line
- Format the labels for bars and line
If you liked what you saw, you can try it for yourself and find more information here . Also, if you want to download it, you can find the visual package on the AppSource .
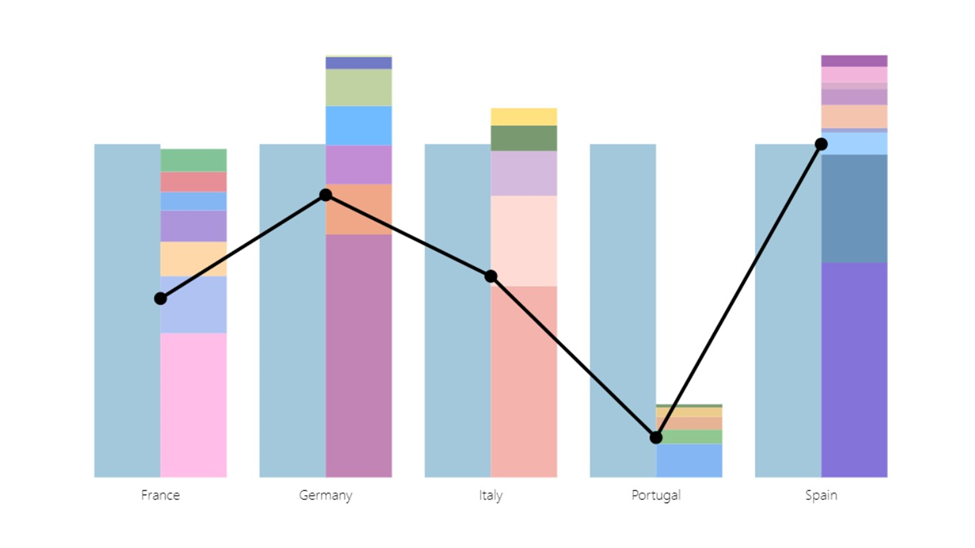
We have added an exciting new feature to our Combo PRO, Combo Bar PRO, and Timeline PRO visuals – Legend field support . The Legend field makes it easy to visually split series values into smaller segments, without the need to use measures or create separate series. Simply add a column with category names that are adjacent to the series values, and the visual will do the following:
- Display separate segments as a stack or cluster, showing how each segment contributed to the total Series value.
- Create legend items for each segment to quickly show/hide them without filtering.
- Apply custom fill colors to each segment.
- Show each segment value in the tooltip
Read more about the Legend field on our blog article
Drill Down Combo PRO is made for creators who want to build visually stunning and user-friendly reports. Cross-chart filtering and intuitive drill down interactions make data exploration easy and fun for any user. Furthermore, you can choose between three chart types – columns, lines, or areas; and feature up to 25 different series in the same visual and configure each series independently.
📊 Get Drill Down Combo PRO on AppSource
🌐 Visit Drill Down Combo PRO product page
Documentation | ZoomCharts Website | Follow ZoomCharts on LinkedIn
We are thrilled to announce that Fabric Core REST APIs are now generally available! This marks a significant milestone in the evolution of Microsoft Fabric, a platform that has been meticulously designed to empower developers and businesses alike with a comprehensive suite of tools and services.
The Core REST APIs are the backbone of Microsoft Fabric, providing the essential building blocks for a myriad of functionalities within the platform. They are designed to improve efficiency, reduce manual effort, increase accuracy, and lead to faster processing times. These APIs help with scale operations more easily and efficiently as the volume of work grows, automate repeatable processes with consistency, and enable integration with other systems and applications, providing a streamlined and efficient data pipeline.
The Microsoft Fabric Core APIs encompasses a range of functionalities, including:
- Workspace management: APIs to manage workspaces, including permissions.
- Item management: APIs for creating, reading, updating, and deleting items, with partial support for data source discovery and granular permissions management planned for the near future.
- Job and tenant management: APIs to manage jobs, tenants, and users within the platform.
These APIs adhere to industry standards and best practices, ensuring a unified developer experience that is both coherent and easy to use.
For developers looking to dive into the details of the Microsoft Fabric Core APIs, comprehensive documentation is available. This includes guidelines on API usage, examples, and articles managed in a centralized repository for ease of access and discoverability. The documentation is continuously updated to reflect the latest features and improvements, ensuring that developers have the most current information at their fingertips. See Microsoft Fabric REST API documentation
We’re excited to share an important update we made to the Fabric Admin APIs. This enhancement is designed to simplify your automation experience. Now, you can manage both Power BI and the new Fabric items (previously referred to as artifacts) using the same set of APIs. Before this enhancement, you had to navigate using two different APIs—one for Power BI items and another for new Fabric items. That’s no longer the case.
The APIs we’ve updated include GetItem , ListItems , GetItemAccessDetails , and GetAccessEntities . These enhancements mean you can now query and manage all your items through a single API call, regardless of whether they’re Fabric types or Power BI types. We hope this update makes your work more straightforward and helps you accomplish your tasks more efficiently.
We’re thrilled to announce the public preview of the Microsoft Fabric workload development kit. This feature now extends to additional workloads and offers a robust developer toolkit for designing, developing, and interoperating with Microsoft Fabric using frontend SDKs and backend REST APIs. Introducing the Microsoft Fabric Workload Development Kit .
The Microsoft Fabric platform now provides a mechanism for ISVs and developers to integrate their new and existing applications natively into Fabric’s workload hub. This integration provides the ability to add net new capabilities to Fabric in a consistent experience without leaving their Fabric workspace, thereby accelerating data driven outcomes from Microsoft Fabric.
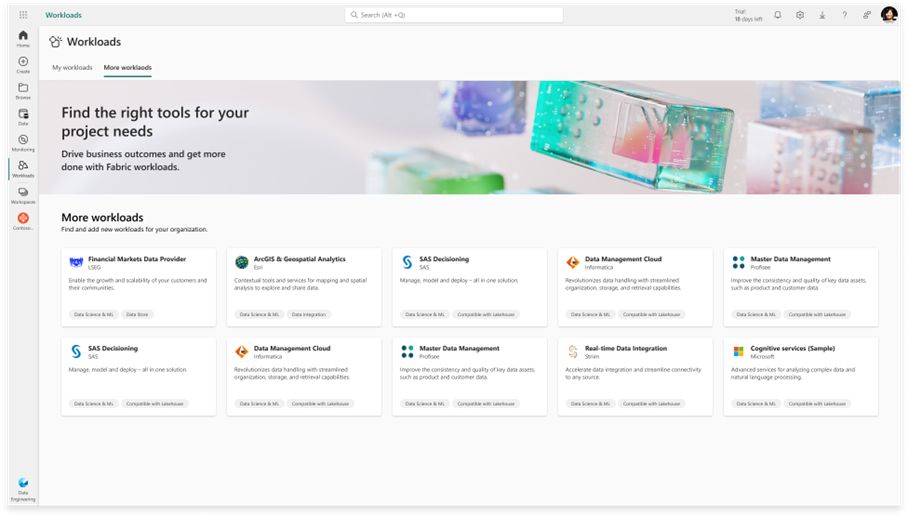
By downloading and leveraging the development kit , ISVs and software developers can build and scale existing and new applications on Microsoft Fabric and offer them via the Azure Marketplace without the need to ever leave the Fabric environment.
The development kit provides a comprehensive guide and sample code for creating custom item types that can be added to the Fabric workspace. These item types can leverage the Fabric frontend SDKs and backend REST APIs to interact with other Fabric capabilities, such as data ingestion, transformation, orchestration, visualization, and collaboration. You can also embed your own data application into the Fabric item editor using the Fabric native experience components, such as the header, toolbar, navigation pane, and status bar. This way, you can offer consistent and seamless user experience across different Fabric workloads.
This is a call to action for ISVs, software developers, and system integrators. Let’s leverage this opportunity to create more integrated and seamless experiences for our users.
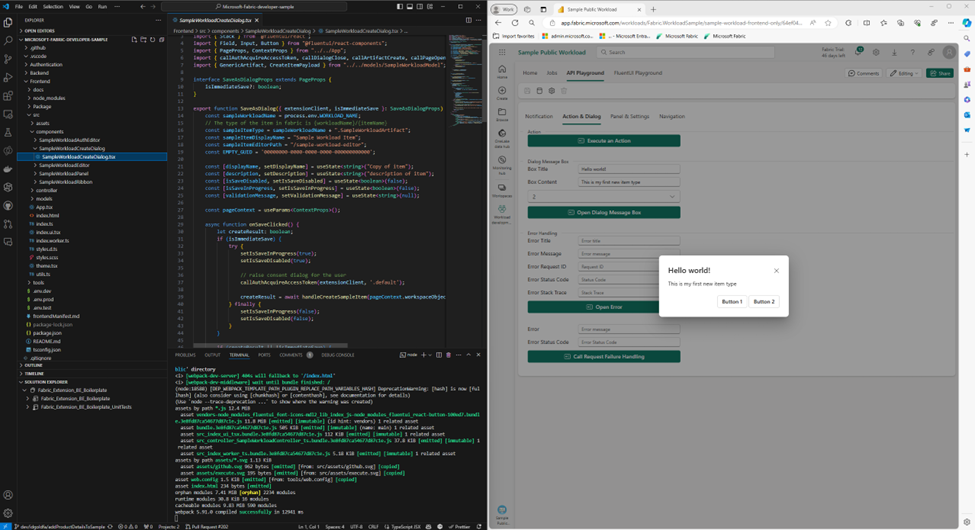
We’re excited about this journey and look forward to seeing the innovative workloads from our developer community.
We are proud to announce the public preview of external data sharing. Sharing data across organizations has become a standard part of day-to-day business for many of our customers. External data sharing, built on top of OneLake shortcuts, enables seamless, in-place sharing of data, allowing you to maintain a single copy of data even when sharing data across tenant boundaries. Whether you’re sharing data with customers, manufacturers, suppliers, consultants, or partners; the applications are endless.
How external data sharing works
Sharing data across tenants is as simple as any other share operation in Fabric. To share data, navigate to the item to be shared, click on the context menu, and then click on External data share . Select the folder or table you want to share and click Save and continue . Enter the email address and an optional message and then click Send .
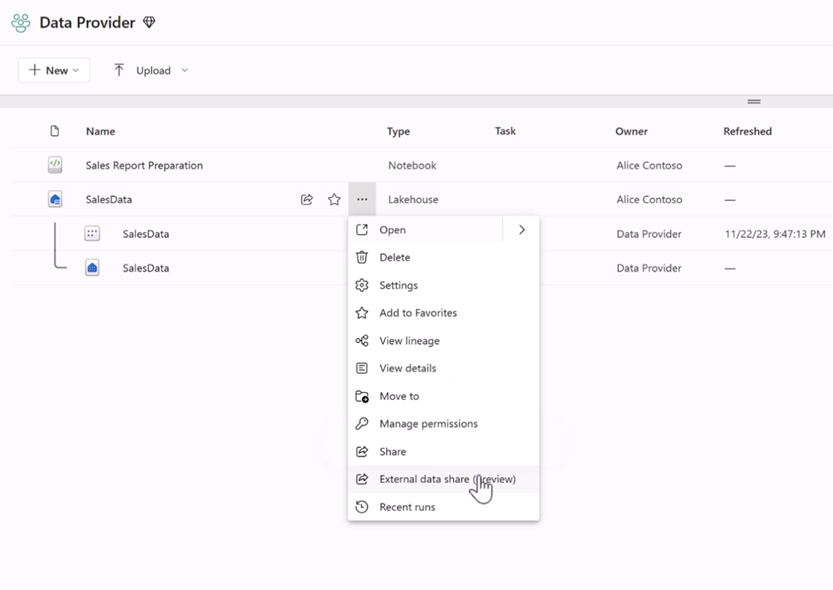
The data consumer will receive an email containing a share link. They can click on the link to accept the share and access the data within their own tenant.
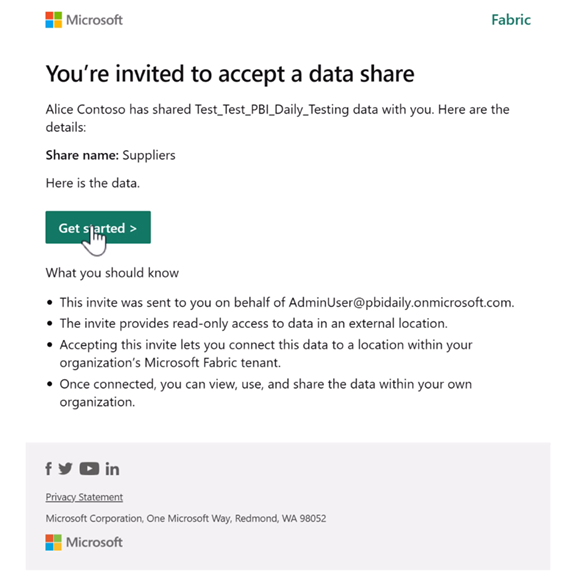
Click here for more details about external data sharing .
Following the release of OneLake data access roles in public preview, the OneLake team is excited to announce the availability of APIs for managing data access roles. These APIs can be used to programmatically manage granular data access for your lakehouses. Manage all aspects of role management such as creating new roles, editing existing ones, or changing memberships in a programmatic way.
Do you have data stored on-premises or behind a firewall that you want to access and analyze with Microsoft Fabric? With OneLake shortcuts, you can bring on-premises or network-restricted data into OneLake, without any data movement or duplication. Simply install the Fabric on-premises data gateway and create a shortcut to your S3 compatible, Amazon S3, or Google Cloud Storage data source. Then use any of Fabric’s powerful analytics engines and OneLake open APIs to explore, transform, and visualize your data in the cloud.
Try it out today and unlock the full potential of your data with OneLake shortcuts!
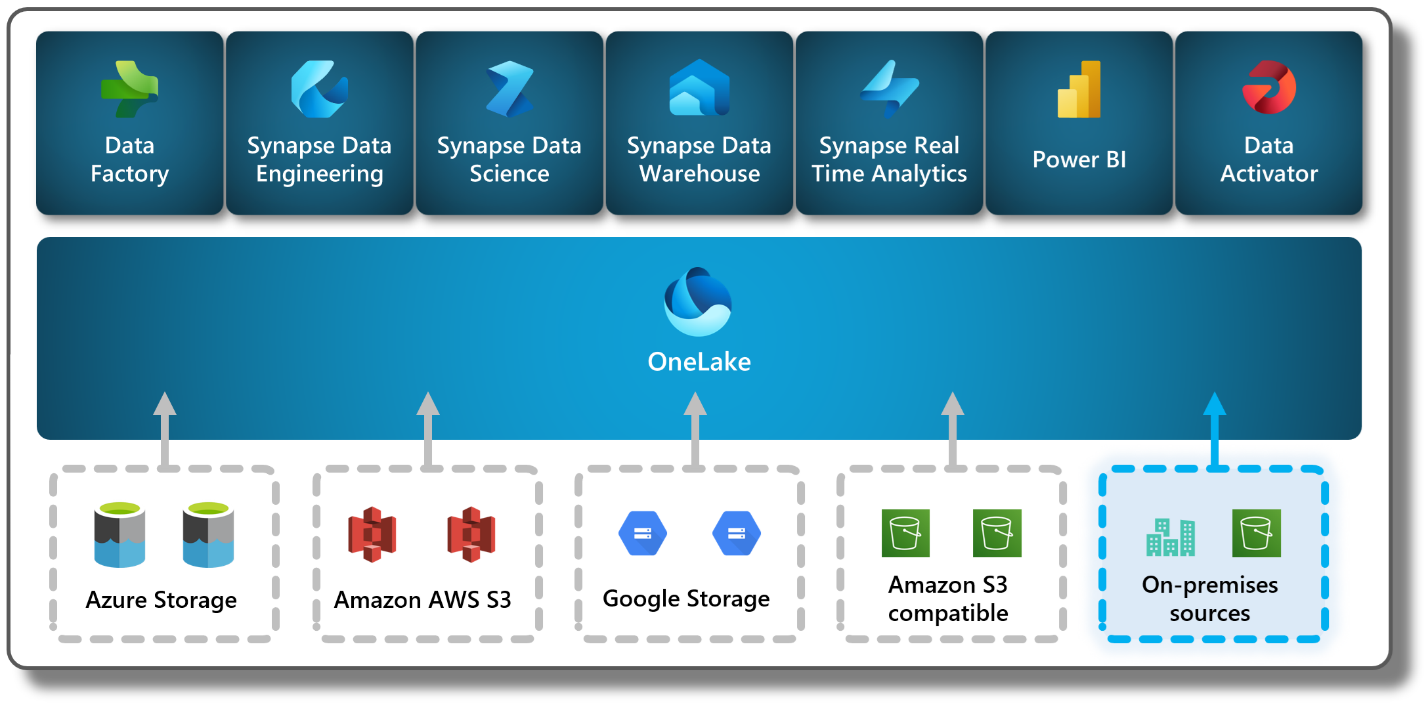
Data Warehouse
We are excited to announce Copilot for Data Warehouse in public preview! Copilot for Data Warehouse is an AI assistant that helps developers generate insights through T-SQL exploratory analysis. Copilot is contextualized your warehouse’s schema. With this feature, data engineers and data analysts can use Copilot to:
- Generate T-SQL queries for data analysis.
- Explain and add in-line code comments for existing T-SQL queries.
- Fix broken T-SQL code.
- Receive answers regarding general data warehousing tasks and operations.
There are 3 areas where Copilot is surfaced in the Data Warehouse SQL Query Editor:
- Code completions when writing a T-SQL query.
- Chat panel to interact with the Copilot in natural language.
- Quick action buttons to fix and explain T-SQL queries.
Learn more about Copilot for Data Warehouse: aka.ms/data-warehouse-copilot-docs. Copilot for Data Warehouse is currently only available in the Warehouse. Copilot in the SQL analytics endpoint is coming soon.
Unlocking Insights through Time: Time travel in Data warehouse (public preview)
As data volumes continue to grow in today’s rapidly evolving world of Artificial Intelligence, it is crucial to reflect on historical data. It empowers businesses to derive valuable insights that aid in making well-informed decisions for the future. Preserving multiple historical data versions not only incurred significant costs but also presented challenges in upholding data integrity, resulting in a notable impact on query performance. So, we are thrilled to announce the ability to query the historical data through time travel at the T-SQL statement level which helps unlock the evolution of data over time.
The Fabric warehouse retains historical versions of tables for seven calendar days. This retention allows for querying the tables as if they existed at any point within the retention timeframe. Time travel clause can be included in any top level SELECT statement. For complex queries that involve multiple tables, joins, stored procedures, or views, the timestamp is applied just once for the entire query instead of specifying the same timestamp for each table within the same query. This ensures the entire query is executed with reference to the specified timestamp, maintaining the data’s uniformity and integrity throughout the query execution.
From historical trend analysis and forecasting to compliance management, stable reporting and real-time decision support, the benefits of time travel extend across multiple business operations. Embrace the capability of time travel to navigate the data-driven landscape and gain a competitive edge in today’s fast-paced world of Artificial Intelligence.
We are excited to announce not one but two new enhancements to the Copy Into feature for Fabric Warehouse: Copy Into with Entra ID Authentication and Copy Into for Firewall-Enabled Storage!
Entra ID Authentication
When authenticating storage accounts in your environment, the executing user’s Entra ID will now be used by default. This ensures that you can leverage A ccess C ontrol L ists and R ole – B ased a ccess c ontrol to authenticate to your storage accounts when using Copy Into. Currently, only organizational accounts are supported.
How to Use Entra ID Authentication
- Ensure your Entra ID organizational account has access to the underlying storage and can execute the Copy Into statement on your Fabric Warehouse.
- Run your Copy Into statement without specifying any credentials; the Entra ID organizational account will be used as the default authentication mechanism.
Copy into firewall-enabled storage
The Copy Into for firewall-enabled storage leverages the trusted workspace access functionality ( Trusted workspace access in Microsoft Fabric (preview) – Microsoft Fabric | Microsoft Learn ) to establish a secure and seamless connection between Fabric and your storage accounts. Secure access can be enabled for both blob and ADLS Gen2 storage accounts. Secure access with Copy Into is available for warehouses in workspaces with Fabric Capacities (F64 or higher).
To learn more about Copy into , please refer to COPY INTO (Transact-SQL) – Azure Synapse Analytics and Microsoft Fabric | Microsoft Learn
We are excited to announce the launch of our new feature, Just in Time Database Attachment, which will significantly enhance your first experience, such as when connecting to the Datawarehouse or SQL endpoint or simply opening an item. These actions trigger the workspace resource assignment process, where, among other actions, we attach all necessary metadata of your items, Data warehouses and SQL endpoints, which can be a long process, particularly for workspaces that have a high number of items.
This feature is designed to attach your desired database during the activation process of your workspace, allowing you to execute queries immediately and avoid unnecessary delays. However, all other databases will be attached asynchronously in the background while you are able to execute queries, ensuring a smooth and efficient experience.
Data Engineering
We are advancing Fabric Runtime 1.3 from an Experimental Public Preview to a full Public Preview. Our Apache Spark-based big data execution engine, optimized for both data engineering and science workflows, has been updated and fully integrated into the Fabric platform.
The enhancements in Fabric Runtime 1.3 include the incorporation of Delta Lake 3.1, compatibility with Python 3.11, support for Starter Pools, integration with Environment and library management capabilities. Additionally, Fabric Runtime now enriches the data science experience by supporting the R language and integrating Copilot.
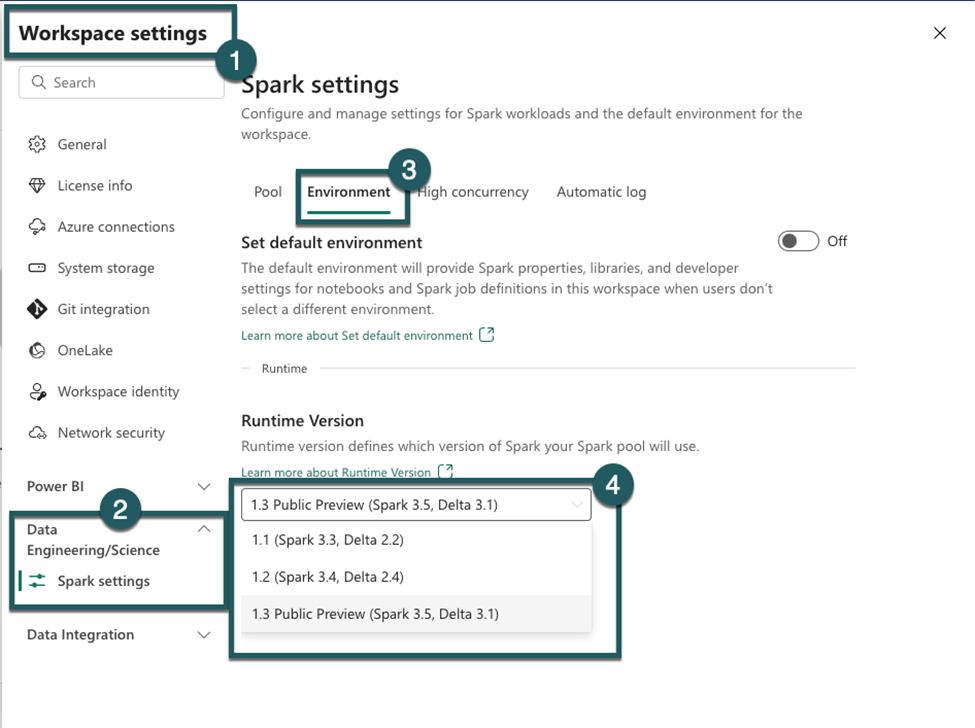
We are pleased to share that the Native Execution Engine for Fabric Runtime 1.2 is currently available in public preview. The Native Execution Engine can greatly enhance the performance for your Spark jobs and queries. The engine has been rewritten in C++ and operates in columnar mode and uses vectorized processing. The Native Execution Engine offers superior query performance – encompassing data processing, ETL, data science, and interactive queries – all directly on your data lake. Overall, Fabric Spark delivers a 4x speed-up on the sum of execution time of all 99 queries in the TPC-DS 1TB benchmark when compared against Apache Spark. This engine is fully compatible with Apache Spark™ APIs (including Spark SQL API).
It is seamless to use with no code changes – activate it and go. Enable it in your environment for your notebooks and your SJDs.
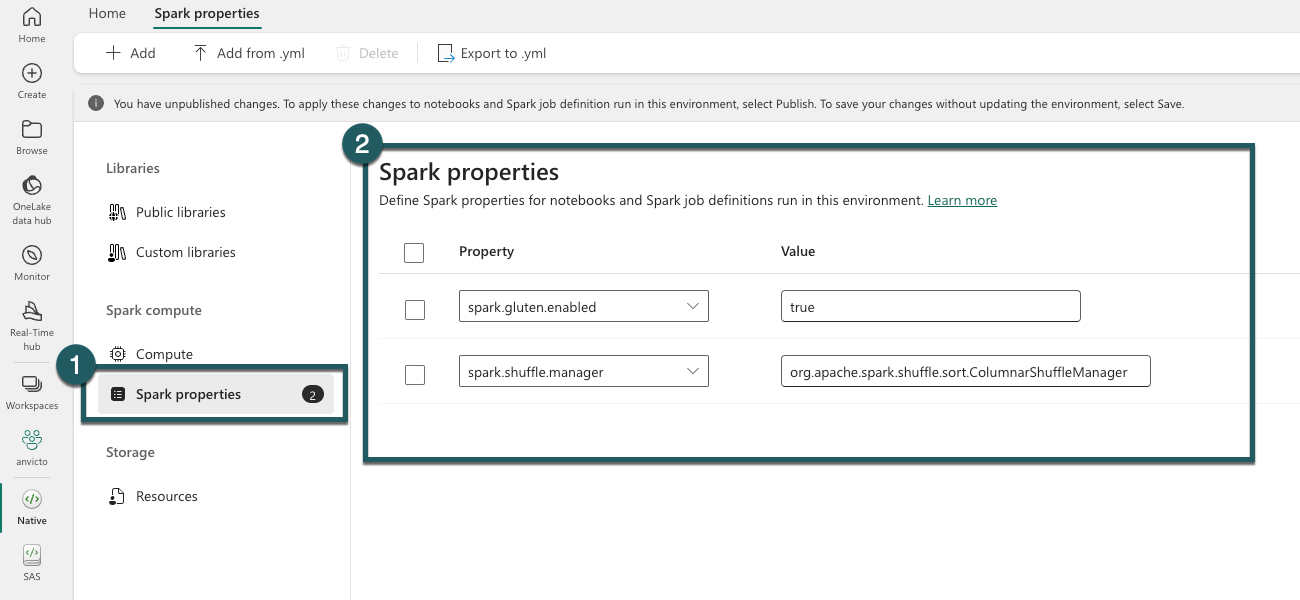
This feature is in the public preview, at this stage of the preview, there is no additional cost associated with using it.
We are excited to announce the Spark Monitoring Run Series Analysis features, which allow you to analyze the run duration trend and performance comparison for Pipeline Spark activity recurring run instances and repetitive Spark run activities from the same Notebook or Spark Job Definition.
- Run Series Comparison: Users can compare the duration of a Notebook run with that of previous runs and evaluate the input and output data to understand the reasons behind prolonged run durations.
- Outlier Detection and Analysis: The system can detect outliers in the run series and analyze them to pinpoint potential contributing factors.
- Detailed Run Instance Analysis: Clicking on a specific run instance provides detailed information on time distribution, which can be used to identify performance enhancement opportunities.
- Configuration Insights : Users can view the Spark configuration used for each run, including auto-tuned configurations for Spark SQL queries in auto-tune enabled Notebook runs.
You can access the new feature from the item’s recent runs panel and Spark application monitoring page.
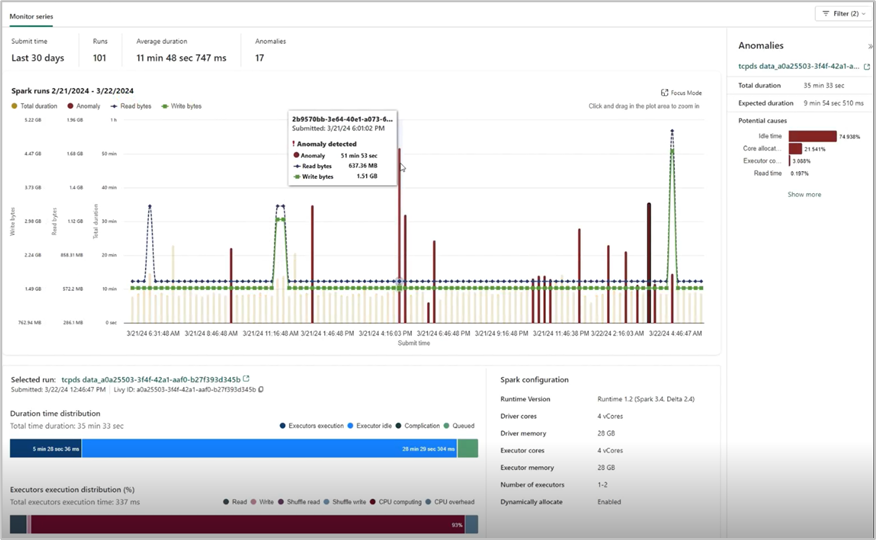
We are excited to announce that Notebook now supports the ability to tag others in comments, just like the familiar functionality of using Office products!
When you select a section of code in a cell, you can add a comment with your insights and tag one or more teammates to collaborate or brainstorm on the specifics. This intuitive enhancement is designed to amplify collaboration in your daily development work.
Moreover, you can easily configure the permissions when tagging someone who doesn’t have the permission, to make sure your code asset is well managed.
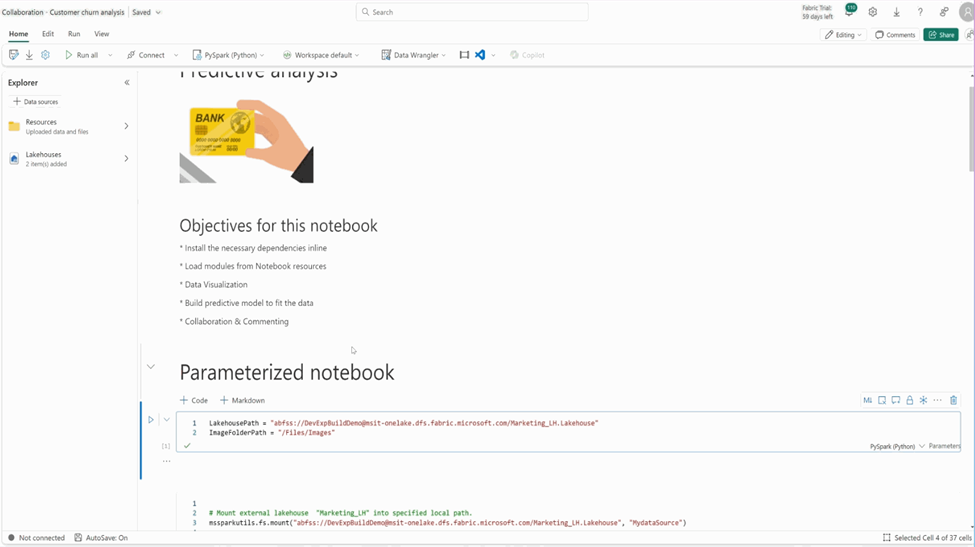
We are thrilled to unveil a significant enhancement to the Fabric notebook ribbon, designed to elevate your data science and engineering workflows.

In the new version, you will find the new Session connect control on the Home tab, and now you can start a standard session without needing to run a code cell.

You can also easily spin up a High concurrency session and share the session across multiple notebooks to improve the compute resource utilization. And you can easily attach/leave a high concurrency session with a single click.
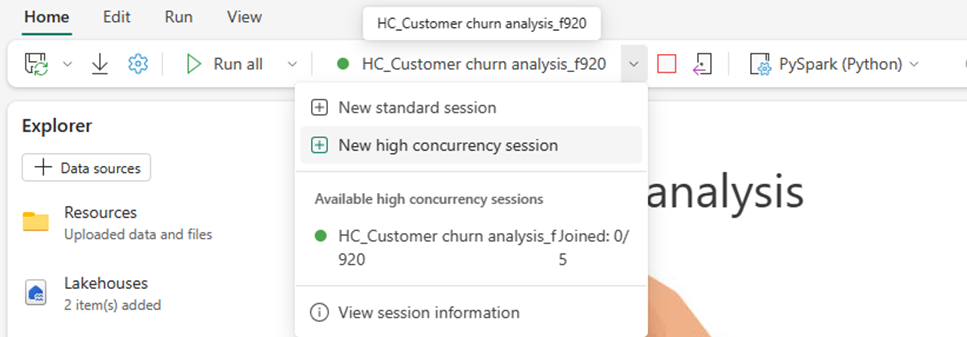
The “ View session information ” can navigate you to the session information dialog, where you can find a lot of useful detailed information, as well as configure the session timeout. The diagnostics info is essentially helpful when you need support for notebook issues.
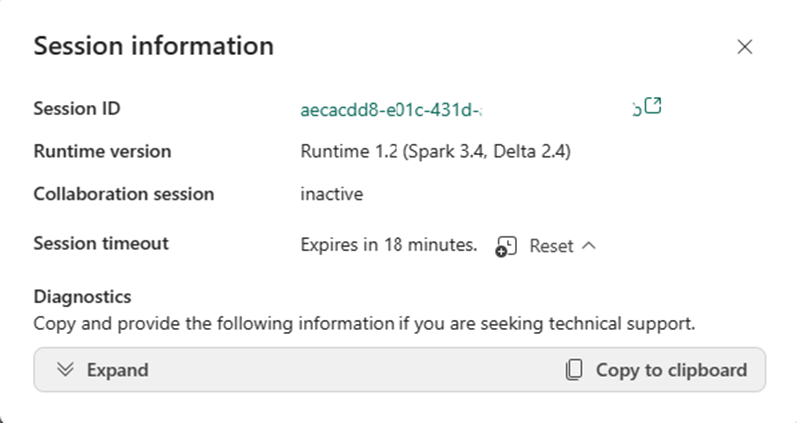
Now you can easily access the powerful “ Data Wrangler ” on Home tab with the new ribbon! You can explore your data with the fancy low-code experience of data wrangler, and the pandas DataFrames and Spark DataFrames are all supported.
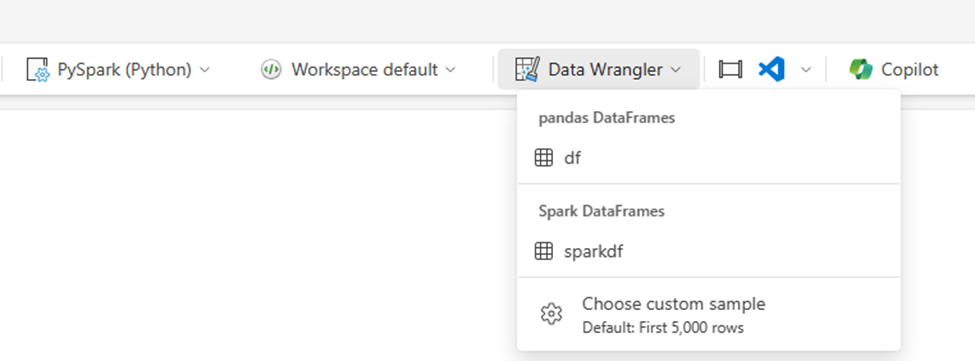
We recently made some changes to the Fabric notebook metadata to ensure compliance and consistency:
Notebook file content:
- The keyword “trident” has been replaced with “dependencies” in the notebook content. This adjustment ensures consistency and compliance.
- Notebook Git format:
- The preface of the notebook has been modified from “# Synapse Analytics notebook source” to “# Fabric notebook source”.
- Additionally, the keyword “synapse” has been updated to “dependencies” in the Git repo.
The above changes will be marked as ‘uncommitted’ for one time if your workspace is connected to Git. No action is needed in terms of these changes , and there won’t be any breaking scenario within the Fabric platform . If you have any further updates or questions, feel free to share with us.
We are thrilled to announce that the environment is now a generally available item in Microsoft Fabric. During this GA timeframe, we have shipped a few new features of Environment.
- Git support
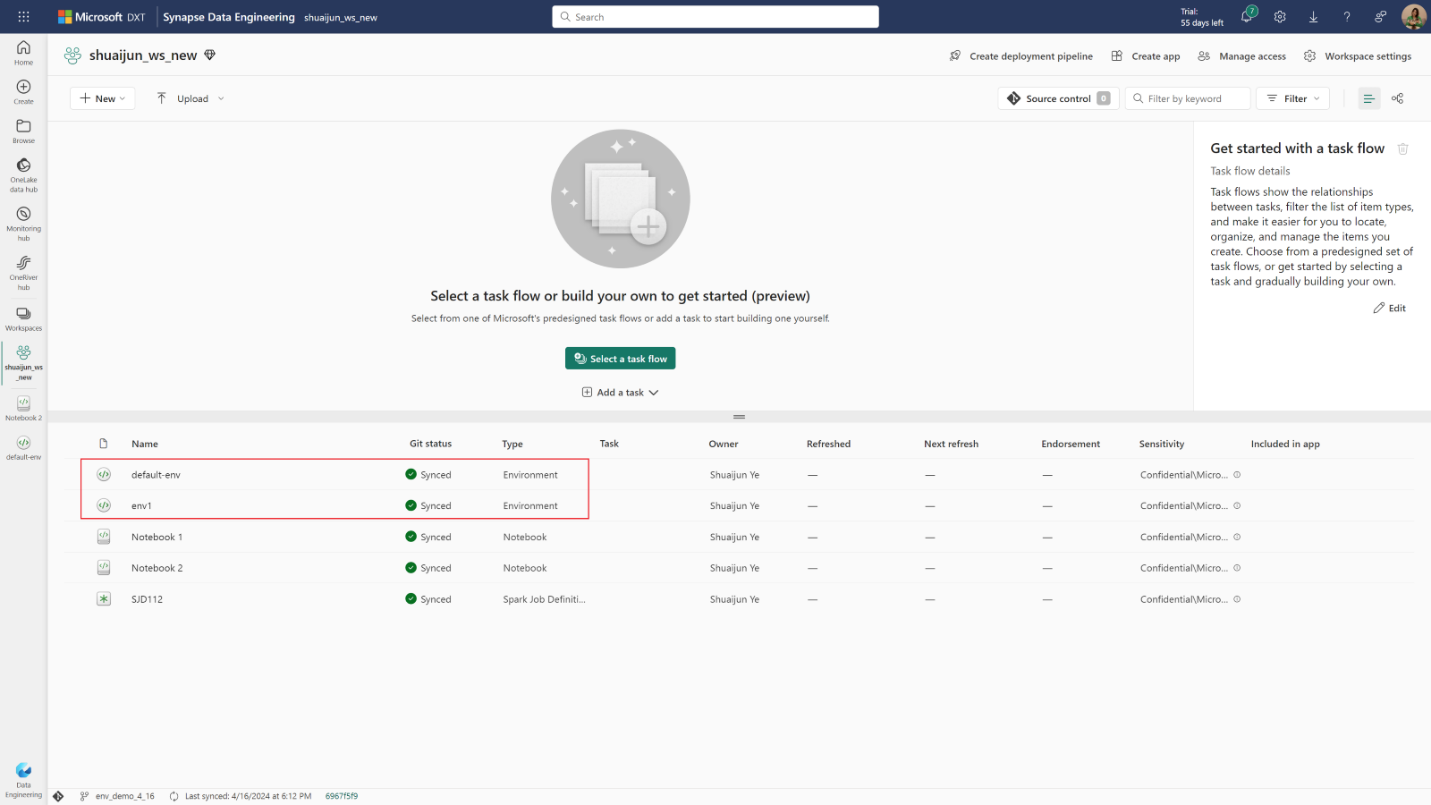
The environment is now Git supported. You can check-in the environment into your Git repo and manipulate the environment locally with its YAML representations and custom library files. After updating the changes from local to Fabric portal, you can publish them by manual action or through REST API.
- Deployment pipeline
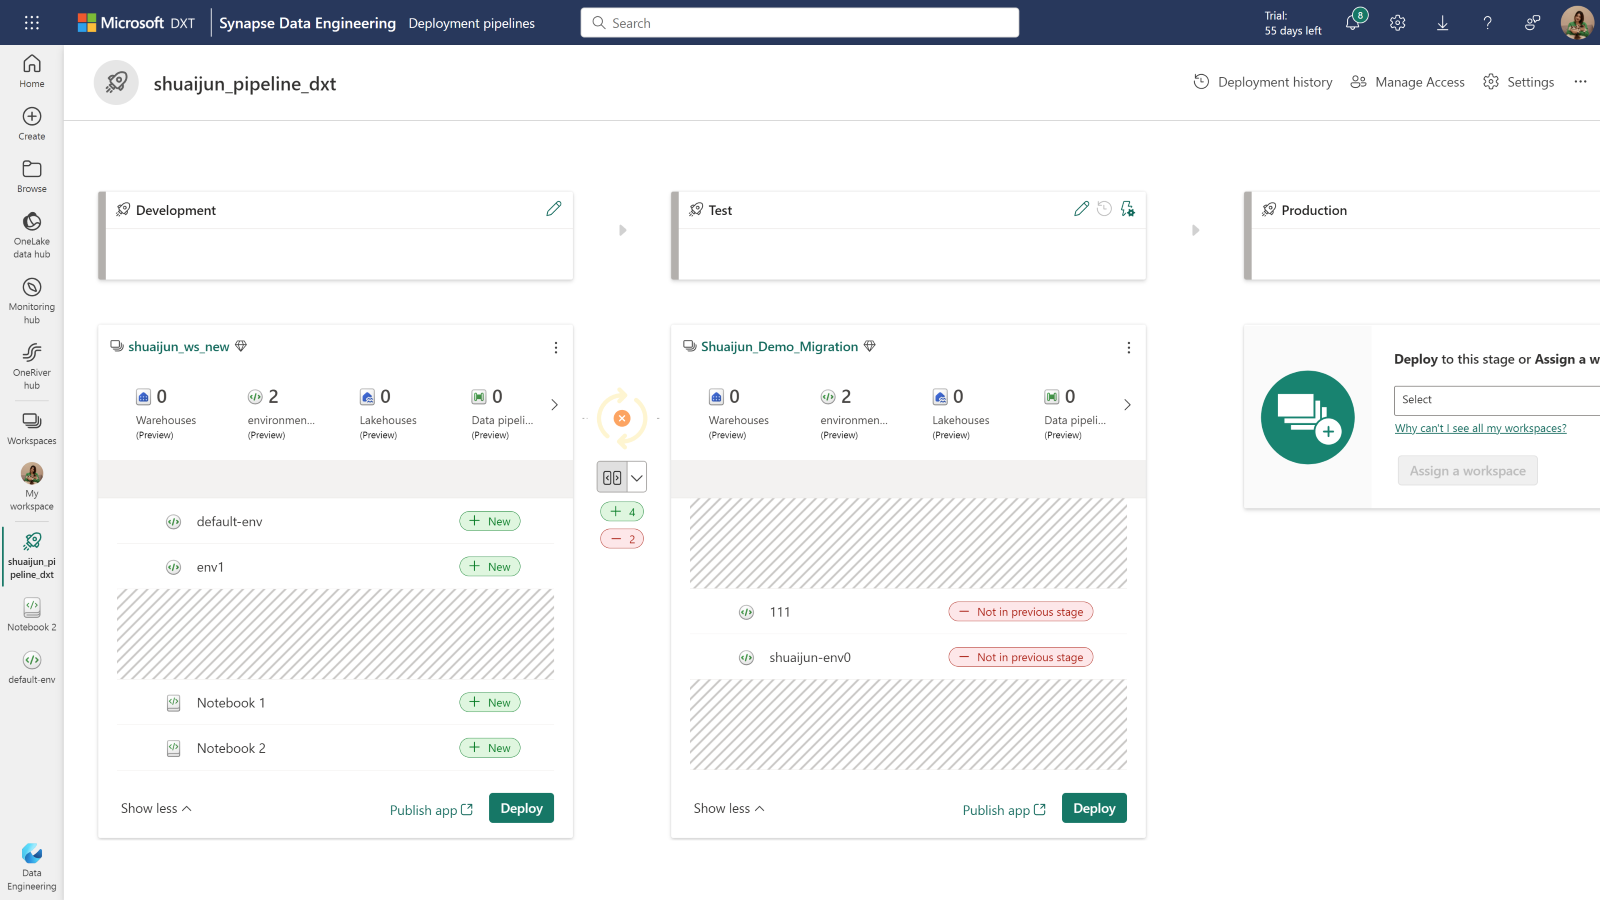
Deploying environments from one workspace to another is supported. Now, you can deploy the code items and their dependent environments together from development to test and even production.
With the REST APIs, you can have the code-first experience with the same abilities through Fabric portal. We provide a set of powerful APIs to ensure you the efficiency in managing your environment. You can create new environments, update libraries and Spark compute, publish the changes, delete an environment, attach the environment to a notebook, etc., all actions can be done locally in the tools of your choice. The article – Best practice of managing environments with REST API could help you get started with several real-world scenarios.
- Resources folder
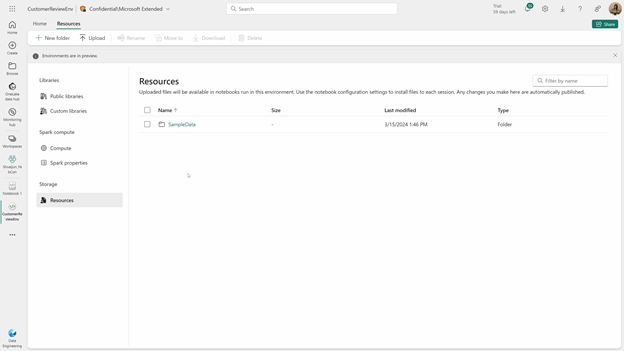
Resources folder enables managing small resources in the development cycle. The files uploaded in the environment can be accessed from notebooks once they’re attached to the same environment. The manipulation of the files and folders of resources happens in real-time. It could be super powerful, especially when you are collaborating with others.
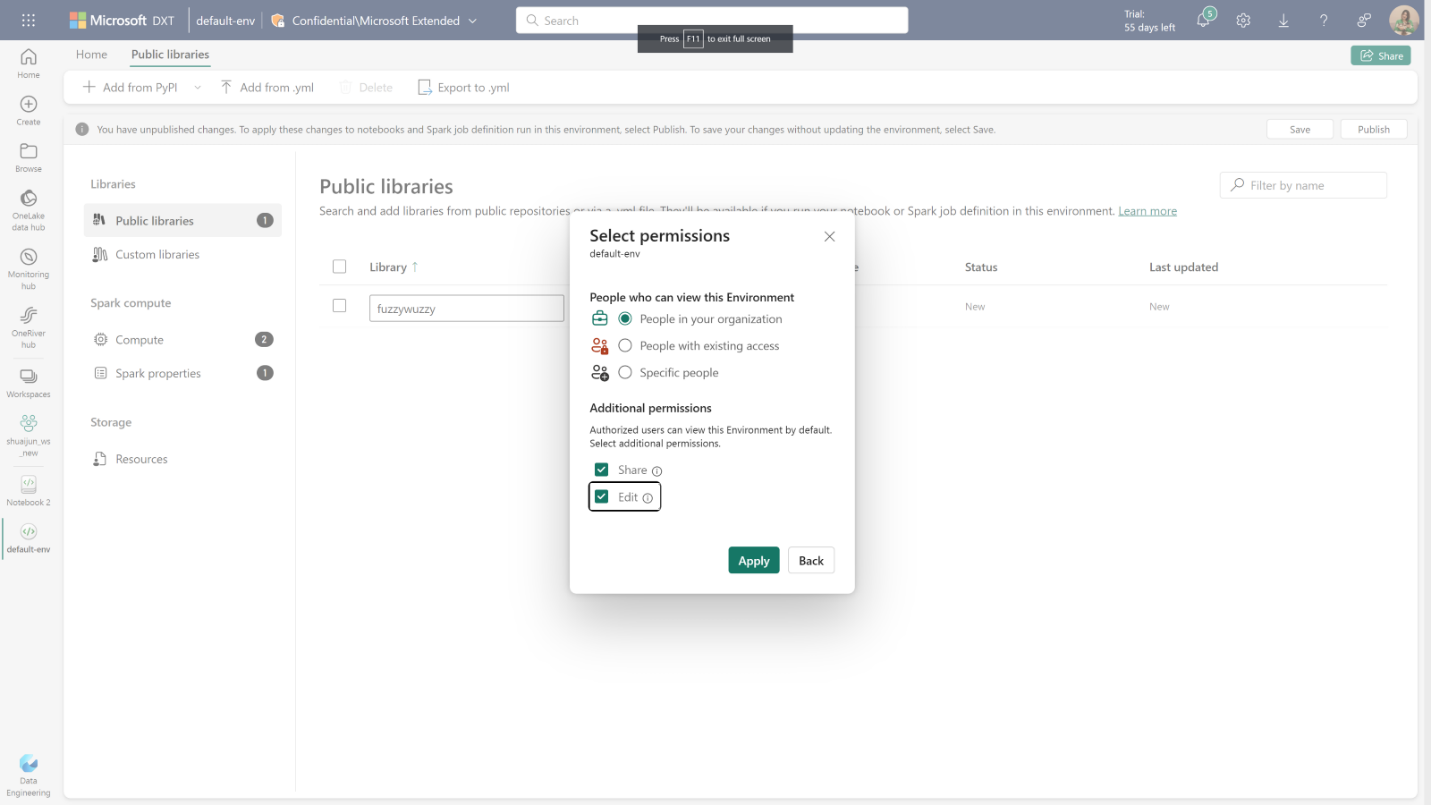
Sharing your environment with others is also available. We provide several sharing options. By default, the view permission is shared. If you want the recipient to have access to view and use the contents of the environment, sharing without permission customization is the best option. Furthermore, you can grant editing permission to allow recipients to update this environment or grant share permission to allow recipients to reshare this environment with their existing permissions.
We are excited to announce the REST api support for Fabric Data Engineering/Science workspace settings. Data Engineering/Science settings allows users to create/manage their Spark compute, select the default runtime/default environment, enable or disable high concurrency mode or ML autologging.
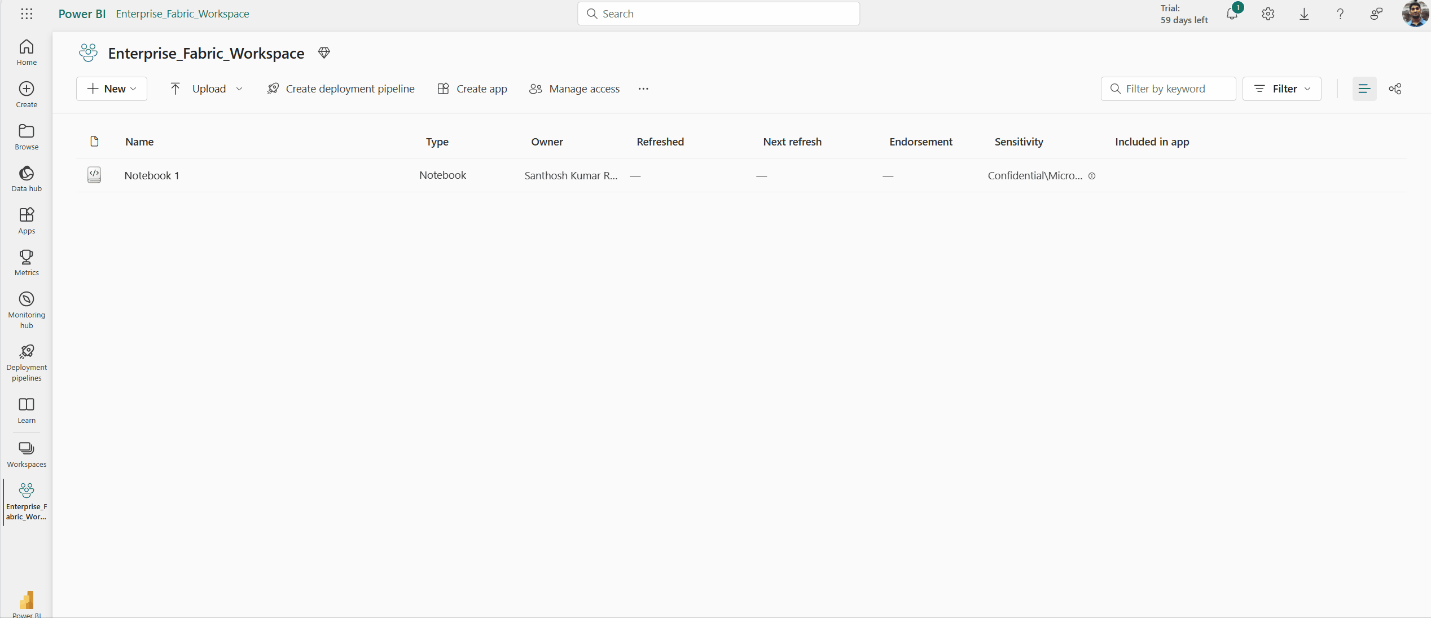
Now with the REST api support for the Data Engineering/Science settings, you would be able to
- Choose the default pool for a Fabric Workspace
- Configure the max nodes for Starter pools
- Create/Update/Delete the existing Custom Pools, Autoscale and Dynamic allocation properties
- Choose Workspace Default Runtime and Environment
- Select a default runtime
- Select the default environment for the Fabric workspace
- Enable or Disable High Concurrency Mode
- Enable or Disable ML Auto logging.
Learn more about the Workspace Spark Settings API in our API documentation Workspace Settings – REST API (Spark) | Microsoft Learn
We are excited to give you a sneak peek at the preview of User Data Functions in Microsoft Fabric. User Data Functions gives developers and data engineers the ability to easily write and run applications that integrate with resources in the Fabric Platform. Data engineering often presents challenges with data quality or complex data analytics processing in data pipelines, and using ETL tools may present limited flexibility and ability to customize to your needs. This is where User data functions can be used to run data transformation tasks and perform complex business logic by connecting to your data sources and other workloads in Fabric.
During preview, you will be able to use the following features:
- Use the Fabric portal to create new User Data Functions, view and test them.
- Write your functions using C#.
- Use the Visual Studio Code extension to create and edit your functions.
- Connect to the following Fabric-native data sources: Data Warehouse, Lakehouse and Mirrored Databases.
You can now create a fully managed GraphQL API in Fabric to interact with your data in a simple, flexible, and powerful way. We’re excited to announce the public preview of API for GraphQL, a data access layer that allows us to query multiple data sources quickly and efficiently in Fabric by leveraging a widely adopted and familiar API technology that returns more data with less client requests. With the new API for GraphQL in Fabric, data engineers and scientists can create data APIs to connect to different data sources, use the APIs in their workflows, or share the API endpoints with app development teams to speed up and streamline data analytics application development in your business.
You can get started with the API for GraphQL in Fabric by creating an API, attaching a supported data source, then selecting specific data sets you want to expose through the API. Fabric builds the GraphQL schema automatically based on your data, you can test and prototype queries directly in our graphical in-browser GraphQL development environment (API editor), and applications are ready to connect in minutes.
Currently, the following supported data sources can be exposed through the Fabric API for GraphQL:
- Microsoft Fabric Data Warehouse
- Microsoft Fabric Lakehouse via SQL Analytics Endpoint
- Microsoft Fabric Mirrored Databases via SQL Analytics Endpoint
Click here to learn more about how to get started.
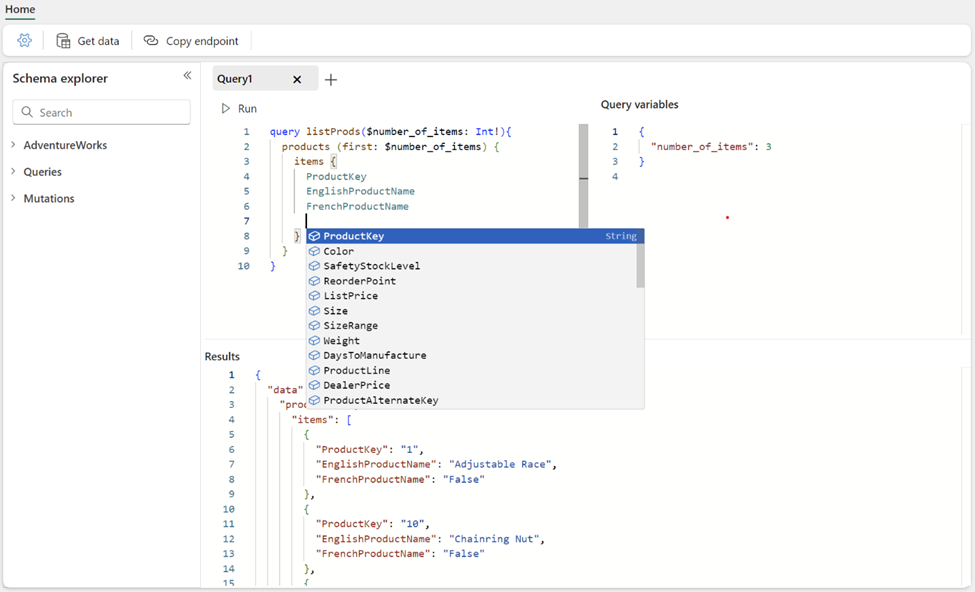
Data Science
As you may know, Copilot in Microsoft Fabric requires your tenant administrator to enable the feature from the admin portal. Starting May 20th, 2024, Copilot in Microsoft Fabric will be enabled by default for all tenants. This update is part of our continuous efforts to enhance user experience and productivity within Microsoft Fabric. This new default activation means that AI features like Copilot will be automatically enabled for tenants who have not yet enabled the setting.
We are introducing a new capability to enable Copilot on Capacity level in Fabric. A new option is being introduced in the tenant admin portal, to delegate the enablement of AI and Copilot features to Capacity administrators. This AI and Copilot setting will be automatically delegated to capacity administrators and tenant administrators won’t be able to turn off the delegation.
We also have a cross-geo setting for customers who want to use Copilot and AI features while their capacity is in a different geographic region than the EU data boundary or the US. By default, the cross-geo setting will stay off and will not be delegated to capacity administrators automatically. Tenant administrators can choose whether to delegate this to capacity administrators or not.
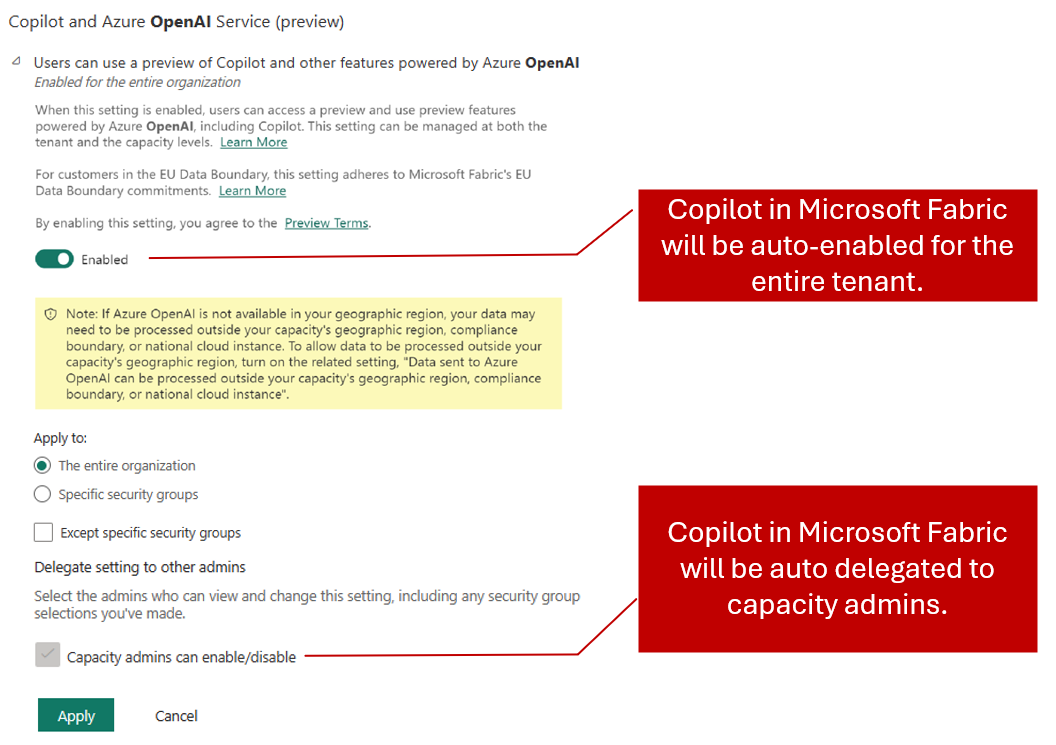
Figure 1. Copilot in Microsoft Fabric will be auto enabled and auto delegated to capacity administrators.
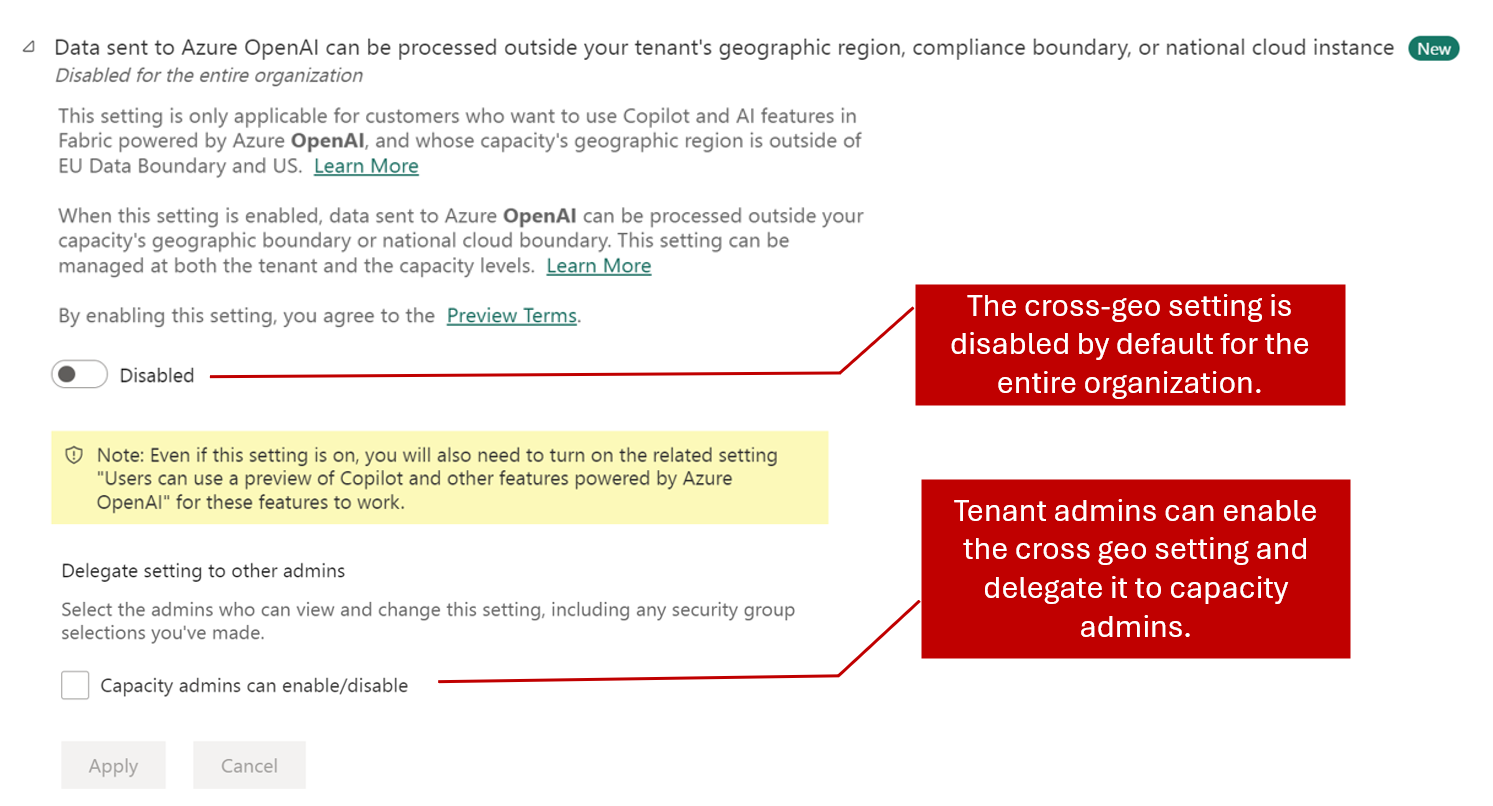
Capacity administrators will see the “Copilot and Azure OpenAI Service (preview)” settings under Capacity settings/ Fabric Capacity / <Capacity name> / Delegated tenant settings. By default, the capacity setting will inherit tenant level settings. Capacity administrators can decide whether to override the tenant administrator’s selection. This means that even if Copilot is not enabled on a tenant level, a capacity administrator can choose to enable Copilot for their capacity. With this level of control, we make it easier to control which Fabric workspaces can utilize AI features like Copilot in Microsoft Fabric.
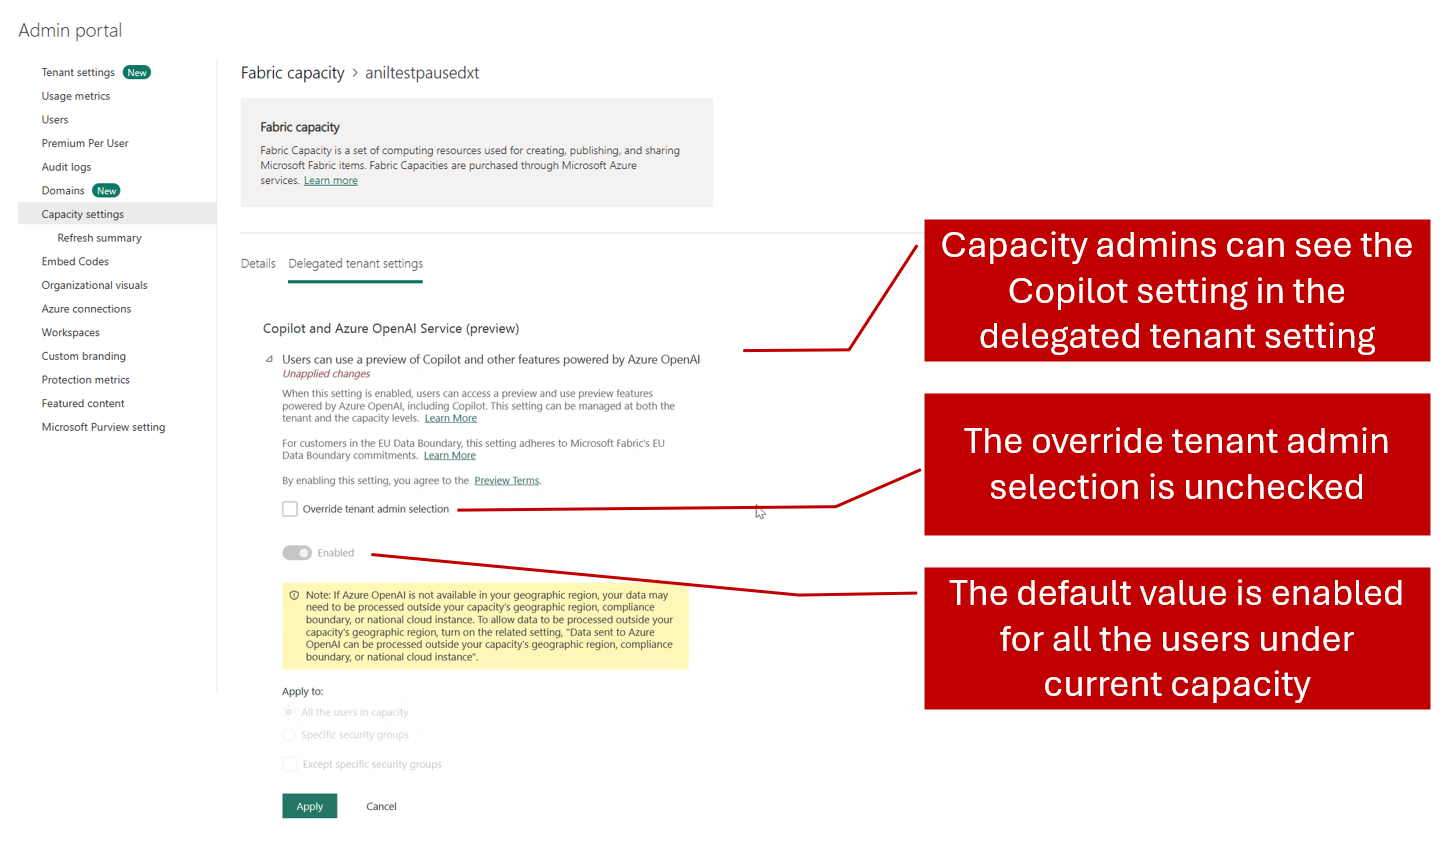
To enhance privacy and trust, we’ve updated our approach to abuse monitoring: previously, we retained data from Copilot in Fabric, including prompt inputs and outputs, for up to 30 days to check for misuse. Following customer feedback, we’ve eliminated this 30-day retention. Now, we no longer store prompt related data, demonstrating our unwavering commitment to your privacy and security. We value your input and take your concerns seriously.
Real-Time Intelligence
This month includes the announcement of Real-Time Intelligence, the next evolution of Real-Time Analytics and Data Activator. With Real-Time Intelligence, Fabric extends to the world of streaming and high granularity data, enabling all users in your organization to collect, analyze and act on this data in a timeline manner making faster and more informed business decisions. Read the full announcement from Build 2024.
Real-Time Intelligence includes a wide range of capabilities across ingestion, processing, analysis, transformation, visualization and taking action. All of this is supported by the Real-Time hub, the central place to discover and manage streaming data and start all related tasks.
Read on for more information on each capability and stay tuned for a series of blogs describing the features in more detail. All features are in Public Preview unless otherwise specified. Feedback on any of the features can be submitted at https://aka.ms/rtiidea
Ingest & Process
- Introducing the Real-Time hub
- Get Events with new sources of streaming and event data
- Source from Real-Time Hub in Enhanced Eventstream
- Use Real-Time hub to Get Data in KQL Database in Eventhouse
- Get data from Real-Time Hub within Reflexes
- Eventstream Edit and Live modes
- Default and derived streams
- Route data streams based on content
Analyze & Transform
- Eventhouse GA
- Eventhouse OneLake availability GA
- Create a database shortcut to another KQL Database
- Support for AI Anomaly Detector
- Copilot for Real-Time Intelligence
- Tenant-level private endpoints for Eventhouse
Visualize & Act
- Visualize data with Real-Time Dashboards
- New experience for data exploration
- Create triggers from Real-Time Hub
- Set alert on Real-time Dashboards
- Taking action through Fabric Items
Ingest & Process
Real-Time hub is the single place for all data-in-motion across your entire organization. Several key features are offered in Real-Time hub:
1. Single place for data-in-motion for the entire organization
Real-Time hub enables users to easily discover, ingest, manage, and consume data-in-motion from a wide variety of sources. It lists all the streams and KQL tables that customers can directly act on.
2. Real-Time hub is never empty
All data streams in Fabric automatically show up in the hub. Also, users can subscribe to events in Fabric gaining insights into the health and performance of their data ecosystem.
3. Numerous connectors to simplify data ingestion from anywhere to Real-Time hub
Real-Time hub makes it easy for you to ingest data into Fabric from a wide variety of sources like AWS Kinesis, Kafka clusters, Microsoft streaming sources, sample data and Fabric events using the Get Events experience.
There are 3 tabs in the hub:
- Data streams : This tab contains all streams that are actively running in Fabric that user has access to. This includes all streams from Eventstreams and all tables from KQL Databases.
- Microsoft sources : This tab contains Microsoft sources (that user has access to) and can be connected to Fabric.
- Fabric events : Fabric now has event-driven capabilities to support real-time notifications and data processing. Users can monitor and react to events including Fabric Workspace Item events and Azure Blob Storage events. These events can be used to trigger other actions or workflows, such as invoking a data pipeline or sending a notification via email. Users can also send these events to other destinations via Event Streams.
Learn More
You can now connect to data from both inside and outside of Fabric in a mere few steps. Whether data is coming from new or existing sources, streams, or available events, the Get Events experience allows users to connect to a wide range of sources directly from Real-Time hub, Eventstreams, Eventhouse and Data Activator.
This enhanced capability allows you to easily connect external data streams into Fabric with out-of-box experience, giving you more options and helping you to get real-time insights from various sources. This includes Camel Kafka connectors powered by Kafka connect to access popular data platforms, as well as the Debezium connectors for fetching the Change Data Capture (CDC) streams.
Using Get Events, bring streaming data from Microsoft sources directly into Fabric with a first-class experience. Connectivity to notification sources and discrete events is also included, this enables access to notification events from Azure and other clouds solutions including AWS and GCP. The full set of sources which are currently supported are:
- Microsoft sources : Azure Event Hubs, Azure IoT hub
- External sources : Google Cloud Pub/Sub, Amazon Kinesis Data Streams, Confluent Cloud Kafka
- Change data capture databases : Azure SQL DB (CDC), PostgreSQL DB (CDC), Azure Cosmos DB (CDC), MySQL DB (CDC)
- Fabric events : Fabric Workspace Item events, Azure Blob Storage events
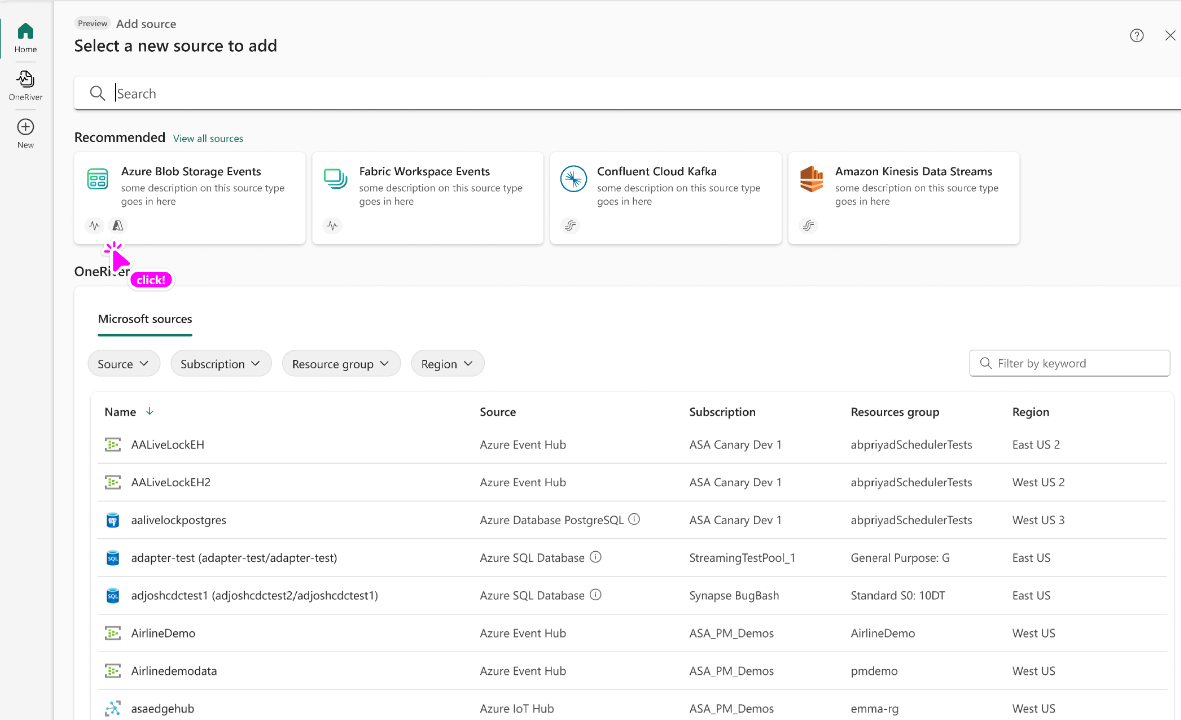
Learn More
With enhanced Eventstream, you can now stream data not only from Microsoft sources but also from other platforms like Google Cloud, Amazon Kinesis, Database change data capture streams, etc. using our new messaging connectors. The new Eventstream also lets you acquire and route real-time data not only from stream sources but also from discrete event sources, such as: Azure Blob Storage events, Fabric Workspace Item events.
To use these new sources in Eventstream, simply create an eventstream with choosing “Enhanced Capabilities (preview)”.
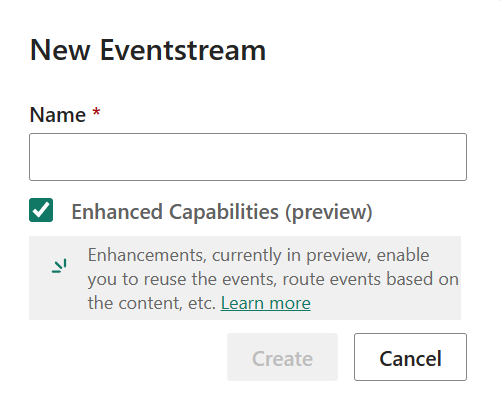
You will see the new Eventstream homepage that gives you some choices to begin with. By clicking on the “Add external source”, you will find these sources in the Get events wizard that helps you to set up the source in a few steps. After you add the source to your eventstream, you can publish it to stream the data into your eventstream.
Using Eventstream with discrete sources to turn events into streams for more analysis. You can send the streams to different Fabric data destinations, like Lakehouse and KQL Database. After the events are converted, a default stream will appear in Real-Time Hub. To turn them, click Edit on ribbon, select “Stream events” on the source node, and publish your eventstream.
To transform the stream data or route it to different Fabric destinations based on its content, you can click Edit in ribbon and enter the Edit mode. There you can add event processing operators and destinations.
With Real-Time hub embedded in KQL Database experience, each user in the tenant can view and add streams which they have access to and directly ingest it to a KQL Database table in Eventhouse.
This integration provides each user in the tenant with the ability to access and view data streams they are permitted to. They can now directly ingest these streams into a KQL Database table in Eventhouse. This simplifies the data discovery and ingestion process by allowing users to directly interact with the streams. Users can filter data based on the Owner, Parent and Location and provides additional information such as Endorsement and Sensitivity.
You can access this by clicking on the Get Data button from the Database ribbon in Eventhouse.

This will open the Get Data wizard with Real-Time hub embedded.
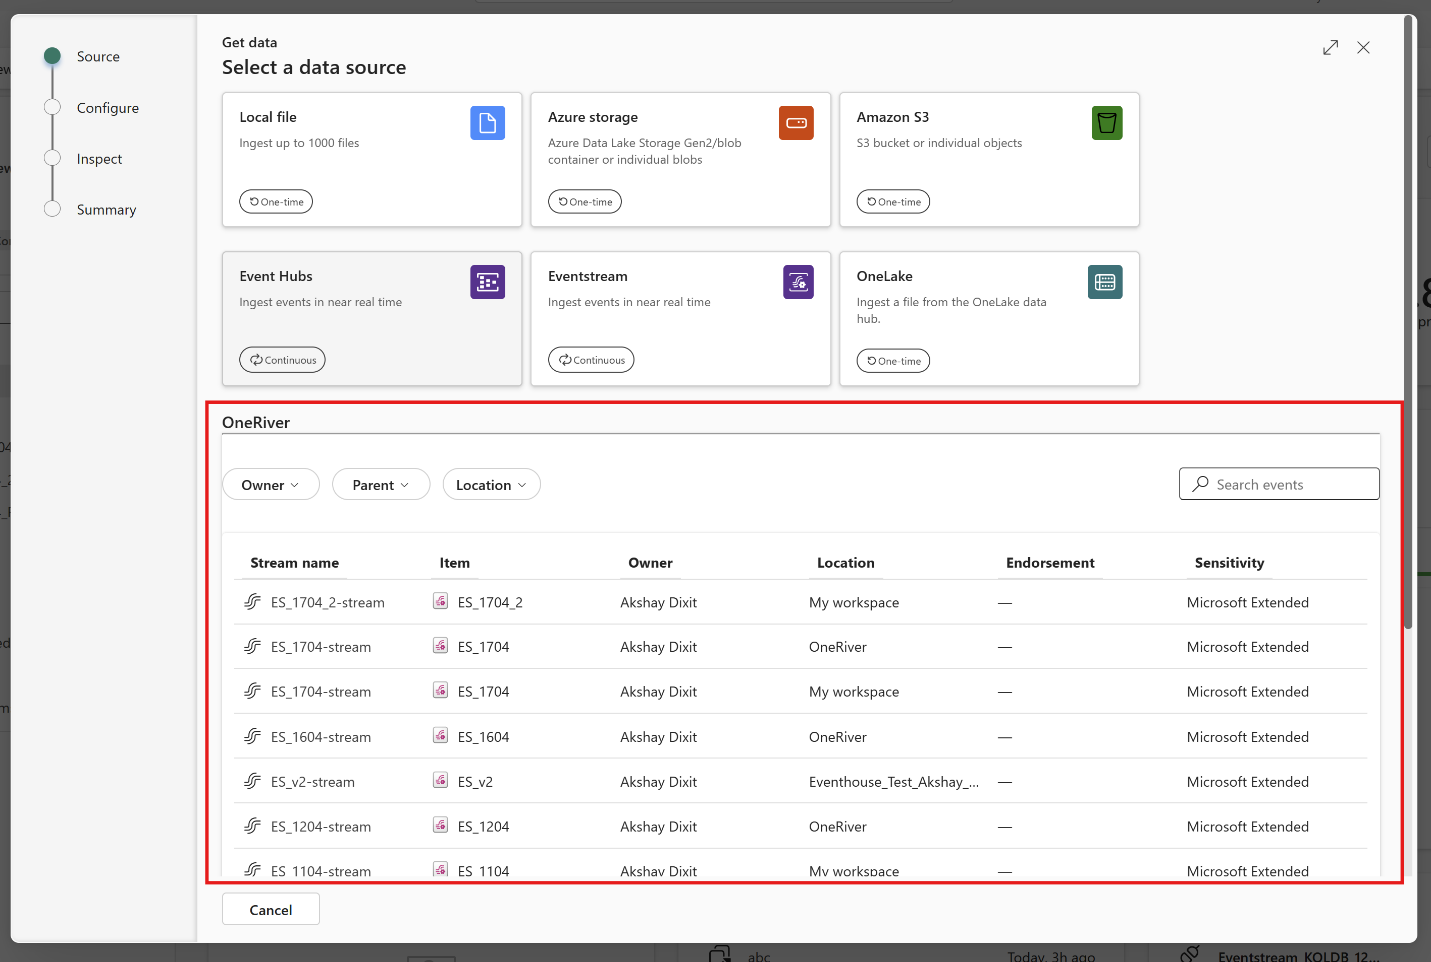
You can use events from Real-Time hub directly in reflex items as well. From within the main reflex UI, click ‘Get data’ in the toolbar:
This will open a wizard that allows you to connect to new event sources or browse Real-Time Hub to use existing streams or system events.
Search new stream sources to connect to or select existing streams and tables to be ingested directly by Reflex.
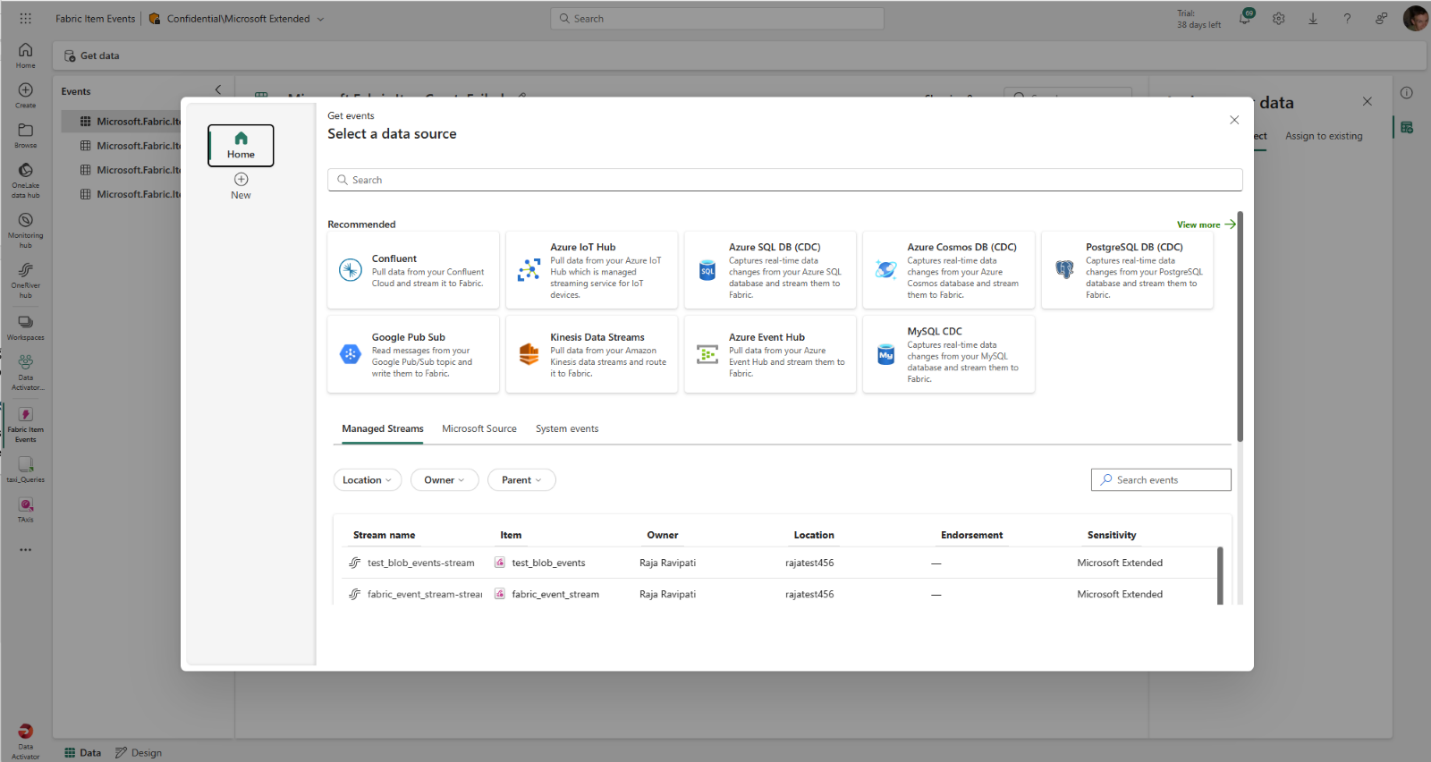
You then have access to the full reflex modeling experience to build properties and triggers over any events from Real-Time hub.
Eventstream offers two distinct modes, Edit and Live, to provide flexibility and control over the development process of your eventstream. If you create a new Eventstream with Enhanced Capabilities enabled, you can modify it in an Edit mode. Here, you can design stream processing operations for your data streams using a no-code editor. Once you complete the editing, you can publish your Eventstream and visualize how it starts streaming and processing data in Live mode .
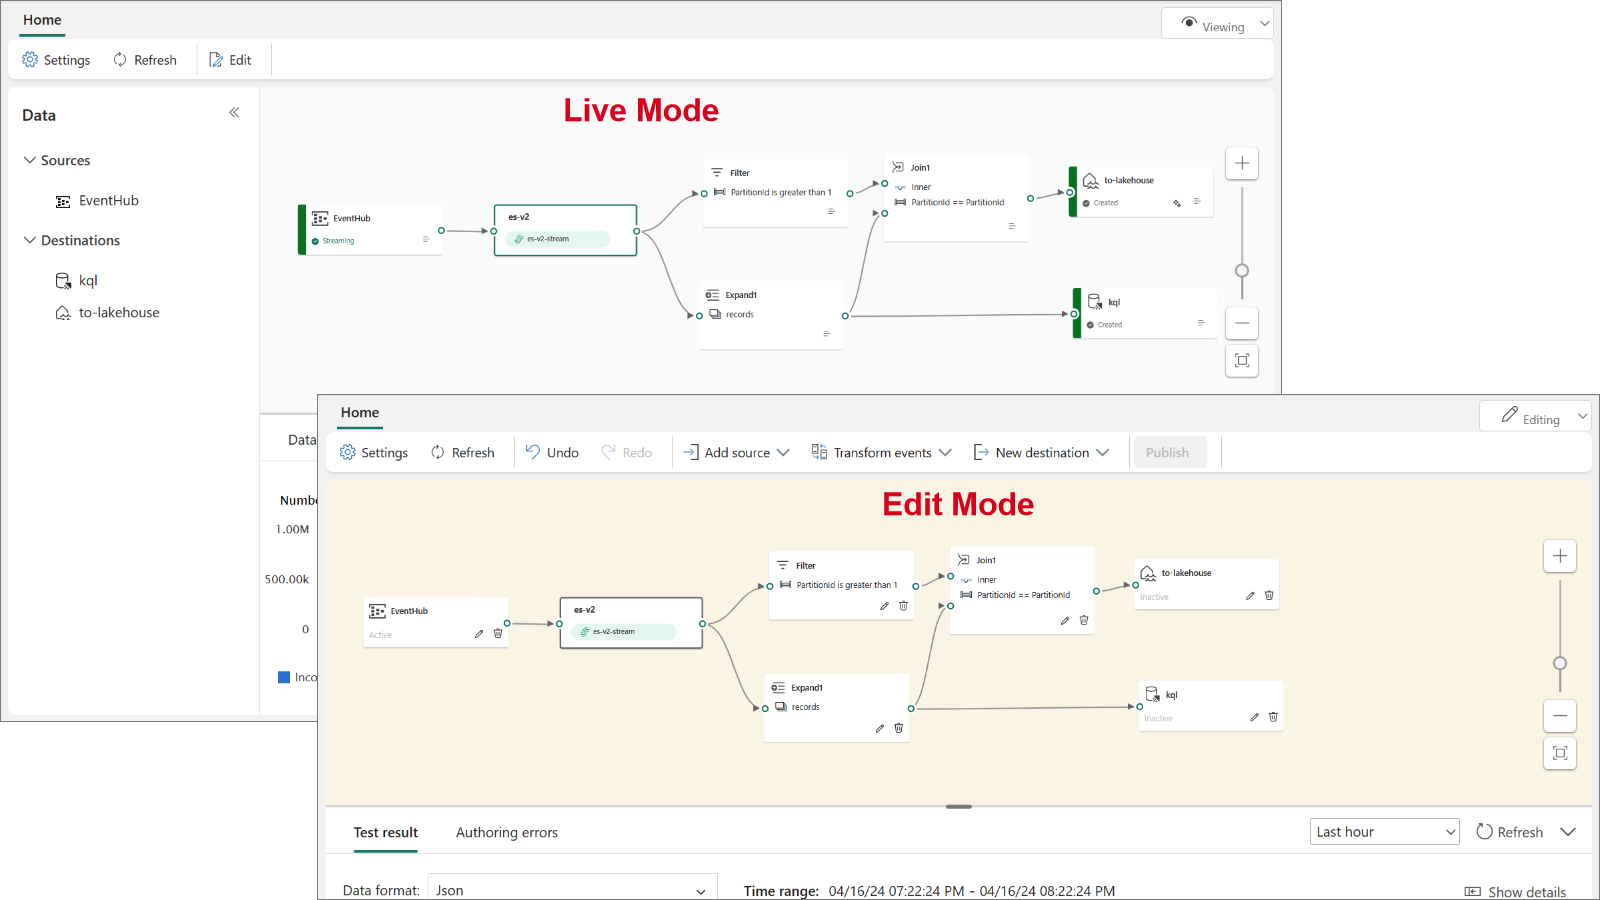
In Edit mode, you can:
- Make changes to an Eventstream without implementing them until you publish the Eventstream. This gives you full control over the development process.
- Avoid test data being streamed to your Eventstream. This mode is designed to provide a secure environment for testing without affecting your actual data streams.
For Live mode, you can :
- Visualize how your Eventstream streams, transforms, and routes your data streams to various destinations after publishing the changes.
- Pause the flow of data on selected sources and destinations, providing you with more control over your data streams being streamed into your Eventstream.
When you create a new Eventstream with Enhanced Capabilities enabled, you can now create and manage multiple data streams within Eventstream, which can then be displayed in the Real-Time hub for others to consume and perform further analysis.
There are two types of streams:
- Default stream : Automatically generated when a streaming source is added to Eventstream. Default stream captures raw event data directly from the source, ready for transformation or analysis.
- Derived stream : A specialized stream that users can create as a destination within Eventstream. Derived stream can be created after a series of operations such as filtering and aggregating, and then it’s ready for further consumption or analysis by other users in the organization through the Real-Time Hub.
The following example shows that when creating a new Eventstream a default stream alex-es1-stream is automatically generated. Subsequently, a derived stream dstream1 is added after an Aggregate operation within the Eventstream. Both default and derived streams can be found in the Real-Time hub.
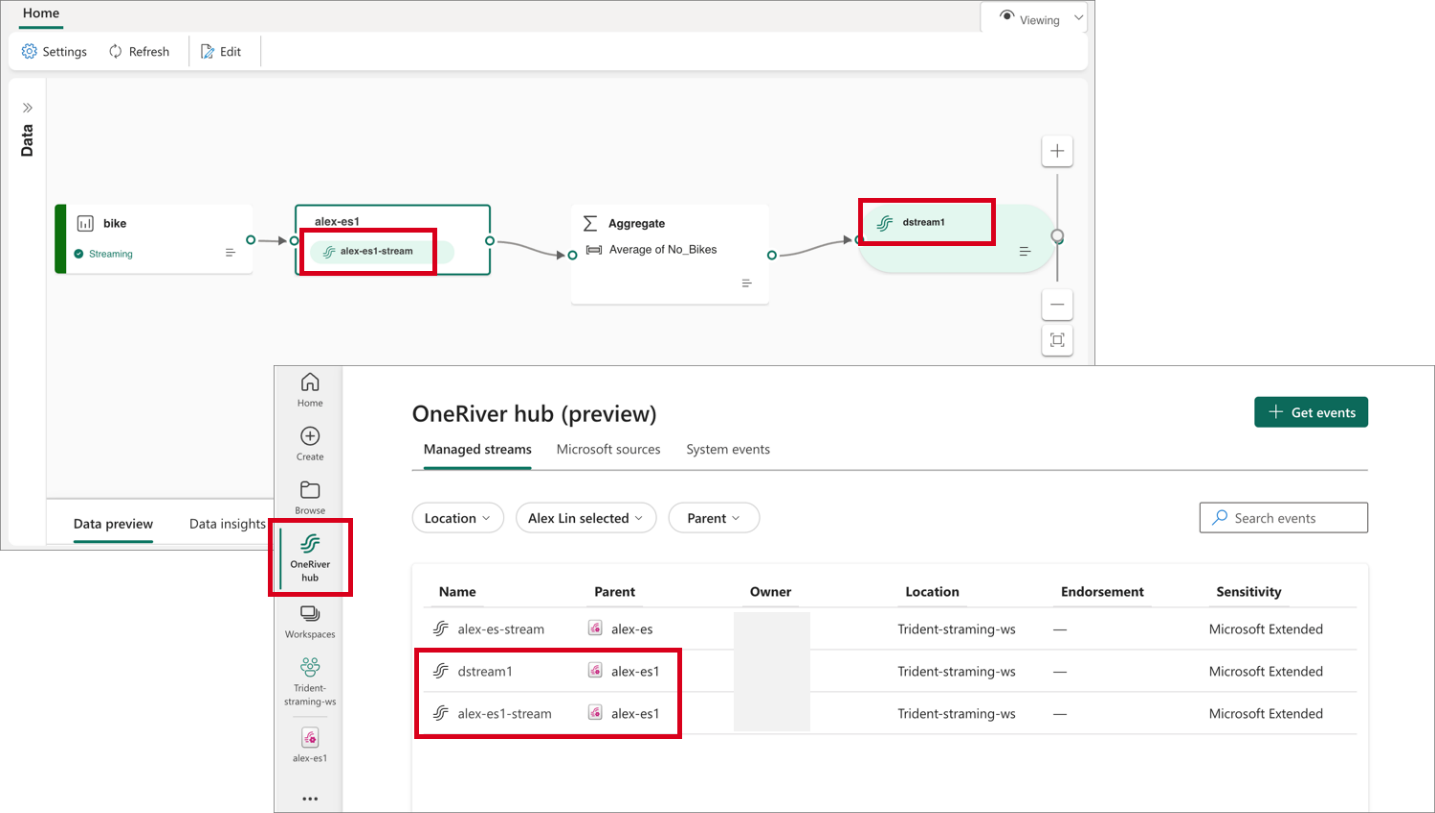
Customers can now perform stream operations directly within Eventstream’s Edit mode, instead of embedding in a destination. This enhancement allows you to design stream processing logics and route data streams in the top-level canvas. Custom processing and routing can be applied to individual destinations using built-in operations, allowing for routing to distinct destinations within the Eventstream based on different stream content.
These operations include:
- Aggregate : Perform calculations such as SUM, AVG, MIN, and MAX on a column of values and return a single result.
- Expand : Expand array values and create new rows for each element within the array.
- Filter : Select or filter specific rows from the data stream based on a condition.
- Group by : Aggregate event data within a certain time window, with the option to group one or more columns.
- Manage Fields : Customize your data streams by adding, removing, or changing data type of a column.
- Union : Merge two or more data streams with shared fields (same name and data type) into a unified data stream.
Analyze & Transform
Eventhouse, a cutting-edge database workspace meticulously crafted to manage and store event-based data, is now officially available for general use. Optimized for high granularity, velocity, and low latency streaming data, it incorporates indexing and partitioning for structured, semi-structured, and free text data. With Eventhouse, users can perform high-performance analysis of big data and real-time data querying, processing billions of events within seconds. The platform allows users to organize data into compartments (databases) within one logical item, facilitating efficient data management.
Additionally, Eventhouse enables the sharing of compute and cache resources across databases, maximizing resource utilization. It also supports high-performance queries across databases and allows users to apply common policies seamlessly. Eventhouse offers content-based routing to multiple databases, full view lineage, and high granularity permission control, ensuring data security and compliance. Moreover, it provides a simple migration path from Azure Synapse Data Explorer and Azure Data Explorer, making adoption seamless for existing users.
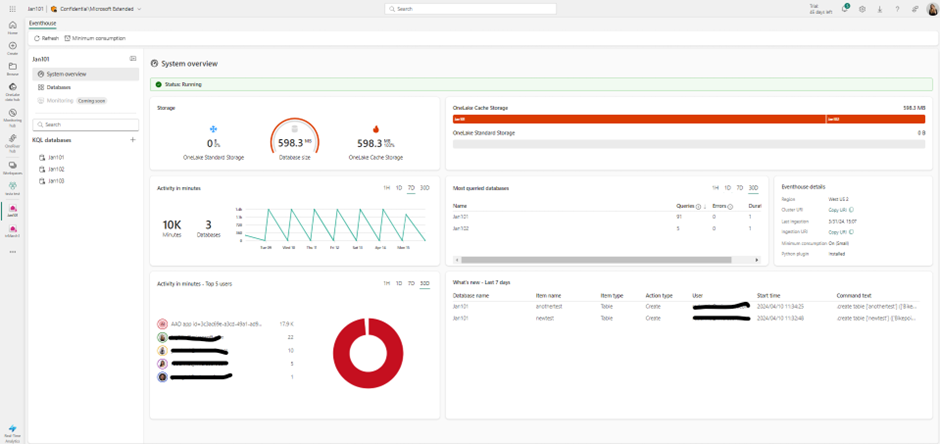
Engineered to handle data in motion, Eventhouse seamlessly integrates indexing and partitioning into its storing process, accommodating various data formats. This sophisticated design empowers high-performance analysis with minimal latency, facilitating lightning-fast ingestion and querying within seconds. Eventhouse is purpose-built to deliver exceptional performance and efficiency for managing event-based data across diverse applications and industries. Its intuitive features and seamless integration with existing Azure services make it an ideal choice for organizations looking to leverage real-time analytics for actionable insights. Whether it’s analyzing telemetry and log data, time series and IoT data, or financial records, Eventhouse provides the tools and capabilities needed to unlock the full potential of event-based data.
We’re excited to announce that OneLake availability of Eventhouse in Delta Lake format is Generally Available.
Delta Lake is the unified data lake table format chosen to achieve seamless data access across all compute engines in Microsoft Fabric.
The data streamed into Eventhouse is stored in an optimized columnar storage format with full text indexing and supports complex analytical queries at low latency on structured, semi-structured, and free text data.
Enabling data availability of Eventhouse in OneLake means that customers can enjoy the best of both worlds: they can query the data with high performance and low latency in their Eventhouse and query the same data in Delta Lake format via any other Fabric engines such as Power BI Direct Lake mode, Warehouse, Lakehouse, Notebooks, and more.
To learn more, please visit https://learn.microsoft.com/en-gb/fabric/real-time-analytics/one-logical-copy
A database shortcut in Eventhouse is an embedded reference to a source database. The source database can be one of the following:
- (Now Available) A KQL Database in Real-Time Intelligence
- An Azure Data Explorer database
The behavior exhibited by the database shortcut is similar to that of a follower database
The owner of the source database, the data provider, shares the database with the creator of the shortcut in Real-Time Intelligence, the data consumer. The owner and the creator can be the same person. The database shortcut is attached in read-only mode, making it possible to view and run queries on the data that was ingested into the source KQL Database without ingesting it.
This helps with data sharing scenarios where you can share data in-place either within teams, or even with external customers.
AI Anomaly Detector is an Azure service for high quality detection of multivariate and univariate anomalies in time series. While the standalone version is being retired October 2026, Microsoft open sourced the anomaly detection core algorithms and they are now supported in Microsoft Fabric. Users can leverage these capabilities in Data Science and Real-Time Intelligence workload. AI Anomaly Detector models can be trained in Spark Python notebooks in Data Science workload, while real time scoring can be done by KQL with inline Python in Real-Time Intelligence.
We are excited to announce the Public Preview of Copilot for Real-Time Intelligence. This initial version includes a new capability that translates your natural language questions about your data to KQL queries that you can run and get insights.
Your starting point is a KQL Queryset, that is connected to a KQL Database, or to a standalone Kusto database:
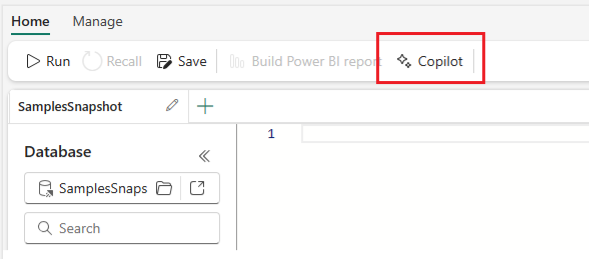
Simply type the natural language question about what you want to accomplish, and Copilot will automatically translate it to a KQL query you can execute. This is extremely powerful for users who may be less familiar with writing KQL queries but still want to get the most from their time-series data stored in Eventhouse.
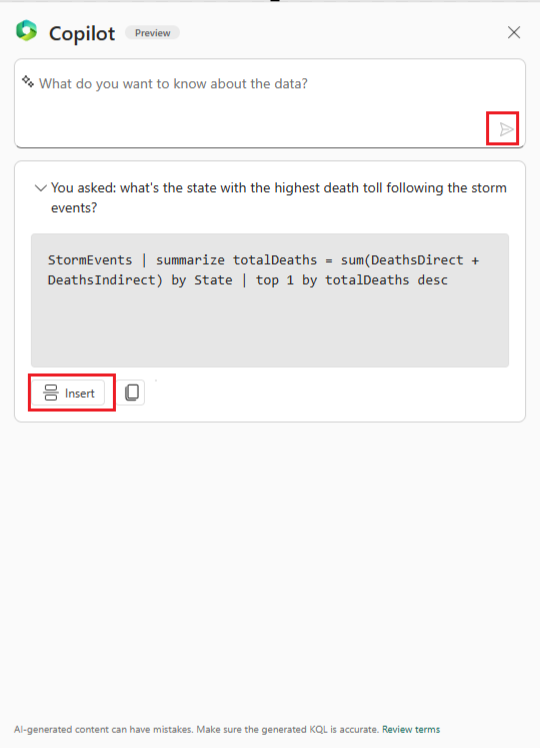
Stay tuned for more capabilities from Copilot for Real-Time Intelligence!
Customers can increase their network security by limiting access to Eventhouse at a tenant-level, from one or more virtual networks (VNets) via private links. This will prevent unauthorized access from public networks and only permit data plane operations from specific VNets.
Visualize & Act
Real-Time Dashboards have a user-friendly interface, allowing users to quickly explore and analyze their data without the need for extensive technical knowledge. They offer a high refresh frequency, support a range of customization options, and are designed to handle big data.
The following visual types are supported, and can be customized with the dashboard’s user-friendly interface:

You can also define conditional formatting rules to format the visual data points by their values using colors, tags, and icons. Conditional formatting can be applied to a specific set of cells in a predetermined column or to entire rows, and lets you easily identify interesting data points.
Beyond the support visual, Real-Time Dashboards provide several capabilities to allow you to interact with your data by performing slice and dice operations for deeper analysis and gaining different viewpoints.
- Parameters are used as building blocks for dashboard filters and can be added to queries to filter the data presented by visuals. Parameters can be used to slice and dice dashboard visuals either directly by selecting parameter values in the filter bar or by using cross-filters.
- Cross filters allow you to select a value in one visual and filter all other visuals on that dashboard based on the selected data point.
- Drillthrough capability allows you to select a value in a visual and use it to filter the visuals in a target page in the same dashboard. When the target page opens, the value is pushed to the relevant filters.
Real-Time Dashboards can be shared broadly and allow multiple stakeholders to view dynamic, real time, fresh data while easily interacting with it to gain desired insights.
Directly from a real-time dashboard, users can refine their exploration using a user-friendly, form-like interface. This intuitive and dynamic experience is tailored for insights explorers craving insights based on real-time data. Add filters, create aggregations, and switch visualization types without writing queries to easily uncover insights.
With this new feature, insights explorers are no longer bound by the limitations of pre-defined dashboards. As independent explorers, they have the freedom for ad-hoc exploration, leveraging existing tiles to kickstart their journey. Moreover, they can selectively remove query segments, and expand their view of the data landscape.
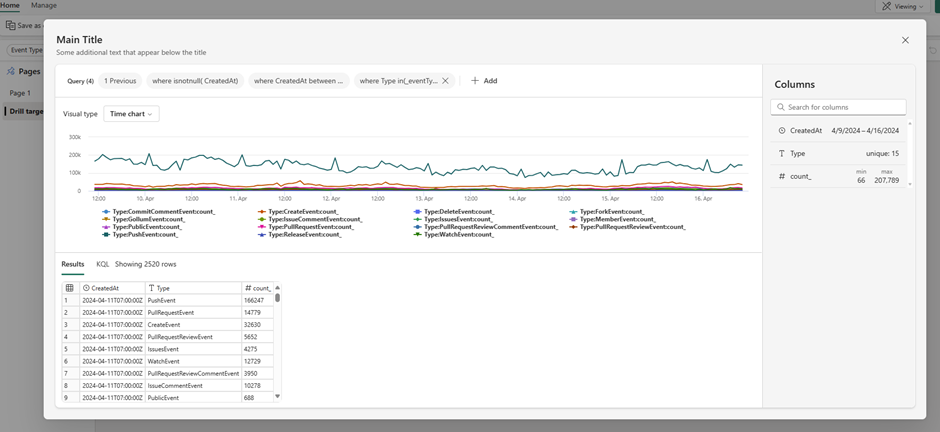
Dive deep, extract meaningful insights, and chart actionable paths forward, all with ease and efficiency, and without having to write complex KQL queries.
Data Activator allows you to monitor streams of data for various conditions and set up actions to be taken in response. These triggers are available directly within the Real-Time hub and in other workloads in Fabric. When the condition is detected, an action will automatically be kicked off such as sending alerts via email or Teams or starting jobs in Fabric items.
When you browse the Real-Time Hub, you’ll see options to set triggers in the detail pages for streams.

Selecting this will open a side panel where you can configure the events you want to monitor, the conditions you want to look for in the events, and the action you want to take while in the Real-Time hub experience.
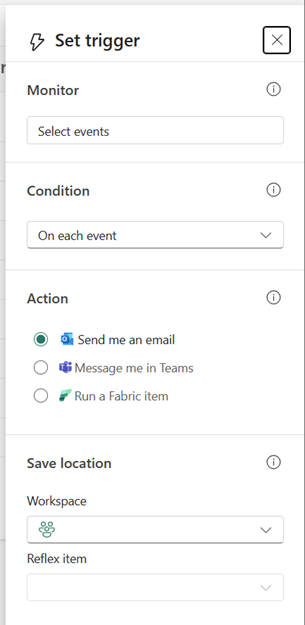
Completing this pane creates a new reflex item with a trigger that monitors the selected events and condition for you. Reflexes need to be created in a workspace supported by a Fabric or Power BI Premium capacity – this can be a trial capacity so you can get started with it today!
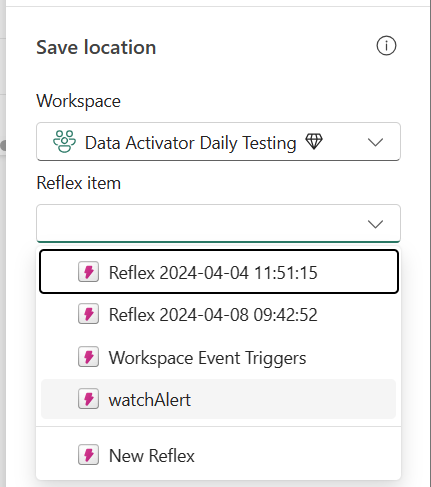
Data Activator has been able to monitor Power BI report data since it was launched, and we now support monitoring of Real-Time Dashboard visuals in the same way.
From real-time dashboard tiles you can click the ellipsis (…) button and select “Set alert”
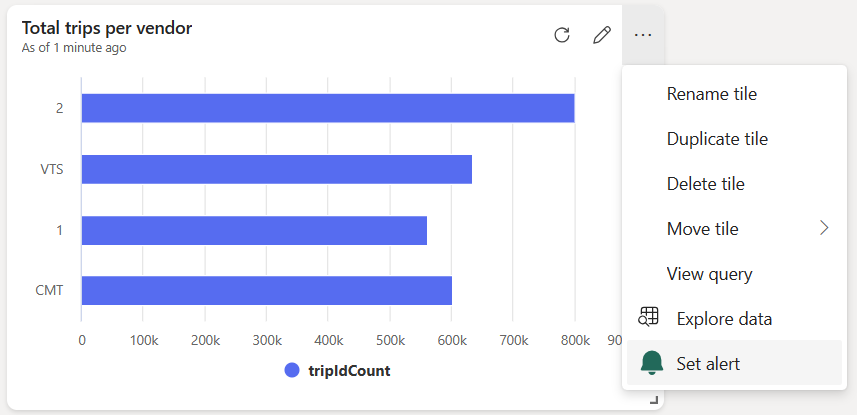
This opens the embedded trigger pane, where you can specify what conditions, you are looking for. You can choose whether to send email or Teams messages as the alert when these conditions are met.
When creating a new reflex trigger, from Real-time Hub or within the reflex item itself, you’ll notice a new ‘Run a Fabric item’ option in the Action section. This will create a trigger that starts a new Fabric job whenever its condition is met, kicking off a pipeline or notebook computation in response to Fabric events. A common scenario would be monitoring Azure Blob storage events via Real-Time Hub, and running data pipeline jobs when Blog Created events are detected.
This capability is extremely powerful and moves Fabric from a scheduled driven platform to an event driven platform.
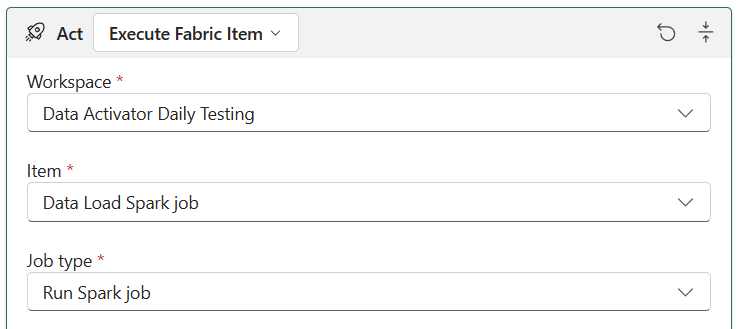
Pipelines, spark jobs, and notebooks are just the first Fabric items we’ll support here, and we’re keen to hear your feedback to help prioritize what else we support. Please leave ideas and votes on https://aka.ms/rtiidea and let us know!
Real-Time Intelligence, along with the Real-Time hub, revolutionizes what’s possible with real-time streaming and event data within Microsoft Fabric.
Learn more and try it today https://aka.ms/realtimeintelligence
Data Factory
Dataflow gen2 .
We are thrilled to announce that the Power Query SDK is now generally available in Visual Studio Code! This marks a significant milestone in our commitment to providing developers with powerful tools to enhance data connectivity and transformation.
The Power Query SDK is a set of tools that allow you as the developer to create new connectors for Power Query experiences available in products such as Power BI Desktop, Semantic Models, Power BI Datamarts, Power BI Dataflows, Fabric Dataflow Gen2 and more.
This new SDK has been in public preview since November of 2022, and we’ve been hard at work improving this experience which goes beyond what the previous Power Query SDK in Visual Studio had to offer.
The latest of these biggest improvements was the introduction of the Test Framework in March of 2024 that solidifies the developer experience that you can have within Visual Studio Code and the Power Query SDK for creating a Power Query connector.
The Power Query SDK extension for Visual Studio will be deprecated by June 30, 2024, so we encourage you to give this new Power Query SDK in Visual Studio Code today if you haven’t.
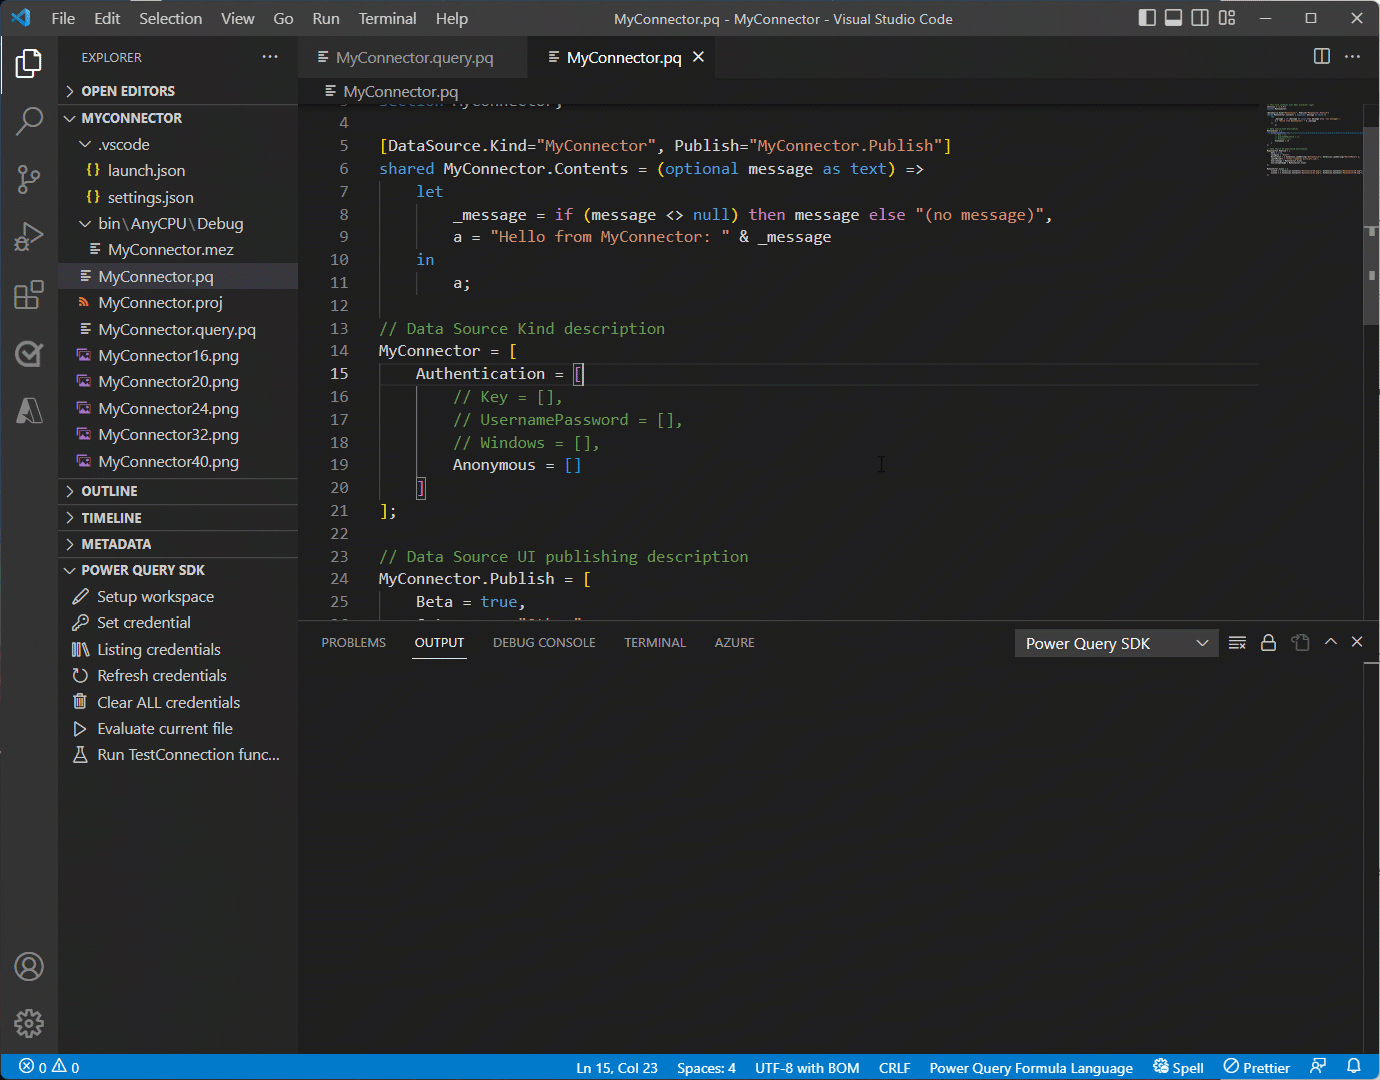
To get started with the Power Query SDK in Visual Studio Code, simply install it from the Visual Studio Code Marketplace . Our comprehensive documentation and tutorials are available to help you harness the full potential of your data.
Join our vibrant community of developers to share insights, ask questions, and collaborate on exciting projects. Our dedicated support team is always ready to assist you with any queries.
We look forward to seeing the innovative solutions you’ll create with the Power Query SDK in Visual Studio Code. Happy coding!
Introducing a convenient enhancement to the Dataflows Gen2 Refresh History experience! Now, alongside the familiar “X” button in the Refresh History screen, you’ll find a shiny new Refresh Button . This small but mighty addition empowers users to refresh the status of their dataflow refresh history status without the hassle of exiting the refresh history and reopening it. Simply click the Refresh Button , and voilà! Your dataflow’s refresh history status screen is updated, keeping you in the loop with minimal effort. Say goodbye to unnecessary clicks and hello to streamlined monitoring!
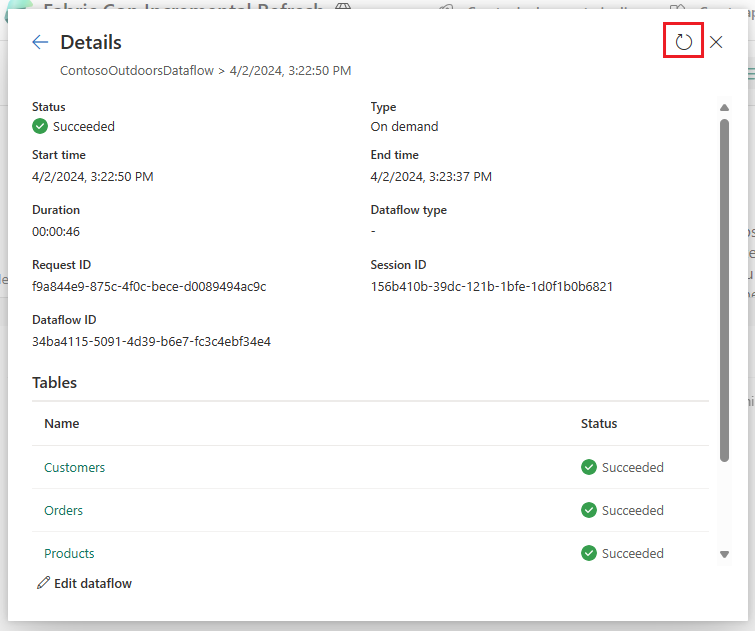
- [New] OneStream : The OneStream Power Query Connector enables you to seamlessly connect Data Factory to your OneStream applications by simply logging in with your OneStream credentials. The connector uses your OneStream security, allowing you to access only the data you have based on your permissions within the OneStream application. Use the connector to pull cube and relational data along with metadata members, including all their properties. Visit OneStream Power BI Connector to learn more. Find this connector in the other category.
Data workflows
We are excited to announce the preview of ‘Data workflows’, a new feature within the Data Factory that revolutionizes the way you build and manage your code-based data pipelines. Powered by Apache Airflow, Data workflows offer seamless authoring, scheduling, and monitoring experience for Python-based data processes defined as Directed Acyclic Graphs (DAGs). This feature brings a SaaS-like experience to running DAGs in a fully managed Apache Airflow environment, with support for autoscaling , auto-pause , and rapid cluster resumption to enhance cost-efficiency and performance.
It also includes native cloud-based authoring capabilities and comprehensive support for Apache Airflow plugins and libraries.
To begin using this feature:
- Access the Microsoft Fabric Admin Portal.
- Navigate to Tenant Settings.
Under Microsoft Fabric options, locate and expand the ‘Users can create and use Data workflows (preview)’ section. Note: This action is necessary only during the preview phase of Data workflows.
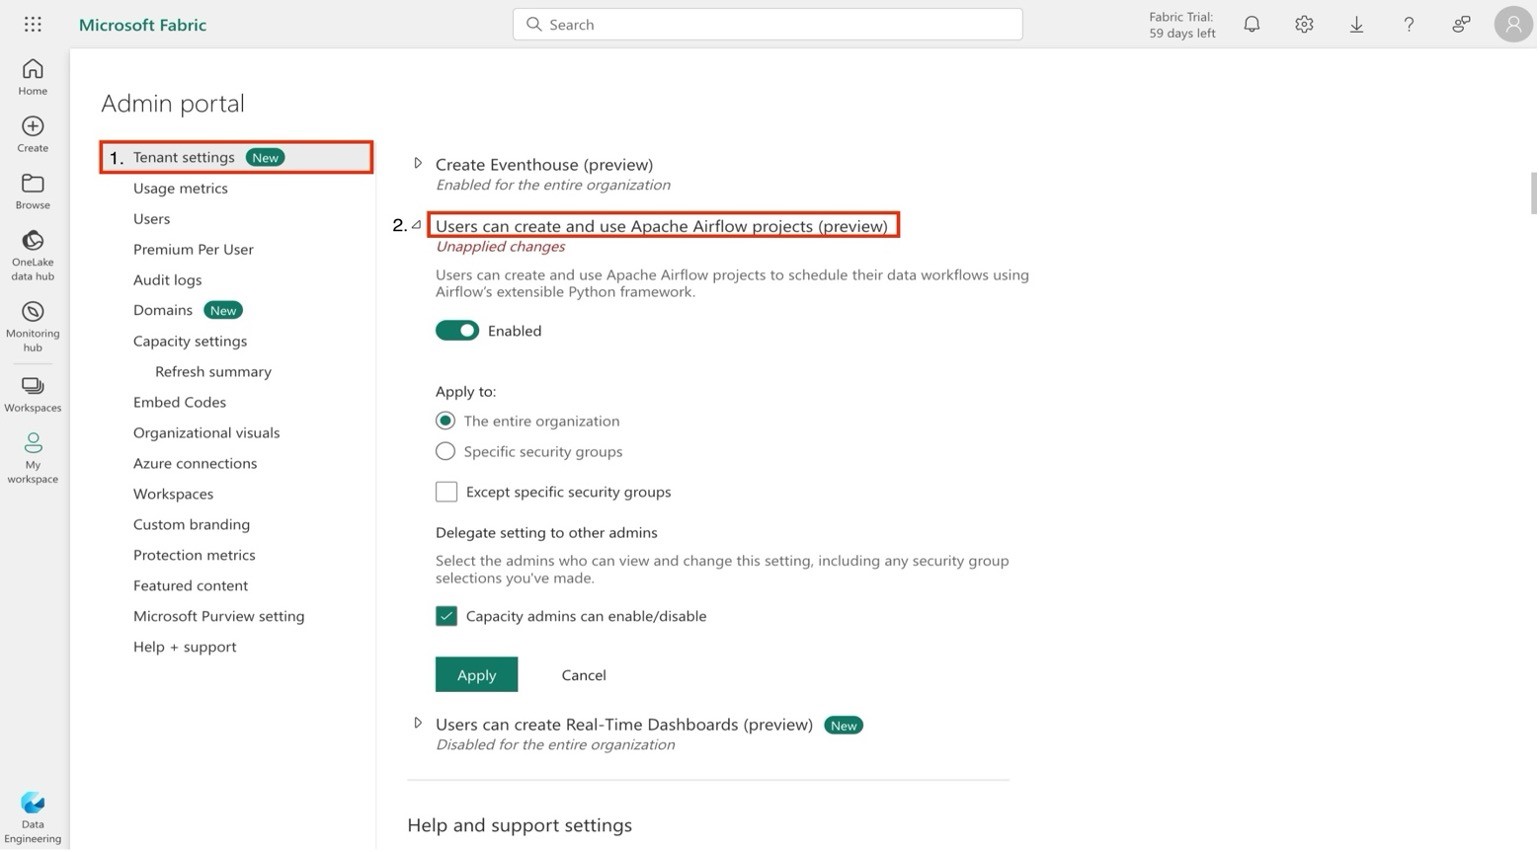
2. Create a new Data workflow within an existing or new workspace.
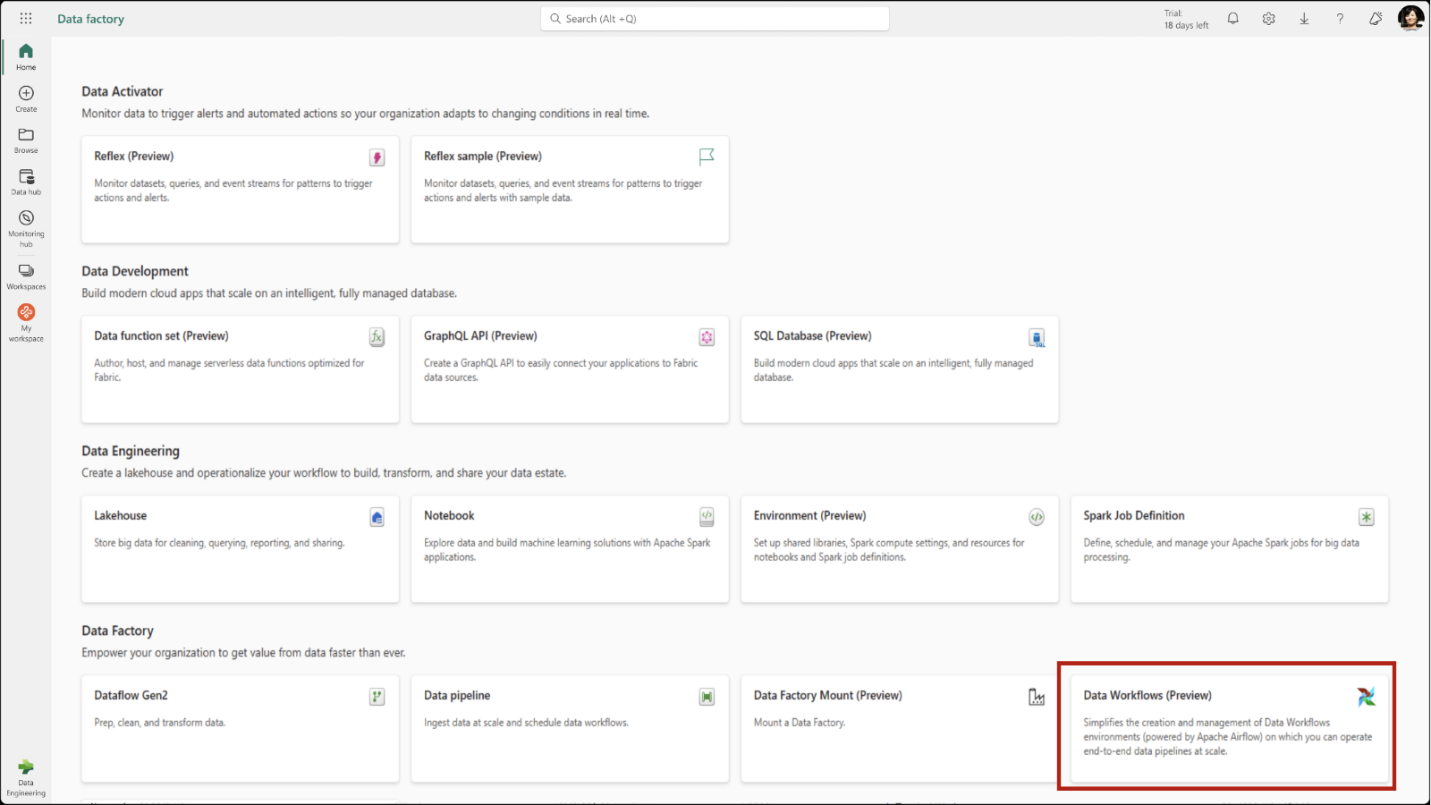
3. Add a new Directed Acyclic Graph (DAG) file via the user interface.
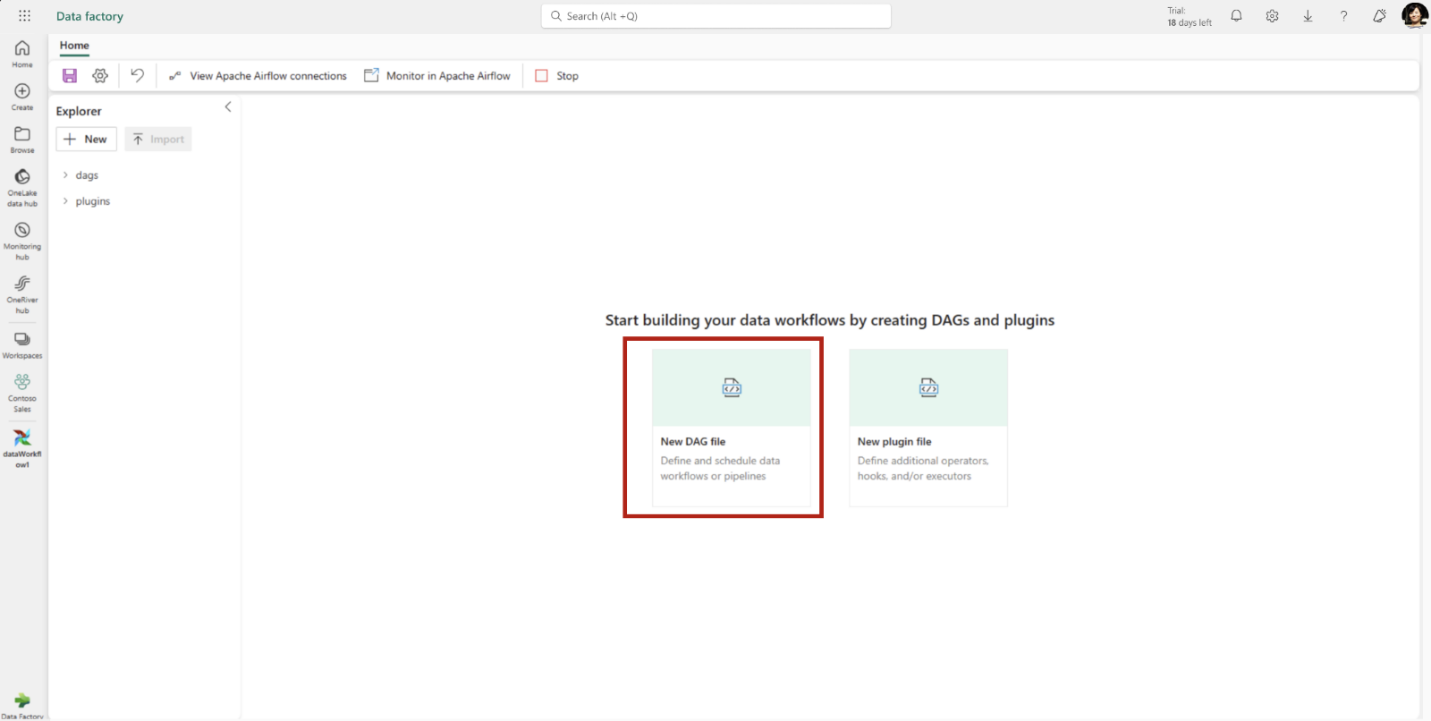
4. Save your DAG(s).
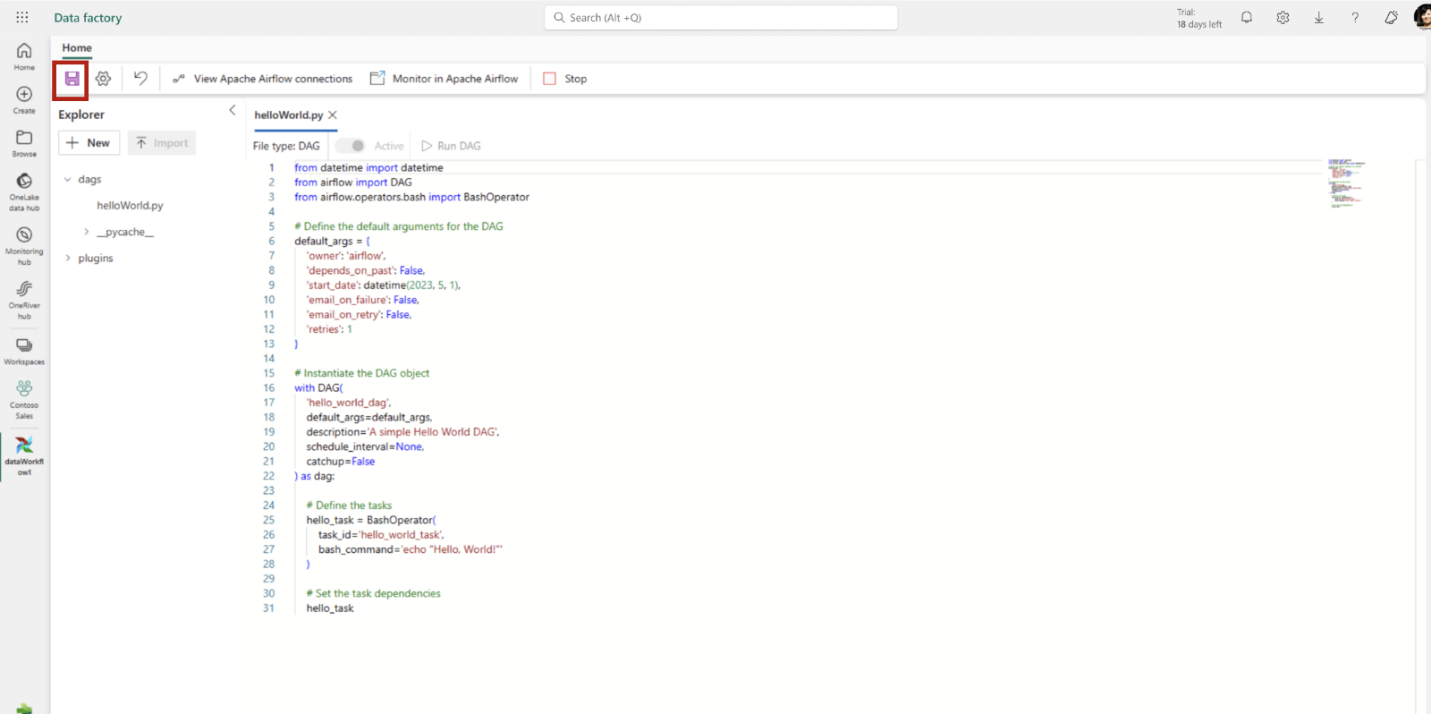
5. Use Apache Airflow monitoring tools to observe your DAG executions. In the ribbon, click on Monitor in Apache Airflow.
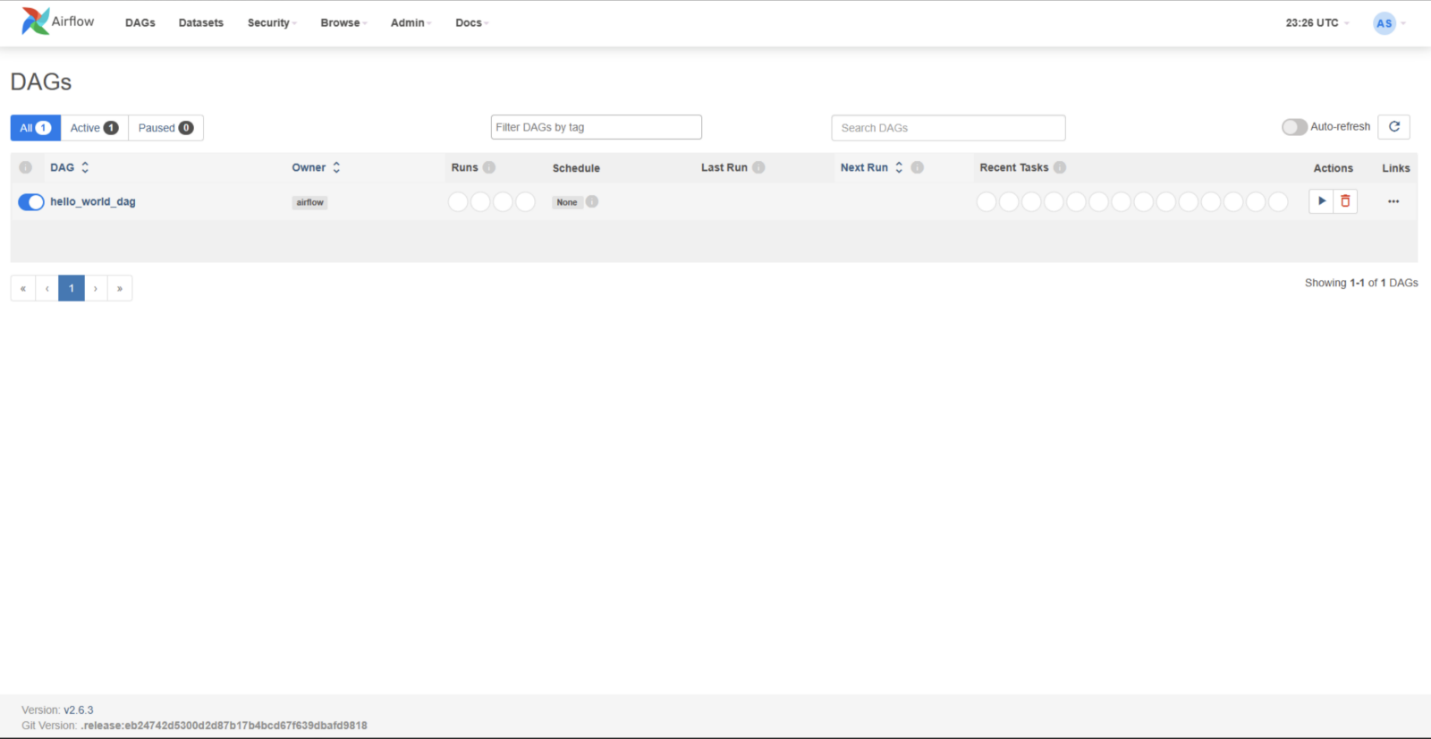
For additional information, please consult the product documentation . If you’re not already using Fabric capacity, consider signing up for the Microsoft Fabric free trial to evaluate this feature.
Data Pipelines
We are excited to announce a new feature in Fabric that enables you to create data pipelines to access your firewall-enabled Azure Data Lake Storage Gen2 (ADLS Gen2) accounts. This feature leverages the workspace identity to establish a secure and seamless connection between Fabric and your storage accounts.
With trusted workspace access, you can create data pipelines to your storage accounts with just a few clicks. Then you can copy data into Fabric Lakehouse and start analyzing your data with Spark, SQL, and Power BI. Trusted workspace access is available for workspaces in Fabric capacities (F64 or higher). It supports organizational accounts or service principal authentication for storage accounts.
How to use trusted workspace access in data pipelines
Create a workspace identity for your Fabric workspace. You can follow the guidelines provided in Workspace identity in Fabric .
Configure resource instance rules for the Storage account that you want to access from your Fabric workspace. Resource instance rules for Fabric workspaces can only be created through ARM templates. Follow the guidelines for configuring resource instance rules for Fabric workspaces here .
Create a data pipeline to copy data from the firewall enabled ADLS gen2 account to a Fabric Lakehouse.
To learn more about how to use trusted workspace access in data pipelines, please refer to Trusted workspace access in Fabric .
We hope you enjoy this new feature for your data integration and analytics scenarios. Please share your feedback and suggestions with us by leaving a comment here.
Introducing Blob Storage Event Triggers for Data Pipelines
A very common use case among data pipeline users in a cloud analytics solution is to trigger your pipeline when a file arrives or is deleted. We have introduced Azure Blob storage event triggers as a public preview feature in Fabric Data Factory Data Pipelines. This utilizes the Fabric Reflex alerts capability that also leverages Event Streams in Fabric to create event subscriptions to your Azure storage accounts.
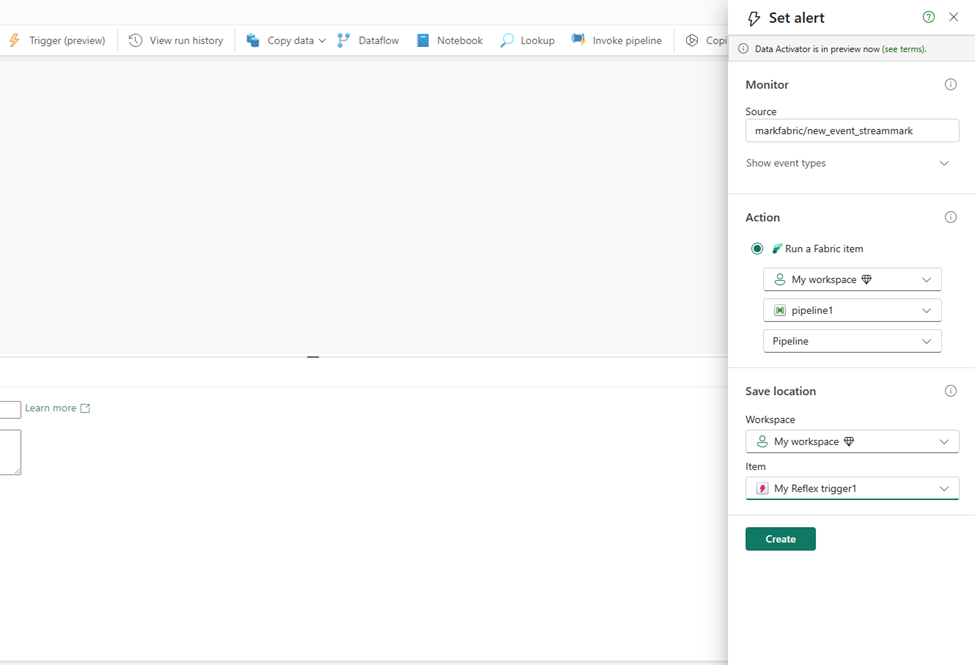
Parent/Child pipeline pattern monitoring improvements
Today, in Fabric Data Factory Data Pipelines, when you call another pipeline using the Invoke Pipeline activity, the child pipeline is not visible in the monitoring view. We have made updates to the Invoke Pipeline activity so that you can view your child pipeline runs. This requires an upgrade to any pipelines that you have in Fabric that already use the current Invoke Pipeline activity. You will be prompted to upgrade when you edit your pipeline and then provide a connection to your workspace to authenticate. Another additional new feature that will light up with this invoke pipeline activity update is the ability to invoke pipeline across workspaces in Fabric.
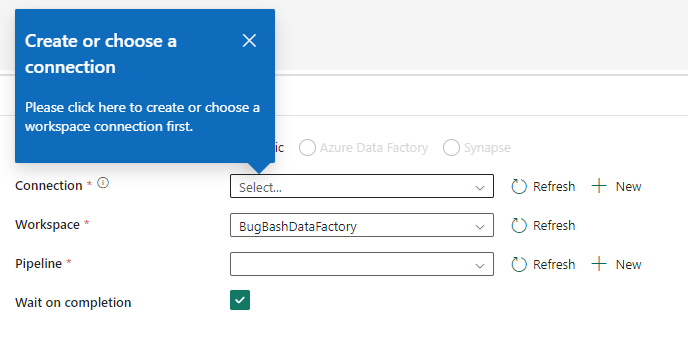
We are excited to announce the availability of the Fabric Spark job definition activity for data pipelines. With this new activity, you will be able to run a Fabric Spark Job definition directly in your pipeline. Detailed monitoring capabilities of your Spark Job definition will be coming soon!
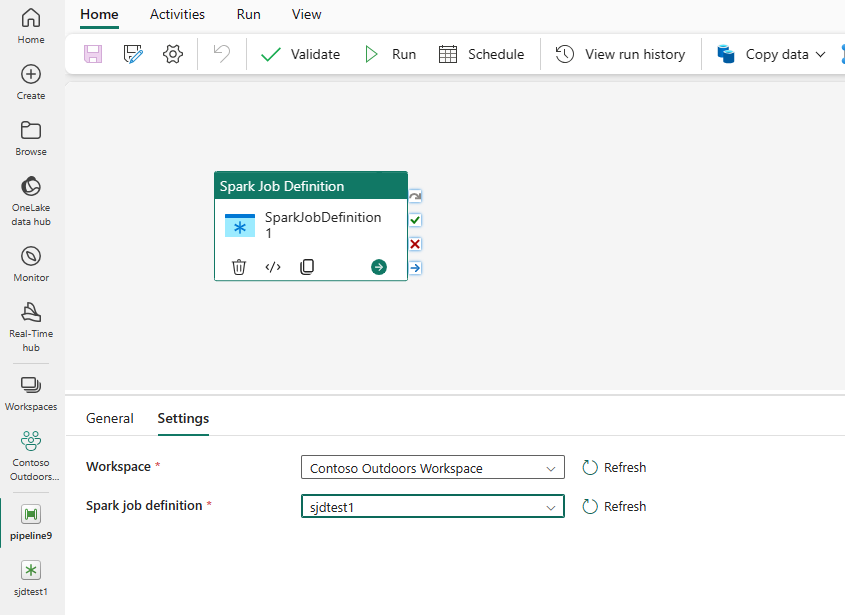
To learn more about this activity, read https://aka.ms/SparkJobDefinitionActivity
We are excited to announce the availability of the Azure HDInsight activity for data pipelines. The Azure HDInsight activity allows you to execute Hive queries, invoke a MapReduce program, execute Pig queries, execute a Spark program, or a Hadoop Stream program. Invoking either of the 5 activities can be done in a singular Azure HDInsight activity, and you can invoke this activity using your own or on-demand HDInsight cluster.
To learn more about this activity, read https://aka.ms/HDInsightsActivity
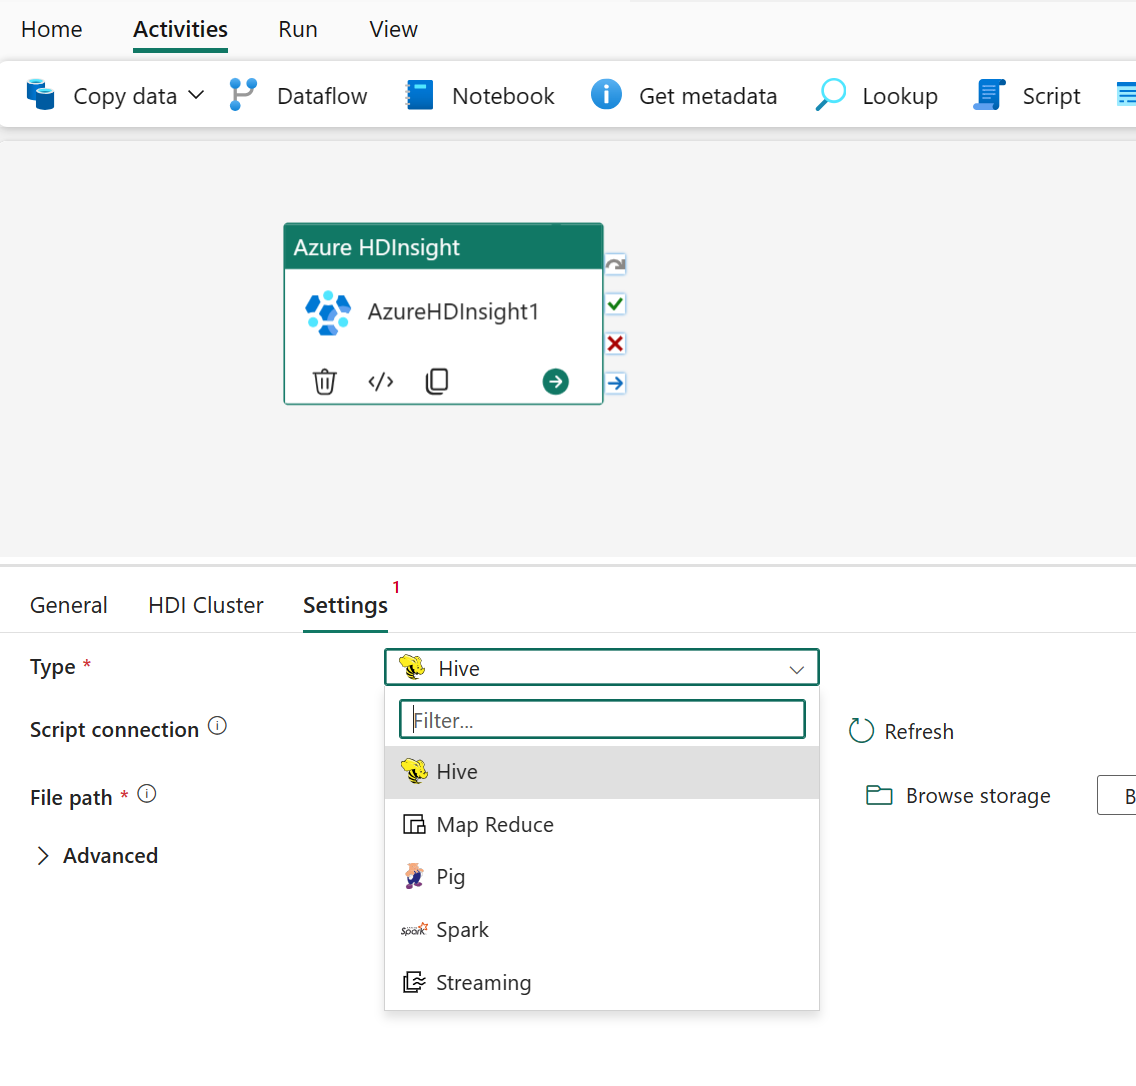
We are thrilled to share the new Modern Get Data experience in Data Pipeline to empower users intuitively and efficiently discover the right data, right connection info and credentials.
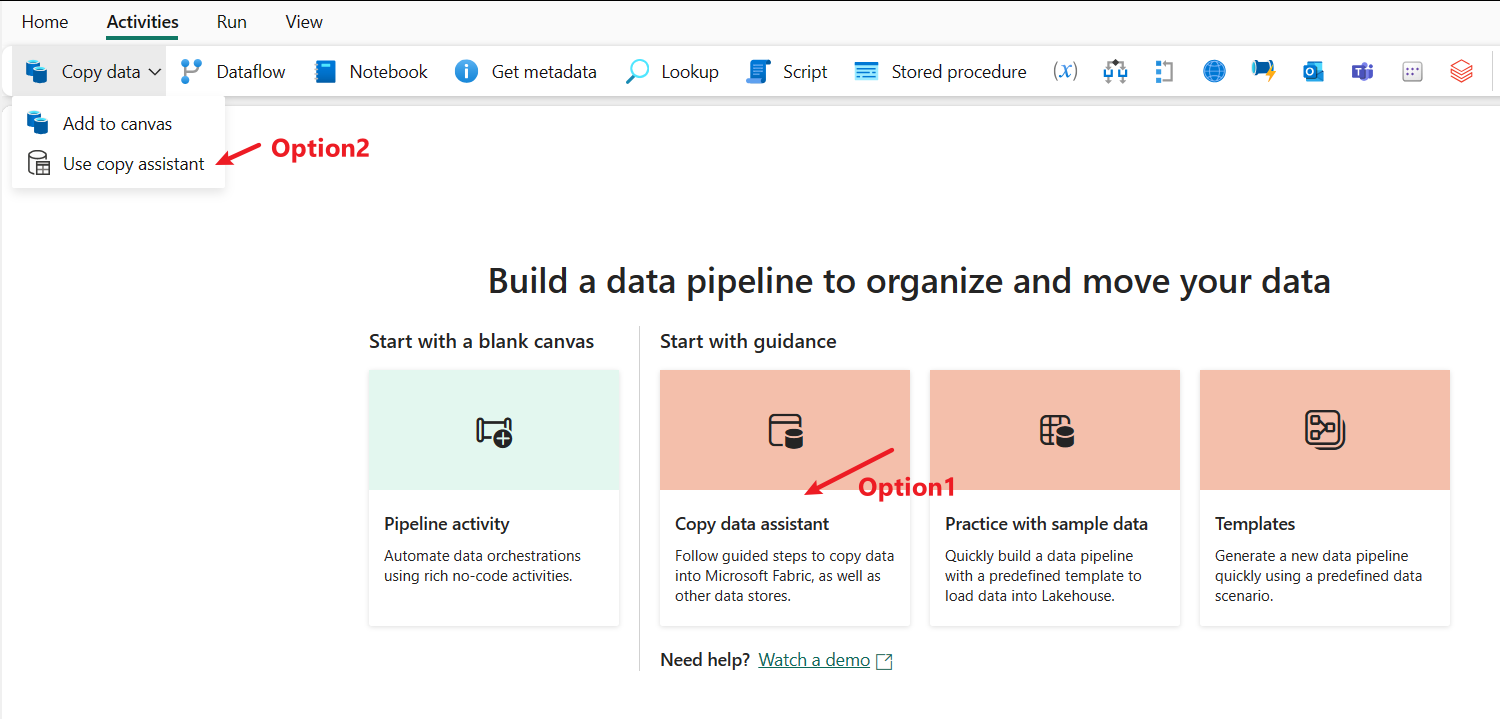
In the data destination, users can easily set destination by creating a new Fabric item or creating another destination or selecting existing Fabric item from OneLake data hub.
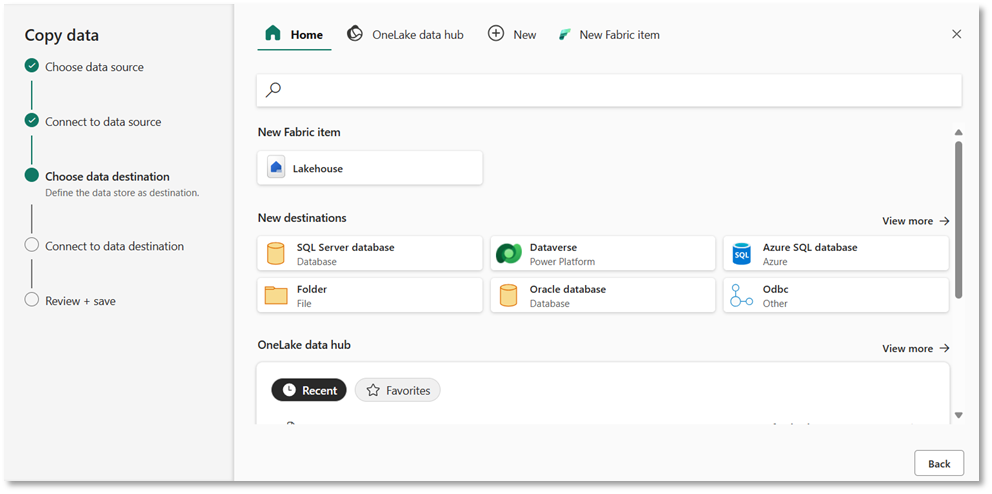
In the source tab of Copy activity, users can conveniently choose recent used connections from drop down or create a new connection using “More” option to interact with Modern Get Data experience.
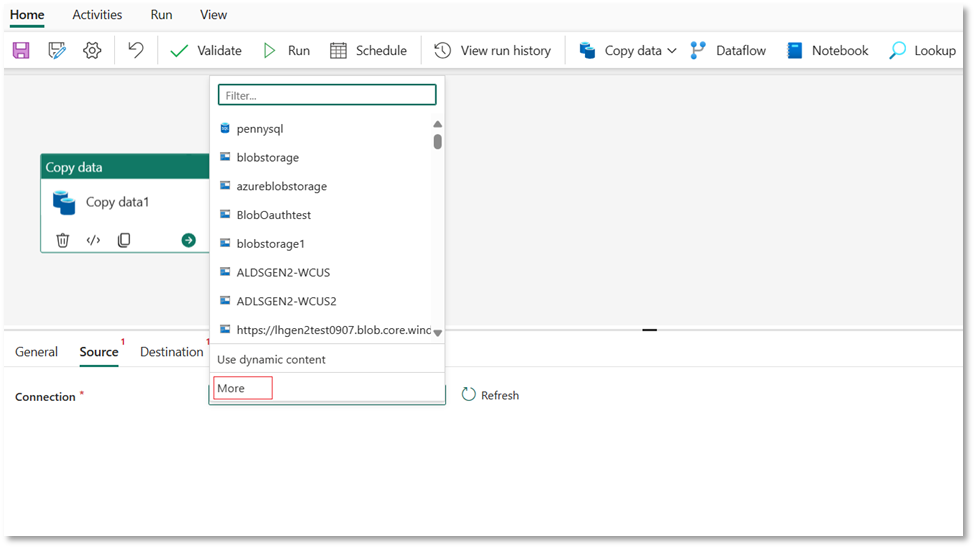
Related blog posts
Microsoft fabric april 2024 update.
Welcome to the April 2024 update! This month, you’ll find many great new updates, previews, and improvements. From Shortcuts to Google Cloud Storage and S3 compatible data sources in preview, Optimistic Job Admission for Fabric Spark, and New KQL Queryset Command Bar, that’s just a glimpse into this month’s update. There’s much more to explore! … Continue reading “Microsoft Fabric April 2024 Update”
Microsoft Fabric March 2024 Update
Welcome to the March 2024 update. We have a lot of great features this month including OneLake File Explorer, Autotune Query Tuning, Test Framework for Power Query SDK in VS Code, and many more! Earn a free Microsoft Fabric certification exam! We are thrilled to announce the general availability of Exam DP-600, which leads to … Continue reading “Microsoft Fabric March 2024 Update”

COMMENTS
Many of these resources are free gifts of nature and can be used directly. 2. Sometimes, natural substances become resources only when their original form has been changed. 3. The air we breathe, the water in our rivers and lakes, the soils, minerals are all natural resources. 3. Technology is a human made resource.
CBSE Notes Class 8 Social Science Geography Chapter 1- Resources. Water, electricity, rickshaw, vegetable and textbook have something in common. They have all been used by you, so they have utility. Utility or usability is what makes an object or substance a resource.
Human-made resources have been created by human beings, whereas natural resources are provided by nature. Question 8. What is human resource development? Answer. Improving the quality of human skills in order to make them more useful is called human resource development. Class 8 Geography Chapter 1 Resources Short Answer Type Questions. Question 1.
Resources Class 8 Notes Social Science Geography Chapter 1. Resources: Anything that has some utility to satisfy our needs is known as a resource. Human beings are important resources because their ideas, knowledge and skills lead to the creation of new resources. Types of Resources: There are three types of resources—Natural resources, Man ...
On the basis of origin, a resource can be abiotic or biotic. • A biotic resource is the one that has life. • A abiotic resource is non-living. Natural resources may also be classified as renewable and non-renewable. • A renewable resource can be used without any risk of its ending up. They exist in unlimited quantity.
Practice MCQ Questions for Class 8 Geography with Answers on a daily basis and score well in exams. Refer to the Resources Class 8 MCQs Questions with Answers here along with a detailed explanation. Resources Class 8 MCQs Questions with Answers. Question 1. Coal is an example of (a) renewable resources (b) non-renewable resources (c) human ...
i. The types of resources on basis of stock are renewable and non-renewable resources. ii. All resources have some value. iii. Time and technology are two important factors that can change substances into resources. iv. On the basis of distribution resources can be ubiquitous or l ocalised. v.
The answers to the NCERT books are the best study material for students. Listed below are the chapter-wise NCERT Social Science Class 8 Solutions CBSE. • Chapter 1: Resources. • Chapter 2: Land, Soil, Water, Natural Vegetation and Wildlife Resources. • Chapter 3: Mineral and Power Resources.
Worksheet Geography Ch 6 Human Resources Class VIII Choose the correct answer: Question 1. When was Human Resource Development Ministry formed in India at central level of Government? (a) In 1990 (b) In 1985 (c) In 2004 (d) In 2009 Question 2.The average density of world's population is-
NCERT Solutions For Class 8 Geography Chapter 1 Resources - This article includes free NCERT Solutions For Class 8 Geography Chapter 1 Resources to help students of Class 8 learn the solutions and ace their exams.. It has been developed by the subject matter experts at GFG, according to the latest CBSE Syllabus 2023-24, and guidelines to help the students of Class 10 create a solid ...
Resources Class 8 Extra Questions and Answer Geography Chapter 1 Short Answers Type. Question 1. Describe the term Patent and Technology. Patent is meant by the exclusive right over any idea or invention. Technology is the application of latest knowledge and skill in doing or making things. Question 2.
Resources MCQs - Here is a compilation of Free MCQs of Class 8 Geography book Resources and Development Chapter 1 - Resources. Students can practice free MCQs as have been added by CBSE in the new exam pattern. At the end of Multiple Choice Questions, the answer key has also been provided for your reference. Take Free Online MCQs Test for ...
the electricity you use in your house, the rickshaw you use to get home from school, the textbook you. use to study are all resources. Your father has prepared a tasty snack for you. The fresh vegetables he. has used are also a resource". Water, electricity, rickshaw, vegetable and textbook have something in. common.
1.) Assertion (A)- Resources could become economically valuable. Reason (R)- if resources are patented and sold by a medical firm tomorrow. i.) A is correct but R is wrong. ii.) Both A and R are true and R is the correct explanation of A. iii.) Both A and R are true but R is not the correct explanation of A.
Steps To Attempt The Resources Class 8 MCQ. If students want to attempt Resources class 8 MCQ, they need to follow the following steps: The first step is to go to the official website of selfstudys i.e. selfstudys.com. Click on the three lines on the upper left side, and then tap on the 'CBSE' Option, scroll down and click on the option ...
NCERT Solutions Class 8 Geography Resources and Development Chapter 1 - Resources. NCERT Solutions for Class 8 Geography Chapter 1 - Resources are provided here for students to study and score good marks in the exams. Anything that can be used to satisfy a need, from the water we drink to the electricity we use in our house and the rickshaw we use to get home from school, are all ...
Nov 3, 2023. 10 minute read. Human resources is the 5 th chapter in the social science NCERT book. It describes the components of human resources, their importance and other important concepts related to this important resource. In this blog, we will learn about the Human Resources Class 8 Chapter and the important notes related to it.
Resources: Utilization and Development Class 8 DAV Notes. → All the things on the earth necessary for our existence are resources, for example, soil, minerals, vegetation, wildlife, etc. → Human beings are also considered as a resource because it is only with the help of human skill that the other resources can be developed.
2. Forbid Cliché Use. Probably the quickest and easiest way to cut back on some AI use is to come down hard on cliché use in writing assignments. AI tools are essentially cliché machines, so ...
Stream the UFC Fight UFC Fight Night: Barboza vs. Murphy live from %{channel} on Watch ESPN. Live stream on Saturday, May 18, 2024.
The chairman's mark also reflects a strategic reallocation of resources, as it cuts $1.17 billion from the Navy's request for a Constellation-class frigate due to delays in the program.
NCERT Solutions Class 8 Geography Chapter 6 Human Resources - Download Free PDF *According to the CBSE Syllabus 2023-24, this chapter has been renumbered as Chapter 5. NCERT Solutions for Class 8 Geography Chapter 6 - Human Resources are provided here for students to study and excel in their board exams. The term human resources refers to the size of the population of a country along with ...
Welcome to the May 2024 update. Here are a few, select highlights of the many we have for Fabric. You can now ask Copilot questions about data in your model, Model Explorer and authoring calculation groups in Power BI desktop is now generally available, and Real-Time Intelligence provides a complete end-to-end solution for ingesting, processing, analyzing, visualizing, monitoring, and acting ...